Federal Reserve Board Proposes to Produce Three New Reference Rates

Given questions about the transparency of the U.S. dollar LIBOR rate benchmark, and the quest for a more robust alternative, the US Federal Reserve Board has requested public comment on a proposal for the Federal Reserve Bank of New York, in cooperation with the Office of Financial Research, to produce three new reference rates based on overnight repurchase agreement (repo) transactions secured by Treasuries.

The most comprehensive of the rates, to be called the Secured Overnight Financing Rate (SOFR), would be a broad measure of overnight Treasury financing transactions and was selected by the Alternative Reference Rates Committee as its recommended alternative to U.S. dollar LIBOR. SOFR would include tri-party repo data from Bank of New York Mellon (BNYM) and cleared bilateral and GCF Repo data from the Depository Trust & Clearing Corporation (DTCC).

“SOFR will be derived from the deepest, most resilient funding market in the United States. As such, it represents a robust rate that will support U.S. financial stability,” said Federal Reserve Board Governor Jerome H. Powell.

Another proposed rate, to be called the Tri-party General Collateral Rate (TGCR) would be based solely on triparty repo data from BNYM. The final rate, to be called the Broad General Collateral Rate (BGCR) would be based on the triparty repo data from BNYM and cleared GCF Repo data from DTCC.

The three interest rates will be constructed to reflect the cost of short-term secured borrowing in highly liquid and robust markets. Because these rates are based on transactions secured by U.S. Treasury securities, they are essentially risk-free, providing a valuable benchmark for market participants to use in financial transactions.

Comments on the proposal to produce the three rates are requested within 60 days of publication in the Federal Register, which is expected shortly.

US Housing Bubble 2.0: Number Of Homebuyers Putting Less Than 10% Down Soars To 7-Year High

From Zero Hedge.

A really long, long time ago, well before most of today’s wall street analysts made it through puberty, the entire international financial system almost collapsed courtesy of a mortgage lending bubble that allowed anyone with a pulse to finance over 100% of a home’s purchase price…with pretty much no questions asked.

And while the millennial titans of high finance today may consider a decade-old case study on mortgage finance to be about as useful as a Mark Twain novel when it comes to underwriting mortgage risk, they may want to considered at least taking a look at the ancient finance scrolls from 2009 before gleefully repeating the sins of their forefathers.

Alas, it may be too late.  As Black Knight Financial Services points out, down payments, the very thing that is supposed to deter rampant housing speculation by forcing buyers to have ‘skin in the game’, are once again disappearing from the mortgage market.  In fact, just in the last 12 months, 1.5 million borrowers have purchased a home with less than 10% down, a 7-year high.

Over the past 12 months, 1.5M borrowers have purchased a home by putting down less than 10 percent, which is close to a seven-year high in low down payment purchase volumes

– The increase is primarily a function of the overall growth in purchase lending, but, after nearly four consecutive years of declines, low down payment loans have ticked upwards in market share over the past 18 months

– Looking back historically, we see that half of all low down payment lending (less than 10 percent down) in 2005-2006 involved piggyback second liens rather than a single high LTV first lien mortgage

– The low down payment market share actually rose through 2010 as the GSEs and portfolio lenders pulled back, the PLS market dried up, and FHA lending buoyed the purchase market as a whole

– The FHA/VA share of purchase lending rose from less than 10 percent during 2005-2006 to nearly 50 percent in 2010

– As the market normalized and other lenders returned, the share of low-down payment lending declined consistent with a drop in the FHA/VA share of the purchase market

On the bright side, at least Yellen’s interest rate bubble means that today’s housing speculators don’t even have to rely on introductory teaser rates to finance their McMansions...Yellen just artificially set the 30-year fixed rate at the 2007 ARM teaser rate…it’s just much easier this way.

“The increase is primarily a function of the overall growth in purchase lending, but, after nearly four consecutive years of declines, low down payment loans have ticked upward in market share over the past 18 months as well,” said Ben Graboske, executive vice president at Black Knight Data & Analytics, in a recent note. “In fact, they now account for nearly 40 percent of all purchase lending.”

At that time half of all low down payment loans being made involved second loans, commonly known as “piggyback loans,” but today’s mortgages are largely single, first liens, Graboske noted.

The loans of the past were also far riskier – mostly adjustable-rate mortgages, which, according to the Black Knight report, are virtually nonexistent among low down payment mortgages today. Instead, most are fixed rate. Credit scores of borrowers taking out these loans today are also about 50 points higher than those between 2004 and 2007.

Finally, on another bright note, tax payers are just taking all the risk upfront this time around…no sense letting the banks take the risk while pretending that taxpayers aren’t on the hook for their poor decisions…again, it’s just easier this way.

US Firms Coy About Borrowing More

From Moody’s

Comparatively thin high-yield bond spreads complement an increased willingness by banks to supply credit to businesses. The increased willingness to make business loans owes much to a benign outlook for defaults.

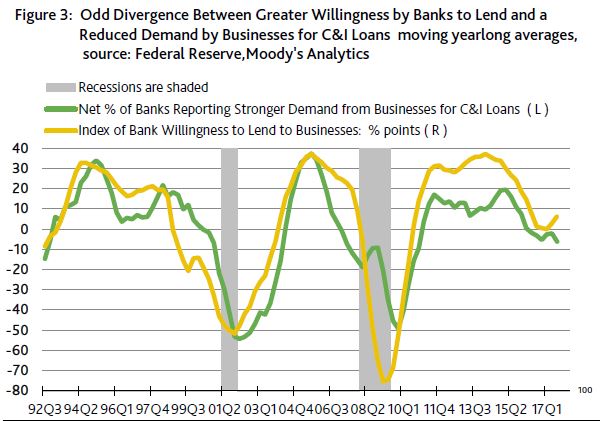
According to the Fed’s latest survey of senior bank loan officers, the net percent of banks tightening business — or commercial & industrial (C&I) — loan standards dipped from the +2.2 percentage point average of the four-quarters-ending with Q2- 2017 to the -3.9 points of Q3-2017. Moreover, the net percent of banks widening interest-rate spreads on new business loans plunged from the -7.9 percentage point average of the year-ended Q2-2017 to Q3-2017’s -21.1 points.

Though banks are more willing to lend to businesses, the business sector’s demand for C&I loans has receded. The same Fed survey of senior bank loan officers also found that the net percent of banks reporting a stronger demand for C&I loans from business customers sank from the -2.1 percentage-point average of the year-ended June 2017 to Q3-2017’s -11.8 points, which was the lowest quarter-long score since Q4-2011’s -15.7 points. However, Q4-2011’s reading followed a string of strong results as shown by the +14.9-point average of yearlong 2011.

By contrast, as of Q3-2017, the yearlong average of the net percent of banks reporting a stronger demand for C&I loans from business customers dropped to -6.2 points for its lowest such average since the -9.5 points of yearlong 2010. (Figure 3.)

Business borrowing says cycle upturn is past its prime

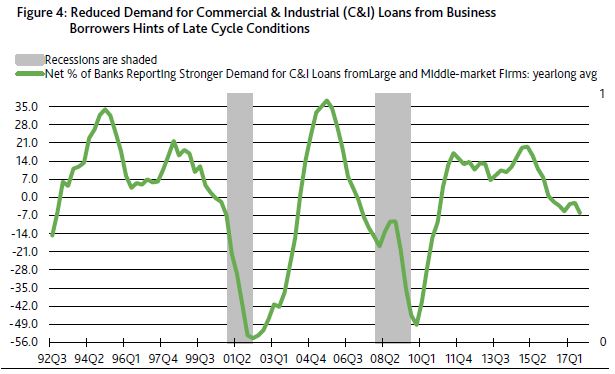
It is worth noting how the latest slide by the business-sector’s demand for C&I loans has occurred more than four years following a recession. In the context of a mature business cycle upturn, the yearlong average of the net percent of banks reporting a stronger demand for C&I loans previously sank to the -6.2 points of the span-ended Q3-2017 in Q2-2007 and Q4-2000.

Recessions materialized within 12 months of the previous two comparable drops by the business sector’s demand for bank credit. Granted the US may stay clear of a recession well into 2018, but the reality is that the current business cycle upturn is showing signs of age. Thus, the upside for interest rates is limited, especially if the annual, or year-to-year, rate of core PCE price index inflation stays under 2%. (Figure 4.)

A pronounced slowing by the annual growth rate of outstanding bank C&I loans from Q2-2016’s 10.2% surge to Q2-2017’s 2.2% rise is in keeping with a softer demand for C&I loans by business borrowers. However, the pace of newly rated bank loan programs from high-yield issuers tells a much different story.

After surging by 140.2% in Q1-2017 from Q1-2016’s depressed pace, the annual increase of new high-yield bank loan programs slowed to 2.1% in Q2-2017. Nonetheless, recent activity suggests the year-over-year growth rate for new high-yield bank loan programs will accelerate to roughly 16% during 2017’s third quarter. Support for this view comes from July 2017’s $52.4 billion of new bank loan programs from high-yield issuers that more than doubled the $24.1 billion of July 2016.

Lately, the growth of high-yield bank loan programs has been powered by refinancings of outstanding debt and the funding of acquisitions. Today’s relative ease of refinancing outstanding debt at easier terms highlights ample systemic liquidity, which will help suppress the incidence of default. Abundant liquidity also facilitates the take-over of weaker, default prone businesses by financially stronger entities. (Figure 5.)

Wells Fargo’s Auto Insurance Practices

From Moody’s

Last Thursday, Wells Fargo & Company announced an $80 million remediation plan for auto loan customers that it had incorrectly charged for collateral protection insurance (CPI) between 2012 and 2017. The announcement is credit negative for Wells Fargo. The remediation costs are relatively immaterial at approximately 1% of its pre-tax quarterly earnings, but the announcement is yet another negative reputational headline for the bank. Despite the limited financial effect, we expect that the announcement will exacerbate the damage to Wells Fargo’s reputation in this past year.

Wells Fargo requires auto loan customers to maintain comprehensive and collision insurance for financed autos during the term of the loan. The bank’s CPI program purchased auto insurance on the customer’s behalf from a third party if proof of auto insurance had not been provided. Wells Fargo’s review of its CPI program and related third-party vendor practices, which began in July 2016 and was prompted by customer concerns, found that approximately 570,000 customers may have been negatively and incorrectly affected.

Roughly 490,000 customers were incorrectly charged for CPI despite having satisfactory auto insurance of their own. Approximately 60,000 customers did not receive adequate notification and disclosure information from the vendor before the bank’s purchase of CPI on their behalf. Finally, for 20,000 customers, the required payments for the incorrectly placed CPI may have contributed to the default of their loan and repossession of their vehicle. Wells Fargo’s $80 million remediation plan intends to rectify financial harm to these customers. As a result of its initial findings, Wells Fargo discontinued its CPI program in September 2016.

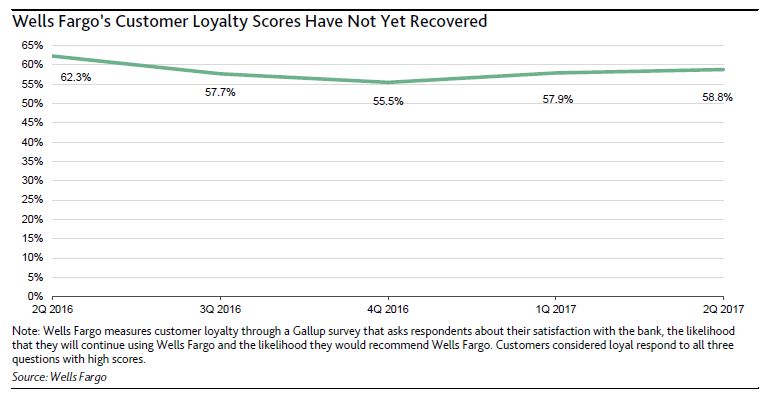
Wells Fargo historically had strong customer satisfaction scores and a reputation for sound risk management. In September 2016, its lead bank subsidiary agreed to pay $185 million to federal regulators and the Office of the Los Angeles, California, City Attorney to settle sales practice issues. The settlement revealed that Wells Fargo’s retail banking incentive structure had led to pervasive inappropriate sales practices. The fallout from revealing the sales practices deficiencies resulted in a hit to Wells Fargo’s customer loyalty measure, shown in the exhibit below. Although the metric has improved from its fourthquarter 2016 low, the latest announcement could add pressure. However, on the positive side, there has been no significant sign of client attrition, despite the negative effect on customer loyalty metrics.

Furthermore, any resulting regulatory investigations, lawsuits or political inquiries could add to the bank’s costs, particularly for litigation. In particular, we have previously noted that the high end of Wells Fargo’s range for reasonably possible potential litigation losses in excess of its established liability was $2.0 billion at the end of the first quarter, up from $1.8 billion at year-end 2016 and $1.3 billion at year-end 2015. On the bank’s second-quarter earnings call, before this announcement, management indicated the high end of this range could grow by another $1.3 billion. Although these potential litigation costs are manageable given Wells Fargo’s robust pre-tax earnings, this recent announcement adds to profitability challenges the bank continues to face.

Fed Holds Rate, Confirms Intent

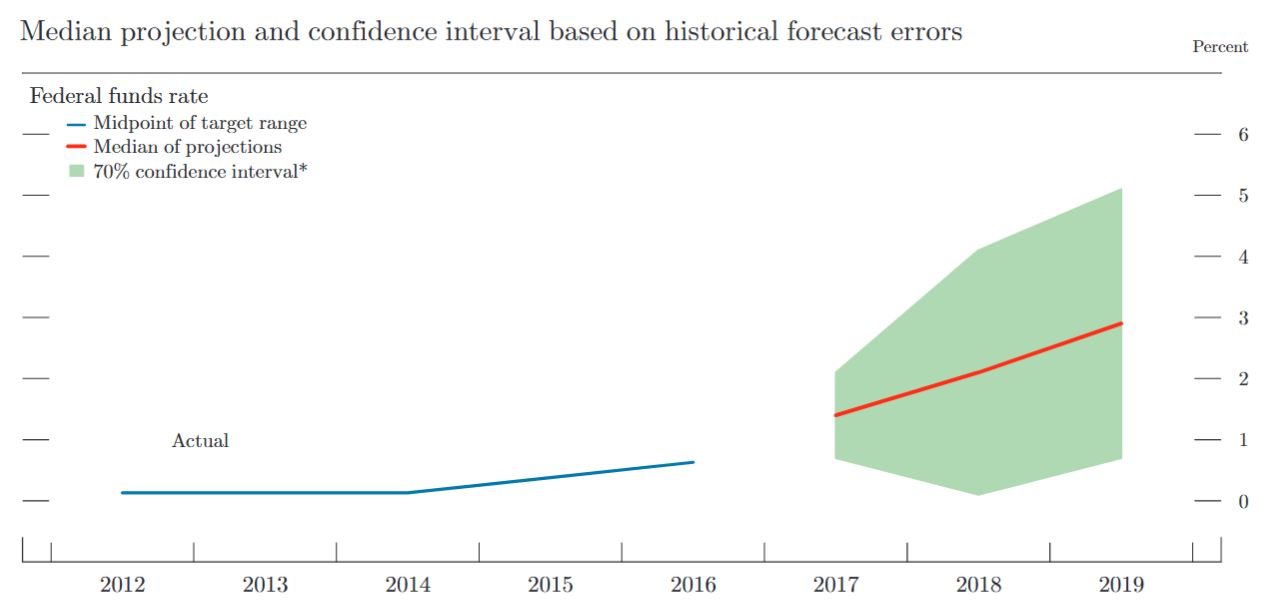
The latest statement from the FED says the US economic momentum continues, if but slowly. Inflation and income remains on the low side. So they kept the fed funds rate at current levels, but signalled continued future rises. Balance sheet normalisation has yet to start, but says it will commence.

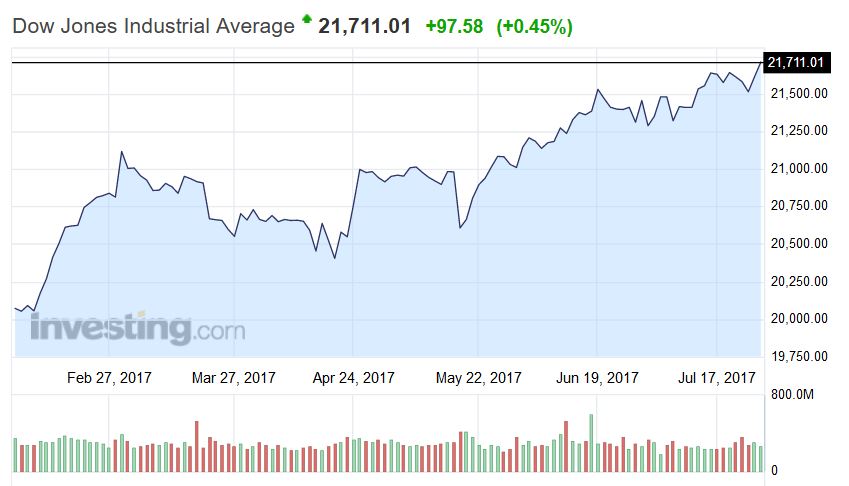
U.S. stocks closed higher, buoyed by strong earnings and the Feds decision.

Information received since the Federal Open Market Committee met in June indicates that the labor market has continued to strengthen and that economic activity has been rising moderately so far this year. Job gains have been solid, on average, since the beginning of the year, and the unemployment rate has declined. Household spending and business fixed investment have continued to expand. On a 12-month basis, overall inflation and the measure excluding food and energy prices have declined and are running below 2 percent. Market-based measures of inflation compensation remain low; survey-based measures of longer-term inflation expectations are little changed, on balance.

Consistent with its statutory mandate, the Committee seeks to foster maximum employment and price stability. The Committee continues to expect that, with gradual adjustments in the stance of monetary policy, economic activity will expand at a moderate pace, and labor market conditions will strengthen somewhat further. Inflation on a 12-month basis is expected to remain somewhat below 2 percent in the near term but to stabilize around the Committee’s 2 percent objective over the medium term. Near-term risks to the economic outlook appear roughly balanced, but the Committee is monitoring inflation developments closely.

In view of realized and expected labor market conditions and inflation, the Committee decided to maintain the target range for the federal funds rate at 1 to 1-1/4 percent. The stance of monetary policy remains accommodative, thereby supporting some further strengthening in labor market conditions and a sustained return to 2 percent inflation.

In determining the timing and size of future adjustments to the target range for the federal funds rate, the Committee will assess realized and expected economic conditions relative to its objectives of maximum employment and 2 percent inflation. This assessment will take into account a wide range of information, including measures of labor market conditions, indicators of inflation pressures and inflation expectations, and readings on financial and international developments. The Committee will carefully monitor actual and expected inflation developments relative to its symmetric inflation goal. The Committee expects that economic conditions will evolve in a manner that will warrant gradual increases in the federal funds rate; the federal funds rate is likely to remain, for some time, below levels that are expected to prevail in the longer run. However, the actual path of the federal funds rate will depend on the economic outlook as informed by incoming data.

For the time being, the Committee is maintaining its existing policy of reinvesting principal payments from its holdings of agency debt and agency mortgage-backed securities in agency mortgage-backed securities and of rolling over maturing Treasury securities at auction. The Committee expects to begin implementing its balance sheet normalization program relatively soon, provided that the economy evolves broadly as anticipated; this program is described in the June 2017 Addendum to the Committee’s Policy Normalization Principles and Plans.


Understanding Banking from the Ground Up

From The St. Louis Fed On The Economy Blog.

Weak U.S. family balance sheets have driven more Americans to the “fringe” of the American banking system. But is this necessarily a bad thing?

The Federal Reserve’s Board of Governors recently released a shocking report showing that, if confronted with an unanticipated $400 expense, nearly half (44 percent) of Americans would have to sell something, borrow or simply not pay at all.1

Other surveys have been equally concerning:

This balance sheet fragility, especially illiquidity, is fueling the demand among Americans—and clearly, as the above data suggest, among middle-class Americans—for “alternative” financial services, including those from payday lenders, auto title lenders, check cashers and the like.

But should we be too critical of their financial choices? Is patronizing an alternative provider necessarily a poor or irrational choice? And do we ban payday lenders and the like because of annual percentage rates that are often in excess of 300 percent?

A Conversation with Lisa Servon on Unbanking

I wrestled with these questions following a recent St. Louis Fed event titled “The Banking and Unbanking of America”—featuring Lisa Servon, author of The Unbanking of America: How the New Middle Class Survives—and I think the answer to these questions is no.

Servon wondered: If these services are so bad, why have check-cashing transactions grown 30 percent between 1990 and 2010 while payday lending transactions tripled between 2000 and 2010?

According to Servon, it turns out that banks (with a growing number of encouraging exceptions) haven’t been serving these customers well, including charging more and higher fees for account opening, maintenance and overdrafts. Meanwhile, struggling consumers are turning to alternative providers (as well as to community development credit unions) because they value:

  • Greater transparency (with actual costs clearly displayed like signs in a fast-food restaurant)
  • Better service (including convenient hours, locations and friendly, multilingual staff)

What I really liked is that Servon—an East Coast, Ivy League academic—didn’t just arrive at these conclusions by only reading reports and talking to experts. She actually became a teller at both a payday lender in Oakland, Calif., and a check casher in the South Bronx, N.Y.

Mapping Financial Choices

I also like that several of my Community Development colleagues here at the St. Louis Fed have embraced this community-driven understanding of financial decision-making as well through a “system dynamics” research study, which maps the actual factors that influence the financial choices consumers make.

Like Servon’s work, the forthcoming version of this study will focus less on the narrow “banked/unbanked” framework and more on the broader, CFSI-inspired idea of “financial health.”

Other Areas to Address

Beyond adopting the financial health framework, Servon also suggests rethinking the government/banking relationship and supporting smart regulation so financial innovation or risk taking can thrive with some protections.

Most importantly, in my view, she recommends addressing the macro problems—for example, flat or declining real wages, less full-time and stable employment, and weaker unions—that underlie the demand for the immediate cash that alternative providers offer so well, albeit not so cheaply.

But it’s also true that weak balance sheets—the micro—contribute to the macro problem: Strapped consumers just don’t spend as much. So, we really must address both.

Notes and References

1Report on the Economic Well-Being of U.S. Households in 2016.” Board of Governors of the Federal Reserve System, May 19, 2017.

2 Gutman, Aliza; Garon, Thea; Hogarth, Jeanne; and Schneider, Rachel. “Understanding and Improving Consumer Financial Health in America.” Center for Financial Services Innovation, March 24, 2015.

3The Precarious State of Family Balance Sheets.” The Pew Charitable Trusts, January 2015.

Author: By Ray Boshara, Senior Adviser and Director, Center for Household Financial Stability

Who Would Be Affected by More Banking Deserts?

From The St. Louis Fed On The Economy Blog.

Although technology has made it easy to bank from almost anywhere, personal and public benefits are still derived from bank branches. In areas without branches—commonly referred to as “banking deserts”—the costs and inconveniences of cashing checks, establishing deposit accounts, obtaining loans and maintaining banking relationships are exacerbated.

Banking Deserts a Growing Concern?

The closing of thousands of bank branches in the aftermath of the last recession has intensified societal concerns about access to financial services among low-income and minority populations, groups that are often affected disproportionately in such situations. The number of people stranded in areas devoid of bank services would probably expand in the future if branches continue to close.

From this perspective, available resources may be better spent trying to prevent more deserts than trying to repopulate existing deserts with new branches.

What Areas Are at Risk?

In the figure below, we isolated branches that were outside the 10-mile range of any others. That is, we found branches that would create new banking deserts if closed. Our analysis is based on demographic and economic data collected for the county subdivision in which each branch is located.

Banking Deserts

We identified 1,055 potential deserts in 2014, of which 204 were in urban areas and 851 in rural areas. The urban areas had a combined population of 2 million, while the rural areas had a combined population of 1.9 million.

These potential deserts have relatively low population densities of 26 people per square mile in urban areas and 12 people per square mile in rural areas. Comparative densities outside potential deserts are, respectively, 176 and 26 people per square mile. In other words, areas with dispersed populations are more at risk of becoming a banking desert.

Potential Effects of New Banking Deserts

Median incomes are $46,717 in potential urban deserts and $41,259 in potential rural deserts. This suggests that any desert expansion would affect lower-income people more than higher-income people.

Minorities constitute 9.8 percent of the population in potential urban deserts and 4.0 percent of the population in potential rural deserts. Both percentages are lower than those for existing deserts and nondeserts. This suggests that newly created deserts may not disadvantage minorities to a greater extent than existing deserts do.

Branches in potential deserts are small, with median deposits of $23 million in urban areas and $20 million in rural areas. They tend to be operated by small banks, with median total assets of $776 million in urban areas and $317 million in rural areas.

The small size of these branches and the banks that own them suggest that what stands between a community and its isolation within a new banking desert are not the decisions made by big banks with a national footprint but, rather, the decisions made by locally oriented community banks. Additionally, potential deserts are more likely to be located in Midwestern states.

The Market’s Expectations about FOMC Meetings

From The St. Louis Fed On The Economy Blog.

There are eight scheduled Federal Open Market Committee (FOMC) meetings each year. However, not all FOMC meetings are created equal. A prescheduled press conference follows four of the eight meetings (those held in March, June, September and December in 2017). This allows the chairperson to present the FOMC’s current economic projections and provide additional context for policy decisions.

Many believe that the FOMC prefers to make policy changes at meetings with a press conference because the opportunity for communication reduces uncertainty in the markets. A brief examination of the data suggests that markets hold this belief.

The Federal Funds Rate Target

The federal funds rate target is an important policy tool controlled by the FOMC, allowing it to influence short-term and long-term interest rates. As the FOMC continues the rate hike cycle it began in December 2015, future target rates are the subject of much speculation by market participants.

Using federal funds rate futures, projections of future target rates are computed each trading day. The figure below plots the market estimates of rate increases at future FOMC meetings following the Jan. 31-Feb. 1 meeting, which affirmed a target range of 0.5 to 0.75 percent.

rate hike probability

The orange line indicates the probability that the federal funds rate target is between 0.75 to 1.0 percent at the March meeting for each trading day between Jan. 31 to March 14, the date of the March meeting.

For example, on Feb. 1, the market gave a 28.8 percent chance that the target would be at 0.75 to 1.0 percent at the March meeting. Given that the next meeting as of Feb. 1 was the March meeting, the 28.8 percent was indeed the rate hike probability for the March meeting.

Similarly, the blue line plots the same probability for May. On Feb. 1, the market gave a 35.9 percent probability that the target would be at 0.75 to 1.0 percent after the May meeting.

However, the May meeting would be the second meeting after Feb. 1, so the interpretation of this 35.9 percent probability is slightly different. It represents the probability of a rate hike at either the March meeting or the May meeting.

Market Expectations of Rate Increases

Does the market expect the FOMC to change the federal funds rate target only at meetings accompanied by a press conference? We can answer this question by comparing changes in the market’s projection between two consecutive meetings.

Let’s first compare the market’s expectation between the press conference meeting in March and the nonconference meeting in May.

The March and May FOMC Meetings

As discussed earlier, the orange line indicates the rate hike probability for the March meeting, and the blue line indicates the rate hike probability for the March or May meeting. Hence, the difference between these two probabilities can be thought of as the probability of a rate hike only at the May meeting.

If the market expects that the federal funds rate target can only be changed at the conference meeting in March and remain the same at the nonconference meeting in May, then we should see that the orange line and the blue line follow each other closely until the date of the March meeting with a difference that is close to zero.

This is exactly what we observe. Right before the March meeting, both probabilities approached 100 percent, indicating that the market expected a rate hike at the March meeting followed by no change at the nonconference meeting in May.

The May and June FOMC Meetings

Similarly, we can compare the rate hike probabilities between the nonconference meeting in May and the press conference meeting in June, which are indicated by the red line and the purple line:

  • The red line represents the rate hike probability for the May meeting.
  • The purple line indicates the rate hike probability for the May meeting or the June meeting.

Hence, the difference between the lines indicates the probability of a rate hike at the June meeting only.

The red line suggests that the probability of a rate hike at the May meeting is essentially zero after the March meeting occurred. Given that the market assigned a rate hike probability of zero for the May meeting, the rate hike probability for the June meeting is essentially equal to the probability indicated by the purple line. It started around 50 percent right after the March meeting and gradually approached 100 percent right before the June meeting. This is additional evidence that market participants expect rate hikes to occur only at the conference meetings.

Effects of FOMC Press Conferences

The market seems to believe that important policy changes can only be done at meetings accompanied by a press conference. If that is the intention of the FOMC, then the role of these nonconference meetings becomes ambiguous. In addition, if economic conditions change enough that a policy response is required at a nonconference meeting, should the FOMC pursue the policy change or wait until the next meeting with a press conference? If this is not the intention of the FOMC, should the FOMC consider equalizing the meetings to correct the bias expected among market participants?

How Trump’s nominee for the Fed could turn central banking on its head

From The Conversation.

President Donald Trump on July 10 nominated Randal Quarles to be one of the seven governors of the Federal Reserve System, the central bank of the United States.

Before I get to Quarles and his qualifications, it’s important to understand the Fed and what it does. Its decisions are vital to every person on the planet who borrows or lends money (pretty much everybody) since it has enormous influence over global interest rates. Its board of governors also influences most other aspects of the global financial system, from regulating banks to how money is wired around the world.

Quarles, for his part, is clearly qualified for a job at the pinnacle of financial regulation. He has held numerous positions in the U.S. Treasury Department, including undersecretary for domestic finance under George W. Bush, and was the U.S. executive director at the International Monetary Fund (IMF). He has also worked on Wall Street for The Carlyle Group and founded his own investment company, The Cynosure Group. He also has a law degree from Yale.

The issue that I believe deserves careful scrutiny, however, does not involve his qualifications. Rather it’s a view of his that, if allowed to permeate the Fed, would represent a seismic shock to how the central bank operates and could potentially have severe consequences if – or when – we stumble into another financial crisis like the one we endured only a decade ago.

Trump Fed nominee Randal Quarles, left, talks with then-central bank Chair Alan Greenspan in 2002. Reuters/Hyungwon Kang

How the Fed controls the world

Currently, the Fed rules the financial world using a very simple model: A handful of very smart people sit together at least eight times a year and decide how to execute the country’s monetary policy.

The implications are enormous. In the words of the Fed itself, decisions made in these meetings:

“trigger a chain of events that affect other short-term interest rates, foreign exchange rates, long-term interest rates, the amount of money and credit and, ultimately, a range of economic variables, including employment, output and prices of goods and services.”

Janet Yellen currently chairs this group, called the Federal Open Market Committee (FOMC), and its decisions, like those of the Supreme Court, are final. There are few or no absolute rules, and there is no appeal.

Quarles, however, has described the discretionary decisions of this small group as “a crazy way to run a railroad.”

Instead, Quarles argues that the Fed should use a rules-based approach, with little or no discretion. Economic data would be plugged into a simple model, which would spit out the decision the Fed should take.

Since the model would be well-known and the relevant economic data (such as GDP, inflation rates, etc.) are already widely publicized, everyone from Wall Street to Main Street who cares about interest rates would be able to predict how the Fed is going to react under such a rules-based approach.

The Taylor rule

While Quarles has not specifically referred to which rule he would favor, a frequently cited one is called the “Taylor rule.”

It is named after Stanford economist John B. Taylor, who proposed it in 1993 as a new guiding principle for central bank decision-making. In recent years, the rule has gained much interest among people who watch and study the Fed.

The Taylor rule states that the Fed should establish short-term interest rates using a mathematical formula. It would use the current rate as a starting point and then factor in data tied to inflation and GDP, both based on the difference between the actual figures and the bank’s targets.

John Taylor created his eponymous rule to guide central bank decision-making. AP Photo/Ted S. Warren

Inflation is an important variable because price changes impact people’s standard of living, while GDP growth affects the number of jobs available in the economy.

Since it would rely on a few human inputs from the Fed, the Taylor rule is somewhat flexible, enough to accommodate different situations by allowing central bankers to specify the importance of inflation compared with GDP growth.

Some countries, like Germany, primarily focus on keeping inflation extremely low. Others, such as the U.S., try to balance both inflation and GDP growth roughly equally. Central banks in some developing countries like those in Africa often put stronger emphasis on boosting economic growth with less regard to inflation.

But that’s about as far it will stretch.

Why does this matter?

In general, the Taylor rule would lead central banks to increase interest rates when inflation is high or when unemployment is very low. Conversely, the rule indicates central banks should lower interest rates when inflation is too low (or there is deflation), when economic growth is poor or unemployment is climbing.

But therein lies the rub. Rules work well when things are “normal,” but when the unexpected happens, they become much less useful – even harmful.

If the Taylor rule were an effective and straightforward method of transforming complex choices into simple, easy-to-understand decisions, the question is, why doesn’t every central bank use this rule?

The answer is as simple as the Taylor rule itself. Sometimes a country faces an economic quandary, such as what the U.S. experienced during the oil price shocks of the late 1970s. Back then, inflation was too high and GDP growth was too low, leaving the country stuck in what is known as a period of stagflation.

In these circumstances, the Taylor rule breaks down. It tells central bankers there is nothing they can do to improve economic conditions. The rule signals that interest rates need to be raised to combat high inflation, yet at the same time that would weaken already-sluggish GDP growth.

Had the U.S. followed the Taylor rule back then, it would have done nothing. Instead, the Fed raised interest rates and broke the back of inflation expectations.

What’s crazier

Simply put, central bankers around the world – including those at the Fed – have not adopted rules-based monetary policy using the Taylor rule or another because in times of economic crisis, a simple precept usually fails to provide effective solutions.

The current ad-hoc approach provides maximum flexibility and allows central bankers to reach for untested methods that help them get the economy back on track.

Quarles may be right. It might be a crazy way to run a railroad. But then again, monetary policy – and the US$18.6 trillion U.S. economy – is a bit more complex than operating a train on a set of rails. The crazy thing might be to do it any other way.

Author: Jay L. Zagorsky, Economist and Research Scientist, The Ohio State University

Fed Will Lift Rates, And Remove Funding Support

The Federal Reserve Board and the Federal Open Market Committee released the minutes of the Committee meeting held on June 13-14, 2017.

They are expecting the benchmark rate to continue to rise, as inflation normalises.

They also provided more colour around the normalisation of the balance sheet. This will have significant market impact.

All participants agreed to augment the Committee’s Policy Normalization Principles and Plans by providing the following additional details regarding the approach the FOMC intends to use to reduce the Federal Reserve’s holdings of Treasury and agency securities once normalization of the level of the federal funds rate is well under way.

The Committee intends to gradually reduce the Federal Reserve’s securities holdings by decreasing its reinvestment of the principal payments it receives from securities held in the System Open Market Account. Specifically, such payments will be reinvested only to the extent that they exceed gradually rising caps.

  • For payments of principal that the Federal Reserve receives from maturing Treasury securities, the Committee anticipates that the cap will be $6 billion per month initially and will increase in steps of $6 billion at three-month intervals over 12 months until it reaches $30 billion per month.
  • For payments of principal that the Federal Reserve receives from its holdings of agency debt and mortgage-backed securities, the Committee anticipates that the cap will be $4 billion per month initially and will increase in steps of $4 billion at threemonth intervals over 12 months until it reaches $20 billion per month.
  • The Committee also anticipates that the caps will remain in place once they reach their respective maximums so that the Federal Reserve’s securities holdings will continue to decline in a gradual and predictable manner until the Committee judges that the Federal Reserve is holding no more securities than necessary to implement monetary policy efficiently and effectively.

Gradually reducing the Federal Reserve’s securities holdings will result in a declining supply of reserve balances. The Committee currently anticipates reducing the quantity of reserve balances, over time, to a level appreciably below that seen in recent years but larger than before the financial crisis; the level will reflect the banking system’s demand for reserve balances and the Committee’s decisions about how to implement monetary policy most efficiently and effectively in the future. The Committee expects to learn more about the underlying demand for reserves during the process of balance sheet normalization.

The Committee affirms that changing the target range for the federal funds rate is its primary means of adjusting the stance of monetary policy. However, the Committee would be prepared to resume reinvestment of principal payments received on securities held by the Federal Reserve if a material deterioration in the economic outlook were to warrant a sizable reduction in the Committee’s target for the federal funds rate.

Moreover, the Committee would be prepared to use its full range of tools, including altering the size and composition of its balance sheet, if future economic conditions were to warrant a more accommodative monetary policy than can be achieved solely by reducing the federal funds rate.