Mortgage Crisis 2.0: BofA CEO Wants To Slash Down Payments To Help Poor Millennials

From Zero Hedge.

Among a host of other issues, one the critical things that contributed to the housing crisis of 2008 was the fact that speculative borrowers had nearly no “skin in the game.”  Anyone who decided they wanted a piece of the rapidly inflating housing bubble could go out and buy multiple houses with no money down or, in some cases, even do “cash out” purchases whereby banks would finance more than 100% of the purchase price leaving ‘buyers’ to pocket the excess.

Shockingly, such terrible underwriting standards was a really bad idea.  Turns out that offering investors infinite returns on capital, given that they could purchase millions of dollar worth of assets without ponying up a single penny, causes wild speculation resulting in devastating asset bubbles.

But, in the wake of one of the worst asset bubbles in history, new legislation came along requiring traditional mortgage borrowers to put 20% down when purchasing a new home.

Ironically, the new owner of one of the worst mortgage lenders of the 2008 era, is now arguing that down payment requirements should be slashed in half.  Speaking to CNBC, Bank of America CEO Brian Moynihan, the proud owner of Countrywide Financial, said that his mission is to reduce mortgage down payment requirements to 10% for traditional loans.  Per CNBC:

 “But, you know, I think at the end of the day is people forget that, at different points in your life and different points on what you’re doing in life requires you to think about housing differently as a place for you and your friends, as a place for you and maybe your significant other, and then ultimately, a place for family. That drives change. And so yes, it’s taken more time. And we talked a lot about this, you know, four or five years ago, that if you require a 20% down payment, it takes just a little more time to accumulate 20% than it would 3% or none, which is what the rules were for a short period of time.”

“So our goal, going back to regulatory reform, is should you move the down payment requirement from 20% to 10%? Wouldn’t introduce that much risk.”

“But would actually help a lot of mortgage to get done. And if you look at the statistics, the difference between 80 and 90 LTV –loan-to-value – isn’t much different as it is between 95 and 90. That’s when you start to see real differences in performance statistics. And so we don’t want to wish people into borrowing money that then they have trouble repaying.”

Of course, we’re certain that Moynihan’s sole purpose for wanting to lower down payments is to help those poor millennials living in mom’s basement and has nothing to do with the fact that’s he’s lost a ton of fee revenue to government-backed loans that only require a 3% down payment.FHA

But, why not?  Gradually destroying lending standards worked out really well last time around.

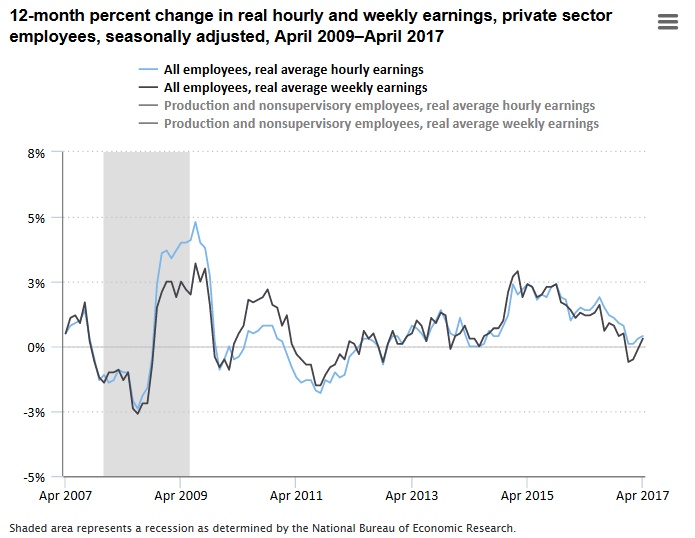
US Real hourly earnings up 0.4 percent over the year ending April 2017

The US Bureau of Statistics says real average hourly earnings increased 0.4 percent, seasonally adjusted, for all private sector employees from April 2016 to April 2017. The increase in real average hourly earnings combined with no change in the average workweek resulted in a 0.3-percent increase in real average weekly earnings over the year.

Real average hourly earnings for production and nonsupervisory employees increased 0.1 percent, seasonally adjusted, from April 2016 to April 2017. The increase in real average hourly earnings combined with a 0.3-percent increase in the average workweek for these workers resulted in an over-the-year increase in real average weekly earnings of 0.5 percent.

These data are from the Current Employment Statistics program. Earnings data for the most recent 2 months are preliminary.

The Growing Skill Divide in the U.S. Labor Market

The St. Louis Fed On The Economy Blog has highlighted a polarization in the labor market, between skilled employees capable of performing the challenging tasks in the cognitive nonroutine occupations and entry-level employees that are physically strong enough to perform the manual nonroutine tasks.

Over the past several decades, the skill composition of the U.S. labor market has shifted. Employers are hiring more workers to perform nonroutine types of tasks (such as managerial work, professional services and personal care) and fewer workers for routine operations (such as construction and manufacturing). This shift in the type of skills in demand is referred to as job polarization.

One way to see evidence of job polarization is to look at employment growth in certain occupational classifications. The figure below divides occupational employment growth into four groups:

  • Cognitive Nonroutine: managers, computer scientists, architects, artists, etc.
  • Manual Nonroutine: food preparation, personal care, retail, etc.
  • Cognitive Routine: office and administrative, sales, etc.
  • Manual Routine: construction, manufacturing, production, etc.

average annual employment growth

The black lines represent the average growth rate across all occupations within a group, while the bars represent the growth rate in that particular occupation.

The fastest growing occupational groups are cognitive nonroutine and manual nonroutine, both growing about 2 percent every year on average since the 1980s. Cognitive routine and manual routine occupations are growing significantly slower, less than 1 percent on average (or shrinking, in the case of production occupations).

Physical Demands of Work

One of the implications of job polarization is a shift in the type of work required to be performed by the average employee. A new survey from the Bureau of Labor Statistics—the Occupational Requirements Survey—gathers data on the type of work performed in each occupation.

The figure below looks at two physical task requirements:

  • The percentage of hours in an eight-hour day spent standing or walking
  • The percentage of workers required to perform pushing or pulling tasks with one or both hands

physical task requirements

The most physically demanding occupational groups are manual nonroutine and manual routine. In both of these groups, on average more than half of the employees are required to push or pull with their hands, and over half of their day is spend standing or walking.

In contrast, less than 35 percent of workers in the cognitive nonroutine and cognitive routine groups push or pull with their hands. These groups also spend much less time standing/walking.

Decision-Making at Work

The last figure looks at two cognitive task requirements:

  • The percentage of workers where decision-making in uncertain situations or conflict is required
  • The percentage of workers whose supervision is based on broad objectives and review of results

These requirements are easier to think about in terms of a spectrum. For example, occupations that require less cognitive activity either lack decision-making entirely or involve straightforward decisions from a predetermined set of choices.

Similarly, occupations with a greater cognitive requirement usually involve broad objectives with end-result review only, while more manual occupations require detailed instructions and frequent interactions with supervision (for example, a consultant’s quarterly performance review versus daily quality control checks in a factory).

cognitive task requirements

By a large margin, the cognitive nonroutine occupations involve more challenging decision-making and less frequent interactions with supervision. The other occupational groups all have fewer than 10 percent of employees engaging in these types of cognitive tasks.

Job Growth According to Skill Requirements

The figures above show a stark contrast between the skill requirements in the two occupational groups growing the fastest. The cognitive nonroutine group requires complex decision-making, independent working conditions and less physical effort, while the manual nonroutine group still requires quite a bit of physical effort and does not involve a high level of cognitive tasks.

US Jobs Up

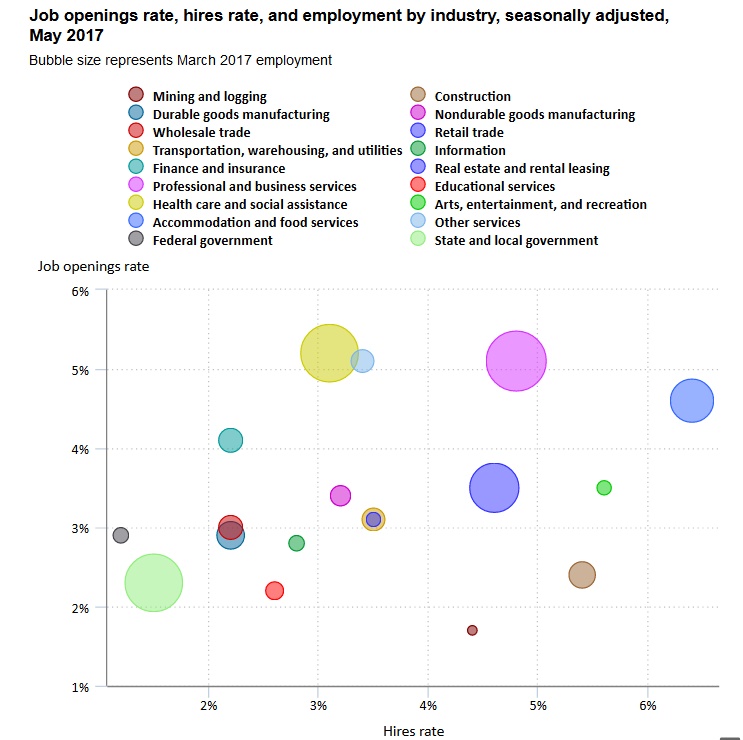
The US Bureau of Labor Statistics says the March 2017 job openings rate for total nonfarm was 3.8 percent, and the hires rate was 3.6 percent. Job openings rates in finance and insurance; professional and business services; health care and social assistance; and accommodation and food services were higher than the overall rate.  Rates were lower in mining and logging; construction; durable and nondurable goods manufacturing; wholesale and retail trade; transportation, warehousing, and utilities; information; real estate and rental leasing; educational services; arts, entertainment, and recreation; and federal, and state and local government.

Hires rates were higher than the total nonfarm rate in mining and logging; construction; retail trade; professional and business services; arts, entertainment, and recreation; and accommodation and food services. Hires rates were lower in durable and nondurable goods manufacturing; wholesale and retail trade; transportation, warehousing, and utilities; information; finance and insurance; real estate and rental leasing; educational services; other services; and federal and state and local government.

Industries with high job openings rates and high hires rates need more workers, and hiring is strong. In March 2017, industries in this category included professional and business services and accommodation and food services.

Industries with low job openings rates and low hires rates have few job openings and are hiring few workers. In March 2017, industries in this group included federal and state and local government, educational services, and information.

The data is preliminary, from the Job Openings and Labor Turnover Survey and are seasonally adjusted.

Much Doubt Surrounds VIX Index’s Optimism

From Moody’s

Financial markets were recently visited by a rarity. During the past week, the VIX index closed under 10 points on May 8 and 9. Since its start in 1990, the VIX index has closed under 10 points on only 11, or 0.1%, of the span’s nearly 7,000 trading days.

Today’s very low VIX index reflects a great deal of confidence that there won’t be a deep sell-off by equities. Not only is there effectively little demand for insuring against a harsh correction, but sellers of such insurance are will to accept a low price for protection against a market plunge.

This insouciance seems odd given how richly priced the US equity market is relative to corporate earnings and the prospective returns from other assets such as corporate bonds. The current market value of US common stock — according to a model based on pretax profits from current production and Moody’s long-term Baa industrial company bond yield — exceeds its midpoint valuation by a considerable 24%. During 1999-2000’s memorable equity rally, the market value of US stocks first climbed 24% above its projected midpoint in 1999’s first quarter and would remain at least that high through 2000’s second quarter. During January 1999 through June 2000, the actual market value of US common stock exceeded its projected midpoint by 51%, on average.

Another comparison of the two periods shows a similarly striking difference between them. The earlier period averages of a 15.4:1 ratio for the market value of common stock to pretax operating profits and 8.05% for the long-term industrial company bond yield were far above the recent ratio of 11.7:1 and the latest Baa industrial yield of 4.68%.

In stark contrast to the current situation, during January 1999 through June 2000 the VIX index averaged a substantially higher 24.3 points when the market value of US common stock was at least 24% above its projected midpoint. Back then, the market had a greater appreciation of the considerable downside risk implicit in an overvalued equity market.

Two prior cases of a below-10 VIX index preceded vastly different outcomes

January 2007 and December 1993 were the two prior moments when the VIX index spent some time under the 10-point threshold. What followed them differed drastically.

January 2007 was merely 11 months before the December 2007 start to the worst recession since the Great Depression. In contrast, December 1993 was followed by 1994’s 4.0% annual advance by real GDP that was the first of a seven year span that had real GDP growing by a now unheard of 4.0% annually, on average. Far different was 2007’s 1.8% annual rise by real GDP that was at the start of what would be real GDP’s 0.9% average annual rise of the seven-years-ended 2013.

In the year following December 1993’s ultra-low VIX score, the market value of US common stock fell by -3.2% despite 1994’s 18.6% surge by pretax operating profits. A lift-off by the average 10-year Treasury yield from Q4-1993’s 6.13% to Q4-1994’s 7.96% was to blame for 1994’s short-lived drop by share prices. Nevertheless, partly because of 1994’s very strong showing by business activity, the earnings-sensitive high-yield bond spread narrowed from Q4-1993’s 438 bp to Q4-1994’s 350 bp.

For the year following January 2007’s brief stay by a less than 10-point VIX index, a drop by the 10-year Treasury yield from January 2007’s 4.64% to January 2008’s 4.00% failed to stave off a -3.4% drop by the market value of US common stock largely because of yearlong 2007’s -7.5% contraction of pretax operating profits. A swelling by the high-yield bond spread from January 2007’s 287 bp to January 2008’s 674 bp stemmed from the worsened outlook for business activity.

VIX Index and high-yield EDF differ drastically on yield spreads

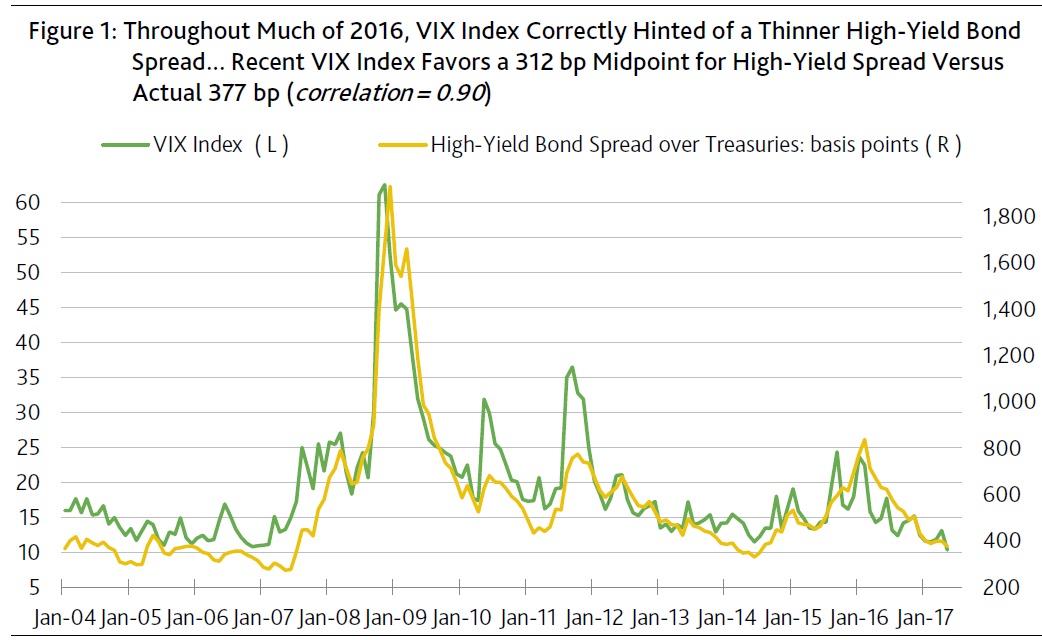
May-to-date’s average VIX index of 10.4 points favors a 312 bp midpoint for the high-yield bond spread, which is much thinner than the recent actual spread of 377 bp. Throughout much of 2016, the VIX index proved to be a reliable leading indicator of where the high-yield spread was headed. Nevertheless, if only because the VIX index now resides in the bottom percentile of its historical sample, a higher VIX index is practically inevitable. Once the VIX index approaches its mean, the high-yield spread will be much wider than the recent 377 bp. (Figure 1.)

U.S. Bank Loan Losses to Rise as Loan Growth Halts In 1Q17

Quarterly earnings generally improved for U.S. banks in the first quarter of 2017, but loan growth came to a halt and loan losses are likely to increase over the near to medium term, according to Fitch Ratings’ U.S. Banking Quarterly Comment. Provision expenses for the 18 largest U.S. banks covered in the report rose 8% in 1Q17 from 4Q16 and loan losses in nominal terms increased on a linked-quarter basis. Growing concern in asset quality, particularly in credit cards, auto, and retail loan exposure from the disruption of e-commerce could contribute to increased loan losses going forward.

“Better capital markets results, lower taxes from new accounting guidance and modest improvement in spread income boosted earnings for the majority of U.S. banks, however, loan growth came to a standstill, expenses and credit costs climbed and mortgage revenue slowed during the quarter,” said Julie Solar, Senior Director, Fitch Ratings.

Overall industry-wide loan balances declined 2.5% on an annualized basis. For the large U.S. banks, this trend was less pronounced, with total loans down approximately 0.8% on an annualized basis. Pay-downs in energy credits, large corporate borrowers accessing the capital markets, discipline in maintaining risk-adjusted returns, and seasonally lower credit card balances all contributed to the decline in loans. Many borrowers are also waiting for more definitive policies from Washington despite improving business optimism before borrowing.

“Looking ahead, loan growth will be dependent on continued economic growth and will vary by loan category particularly with concerns in auto and signs that banks are demonstrating greater commercial lending discipline,” said Joo-Yung Lee, Managing Director, Fitch Ratings.

Twelve of the 18 banks reported higher net income in 1Q17 than in 4Q16 and several banks reported increases in net interest margins (NIM) including M&T Bank, Bank of America, Fifth Third Bancorp, and BB&T. The better NIM is largely due to the December 2016 interest rate increase as the March rate rise came too late in the quarter to materially impact the results. Capital markets results for the five large global trading and universal banks increased 19% in aggregate from 1Q16, with most of the improvement in equity and debt underwriting, up 92% and 51%, respectively, from the prior year.

In addition, several banks benefited from one-time tax benefits from the adoption of new stock-based compensation guidance. Goldman Sachs saw a large benefit witch the change accounting for 21% of its income. The new guidance is expected in impact first quarter results going forward.

Bank capital ratios remain solid with a median CET1 of 10.8% at March 31, 2017. Commentary from banks indicates that capital distributions will increase across the industry.

US Inflation’s Bad Breadth May Help Contain Interest Rates

From Moody’s

Though US consumer price inflation is well contained, Fed policymakers cannot help but notice the potential threat to financial stability emanating from ongoing equity price inflation. As long as US equities become more richly priced relative to both current and prospective earnings, the Fed has more than enough reason to hike rates. A further swelling of the US equity bubble will increase Fed rate-hike risks.

Not too long ago, the high-yield bond spread swelled and the projected default rate soared. However, that intensification of credit stress would be quickly reversed mostly because debt repayment problems were largely confined to the oil and gas industry. In other words, the late 2015 and early 2016 worsening of corporate credit conditions lacked enough breadth to endanger both financial stability and the business cycle upturn.

Some still hold that inflation will come roaring back. For now, however, price inflation has been confined to housing, medical care, share prices, and industrial commodities (including energy). However, industrial commodity prices have softened of late. For example, Moody’s industrial metals price index was recently -7.2% under its latest 52-week high of November 28, 2016 and was down by a deep -31.1% from its record high of April 2011. Moreover, the price of WTI crude oil was recently off by -12.2% from its latest 52-week high of February 23, 2017.

Despite the plunge by the US unemployment rate from Q1-2012’s 8.3% to Q1-2017’s 4.7%, the accompanying annual rate of PCE price index inflation slowed from 2.5% to 2.0%. Moreover, even after excluding food and energy prices, core PCE price index inflation also decelerated from Q1-2012’s 2.1% to the 1.7% of Q1-2017.

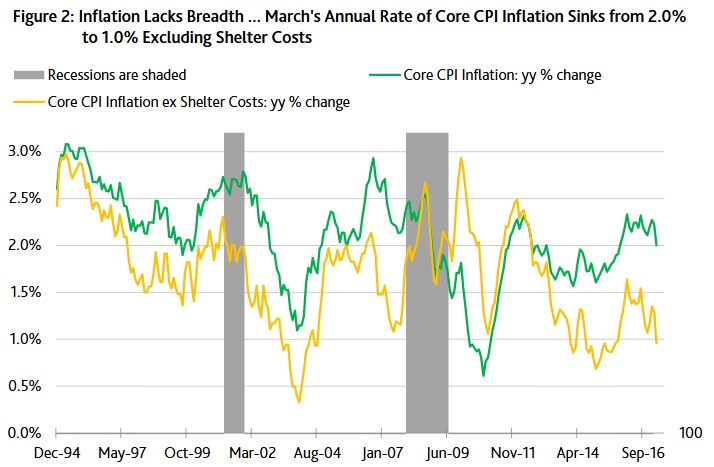
Excluding food and energy products, the US core consumer price inflation has been skewed higher by shelter costs. For example, March’s 2.0% annual rate of core CPI inflation slowed to 1.0% after excluding a 3.5% annual jump by shelter costs that supply 42% of core CPI. And recent indications are that renters’ rent inflation may soon slow owing to an abundance of new housing units coming on line in some of the US’ largest metropolitan regions.

Today, some cite the recent climb by broad measures of price inflation as signaling the approach of significantly higher interest rates. With real GDP growth expected to sputter along in a range of 2% to 2.5% annually through 2018 how else can you explain expectations of a climb by the 10-year Treasury yield from its recent 2.35% to 3.3% by 2018’s final quarter?

Often, reference is made to a tighter labor market for the purpose of invoking a sense of danger regarding a possible imminent return of runaway price inflation. According to one highly-respected economics group, “ the U.S. economy has now reached full employment and is likely to overshoot meaningfully, a path that has often proven risky”.

Nevertheless, large numbers of labor force dropouts suggest that the unemployment rate may be overstating labor market tightness. For example, though the unemployment rate plunged by -3.6 percentage points from Q1-2012’s 8.3% to Q1-2017’s 4.7%, the ratio of payrolls to the working-age population rose by a smaller +2.2 points from Q1-2012’s 55.1% to Q1-2017’s 57.3%. Coincidentally, despite how 2005-2007 showed a much higher 59.5% ratio of payrolls to the working-age population, by no means did any overheating by the labor market prove risky.

Put simply, the Phillips Curve is not what it used to be. A lower unemployment rate now supplies less of a lift to price inflation compared to the past. In fact, sometimes consumer price inflation slows notwithstanding a substantially lower jobless rate.


Financial CHOICE Act Passage Would Be Credit Negative for US Banks

From Moody’s.

Last Wednesday, the US House of Representatives’ Financial Services Committee held a hearing on the Financial CHOICE Act of 2017, which was introduced on 19 April and aims to provide banks relief from various provisions of the Dodd-Frank Wall Street Reform and Consumer Protection Act enacted in 2010.

The proposed legislation envisions a broad reduction in regulatory and supervisory requirements that would be negative for banks’ creditworthiness, increasing the potential asset risk in the banking system and the likelihood of a disorderly unwinding of a failed systemically important bank.

Increased likelihood of a disorderly bank resolution.

Among the CHOICE Act’s most notable provisions is the repeal of Title II of Dodd-Frank, including the orderly liquidation authority (OLA) to resolve highly interconnected, systemically important banks. Although the bill calls for a new section of the bankruptcy code to accommodate the failure of large, complex financial institutions, we believe that dismantling the OLA increases the likelihood of a disorderly wind-down of a failed systemically important bank with greater losses to creditors. Additionally, although the aim of repealing Title II is to end “too big to fail,” without the enactment of a credible replacement bank resolution framework, the actual effect could be the opposite.

A credible operational resolution regime (ORR) to replace OLA would require provisions specifically intended to facilitate the orderly resolution of failed banks and would provide clarity around the effect of a bank failure on its depositors and other creditors, its branches and affiliates.

The intent of OLA is to resolve failed banks as going concerns, preserving bank franchise value so as to limit losses to bank creditors and counterparties. If, under the new legislation, failed banks are liquidated instead of being resolved as going concerns, loss rates suffered by creditors would increase.

A disorderly resolution would also have greater repercussions for the broader financial markets and the economy. This suggests that although the intent of eliminating OLA may be to reduce the likelihood of future bank bailouts, absent an ORR we believe that the likelihood of a US government bailout of a systemically important US bank could actually increase.

A return to greater risk-taking, only partly offset by improved profitability prospects. The CHOICE Act would also ease restrictions on risk-taking by eliminating the Volcker Rule and rolling back the supervisory function of the US Consumer Financial Protection Bureau (CFPB), limiting it instead to the enforcement of specific consumer protection laws. Eliminating the Volcker Rule restrictions on proprietary trading could reverse the decline in banks’ trading inventories and private equity and hedge fund investments since the financial crisis. That decline in trading inventories has contributed to a decline in risk measures such as value at risk. How far inventories rebound and proprietary trading pick up will take time to become evident, but increased risk seems likely. Changes to the CFPB could also add risk by lifting the regulatory scrutiny that has caused banks to scale back or eliminate some riskier consumer lending products (such as payday advances).

The CHOICE Act also imposes a variety of restrictions and requirements on US banking regulators that could erode the robustness of US banking regulation. More generally, weakened supervision and oversight create the potential for increased asset risk in the banking system. From a credit risk standpoint, the resulting uptick in credit costs and tail risks from increased risk-taking would outweigh the potential boost to bank profitability from reduced compliance expenses and new revenue opportunities.

Less robust capital supervision and stress-testing.

The CHOICE Act calls for a reduction in the frequency of regulatory stress testing, and an exemption from enhanced US Federal Reserve supervision, including stress-testing, for banks with a Basel III supplementary leverage ratio of at least 10%. These measures would undermine the post-crisis Dodd-Frank Act Stress Test (DFAST) and Comprehensive Capital Analysis and Review (CCAR) regimes, which have driven both an increase in capital ratios and a more conservative approach to capital management.

We believe that DFAST and CCAR have been successful tools in reducing the risk of bank failures, not only improving capital and placing beneficial restrictions on shareholder distributions but, more importantly, stimulating vast improvements in banks’ internal risk management and capital planning processes. The DFAST and CCAR results are a useful, independent and public tool to analyze banks’ stress capital resilience over time. The public disclosures from these exercises are an important data point for creditors, the market and our own stress-testing analysis, and provide a strong incentive for bank management teams to closely manage and fully resource their stress-testing and capital-planning processes.

Treasury Yields May Fall Short of Consensus Views

From Moody’s

Once again, the 10-year Treasury yield confounds the consensus. As of early April, the consensus had predicted that the benchmark 10-year Treasury would average 2.6% during 2017’s second quarter. To the contrary, the 10-year Treasury yield has averaged a much lower 2.29% thus far in the second quarter, including a recent 2.30%. Moreover, the 10-year Treasury yield has moved in a direction opposite to what otherwise might be inferred from March 14’s hiking of fed funds’ midpoint from 0.625% to 0.875%. For example, April 27’s 10-year Treasury of 2.30% was less than its 2.62% close of March 13, just prior to the latest Fed rate hike.

The latest decline by Treasury bond yields since March 14’s Fed rate hike stems from a slower than anticipated pace for business activity that has helped to rein in inflation expectations. March’s unexpectedly small addition of 98,000 workers to payrolls increases the risk of lower than expected household expenditures that could bring a quick end to the ongoing series of Fed rate hikes.

As inferred from the CME Group’s FedWatch tool, the fed funds futures contract assigns a negligible 4.3% probability to a Fed rate hike at the May 3 meeting of the FOMC. However, the likelihood of a rate hike soars to 70.6% at June 14’s FOMC meeting. Thus, do not be surprised if the policy statement of May 3’s FOMC meeting strongly hints of a June rate hike. Nevertheless, a June rate hike probably requires the return of at least 140,000 new jobs per month, on average, for April and May.

Unlike the Treasury bond market’s more sober view of business prospects since the March 14 rate hike, equities have rallied and the high-yield bond spread has narrowed. Incredibly, the VIX index sank to 10.6 on April 27, which was less than each of its prior month-long averages. The closest was the 10.8 of November 2006, or when the high-yield bond spread averaged 330 bp. Thus, if the VIX index does not climb higher over the next several weeks, the high-yield bond spread is likely to narrow from an already thin 385 bp.

Market value of common stock nears record percent of revenues

As equity market overvaluation heightens the risk of a deep drop by share prices, Treasury bonds become a more attractive insurance policy in case the equity bubble bursts. This is especially true if the next harsh equity-market correction is triggered by a contraction of profits, as opposed to an inflation-inspired jump by interest rates.

Equities are now very richly priced relative to corporate gross-value-added, where the latter aggregates the value of the final goods and services produced by corporations. Basically, gross value added nets out the value of the intermediate materials and services from which final products are produced.

The market value of US common stock now approximates 226% of the estimated gross value added of US corporations, where the latter is a proxy for corporate revenues. During the previous cycle, the ratio peaked at the 185% of Q2-2007 and then bottomed at the 103% of Q1-2009. The ratio is now the highest since the 231% of Q1-2000. Not only was the latter a record high, but it also coincided with a cycle peak for the market value of US common stock.

All else the same, the fair value of equities should decline as bond yields increase. Thus, the overvaluation implicit to Q1-2000’s atypically high ratio of the market value of common stock to corporate gross value added was compounded by Q1-2000’s relatively steep long-term Baa industrial company bond yield of 8.28%. Even if the market value of US common stock now matched Q1-2000’s 231% of corporate gross value added, Q1-2000’s equity market appears to be much more overvalued largely because the April 26, 2017 long-term Baa industrial company bond yield of 4.65% was well under the 8.28% of Q1-2000. (Figure 1.)

Consensus implicitly foresees record-long business upturn

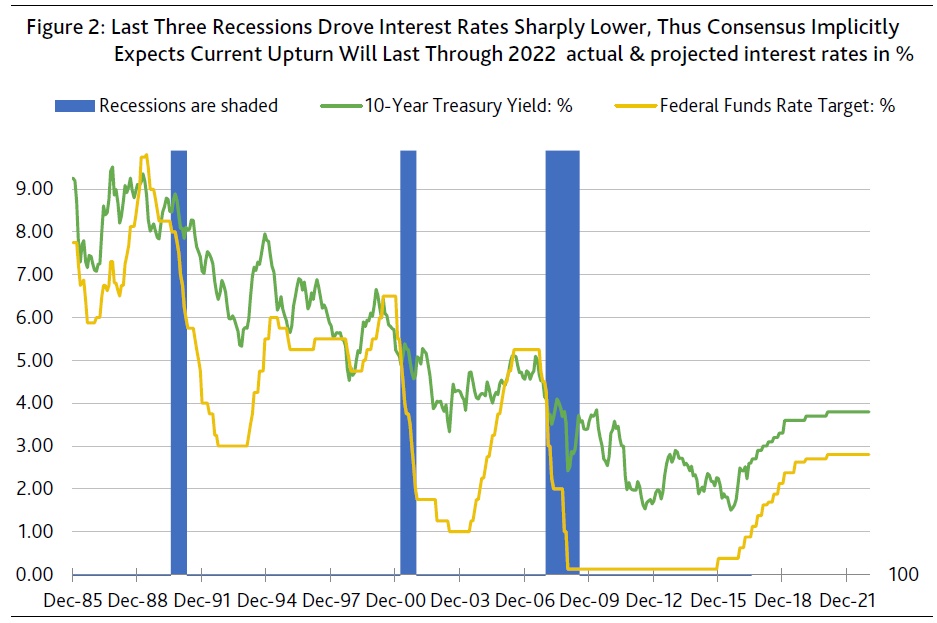
Be it the Blue Chip or the Bloomberg survey, the consensus long-term outlook for interest rates suggests a great deal of confidence in the longevity of the current business cycle upturn. April’s consensus projects a steady climb by fed funds and the 10-year Treasury yield into 2021, by which time the forecast looks for yearlong averages of 2.88% for the fed funds’ midpoint and 3.6% for the 10-year Treasury yield.

Thus, the consensus implicitly expects that the current economic recovery (which is about to finish its eighth year in July 2017) will reach an exceptional 12th year in 2021. The implied expectation of a record long business cycle upturn is derived from the observation that each previous recession since 1979 has prompted significant declines by both fed funds and the 10-year Treasury yield. The absence of any predicted drop by the 10-year Treasury yield’s yearlong average between now and the end of 2022 is tantamount to forecasting an economic recovery of record length. (Figure 2.)

The current record-holder among economic recoveries is the upturn of April 1991 through February 2001 that lasted about 9.75 years. In a distant second place is the upturn of December 1982 through June 1990 that covered roughly 7.5 years. If the consensus proves correct about the duration of the ongoing upturn, a seemingly overvalued equity market is far from exhausting its upside potential.

Long-term outlook on profits requires low long-term bond yields

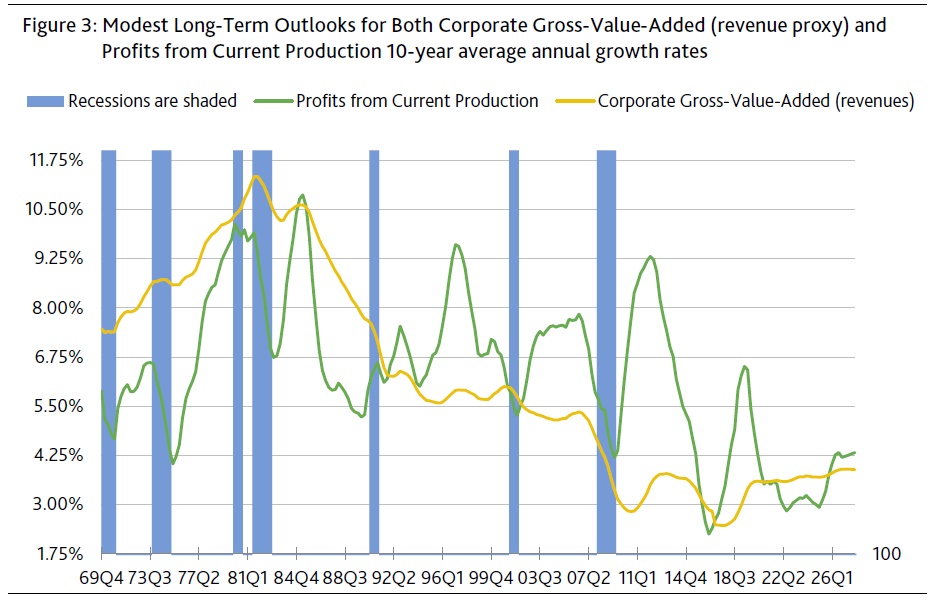
The consensus also maintains positive views on the near- and long-term outlook for pretax profits from current production. April’s Blue Chip consensus not only expects pretax operating profits to grow by 4.9% in 2017 and by 4.2% in 2018, but March’s long-term outlook projected profits growth in each of the five-years-ended 2023 of 4.0% annually, on average. The realization of seven consecutive years of profits growth requires the avoidance of a possibly disruptive climb by interest rates. Thus, the 10-year Treasury might well have difficulty spending much time above 3%, if, as expected, corporate gross value added’s average annual growth rate is less than 4%. (Figure 3.)

Housing’s Echo Bubble Now Exceeds The 2006-07 Bubble Peak

From Of The Two Minds Blog.

If you need some evidence that the echo-bubble in housing is global, take a look at this chart of Sweden’s housing bubble.

A funny thing often occurs after a mania-fueled asset bubble pops: an echo-bubble inflates a few years later, as monetary authorities and all the institutions that depend on rising asset valuations go all-in to reflate the crushed asset class.

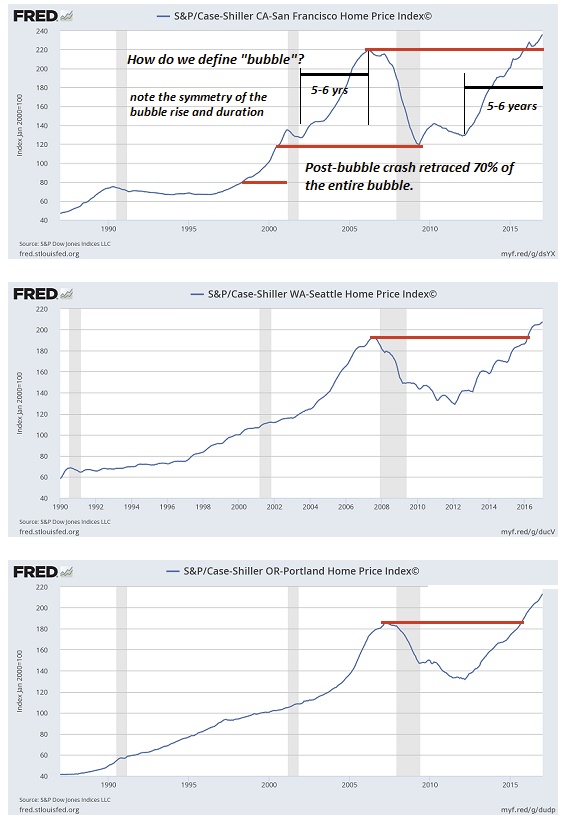
Take a quick look at the Case-Shiller Home Price Index charts for San Francisco, Seattle and Portland, OR. Each now exceeds its previous Housing Bubble #1 peak:

Is an asset bubble merely in the eye of the beholder? This is what the multitudes of monetary authorities (central banks, realty industry analysts, etc.) are claiming: there’s no bubble here, just a “normal market” in action.

This self-serving justification–a bubble isn’t a bubble because we need soaring asset prices–ignores the tell-tale characteristics of bubbles. Even a cursory glance at these charts reveals various characteristics of bubbles: a steep, sustained lift-off, a defined peak, a sharp decline that retraces much or all of the bubble’s rise, and a symmetrical duration of the time needed to inflate and deflate the bubble extremes.

It seems housing bubbles take about 5 to 6 years to reach their bubble peaks, and about half that time to retrace much or all of the gains.
Bubbles have a habit of overshooting on the downside when they finally burst. The Federal Reserve acted quickly in 2009-10 to re-inflate the housing bubble by lowering interest rates to near-zero and buying over $1 trillion of mortgage-backed securities.

When bubbles are followed by echo-bubbles, the bursting of the second bubble tends to signal the end of the speculative cycle in that asset class. There is no fundamental reason why housing could not round-trip to levels below the 2011 post-bubble #1 trough.

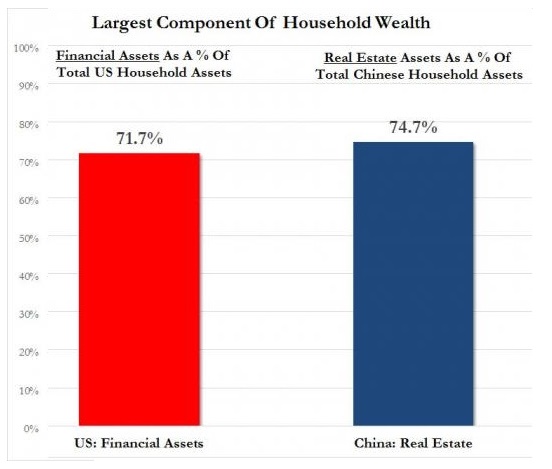
Consider the fundamentals of China’s remarkable housing bubble. The consensus view is: sure, China’s housing prices could fall modestly, but since Chinese households buy homes with cash or large down payments, this decline won’t trigger a banking crisis like America’s housing bubble did in 2008.

The problem isn’t a banking crisis; it’s a loss of household wealth, the reversal of the wealth effect and the decimation of local government budgets and the construction sector.

China is uniquely dependent on housing and real estate development. This makes it uniquely vulnerable to any slowdown in construction and sales of new housing.

About 15% of China’s GDP is housing-related. This is extraordinarily high. In the 2003-08 housing bubble, housing’s share of U.S. GDP barely cracked 5%.

Of even greater concern, local governments in China depend on land development sales for roughly 2/3 of their revenues. (These are not fee simple sales of land, but the sale of leasehold rights, as all land in China is owned by the state.)

There is no substitute source of revenue waiting in the wings should land sales and housing development grind to a halt. Local governments will lose a majority of their operating revenues, and there is no other source they can tap to replace this lost revenue.

Since China authorized private ownership of housing in the late 1990s, homeowners in China have only experienced rising prices and thus rising household wealth. The end of that “rising tide raises all ships” gravy train will dramatically alter China’s household wealth and local government income.If you need some evidence that the echo-bubble in housing is global, take a look at this chart of Sweden’s housing bubble. Oops, did I say bubble? I meant “normal market in action.”

Who is prepared for the inevitable bursting of the echo bubble in housing? Certainly not those who cling to the fantasy that there is no bubble in housing.