Credit Cycle Enjoys a Respite

From Moody’s

For the first time since 1987-1988, the US credit cycle has stabilized following a surge by credit rating downgrades relative to upgrades, a jump by the high-yield default rate, and a pronounced widening by corporate bond yield spreads. After six years at 49% of US high-yield credit rating revisions from July 2009 through June 2015, downgrades soared to 71% in the year-ended June 2016. Then downgrades eased to 58% for the year-ended March 2017 and sank to 48% during Q1-2017.

The much reduced relative incidence of downgrades was joined by a drop for the forward-looking high-yield EDF (expected default frequency metric from February 2016’s current recovery high of 8.1% to a recent 3.7% and a narrowing by the high-yield bond spread from February 2016’s nearly eight-year high of 839 bp to a recent 412 bp. In addition, after peaking at January 2017’s 5.9%, the US high-yield default rate has eased to March’s 4.7% and is projected to average 3.1% during 2017’s final quarter.

Market expects profits to again outpace corporate debt

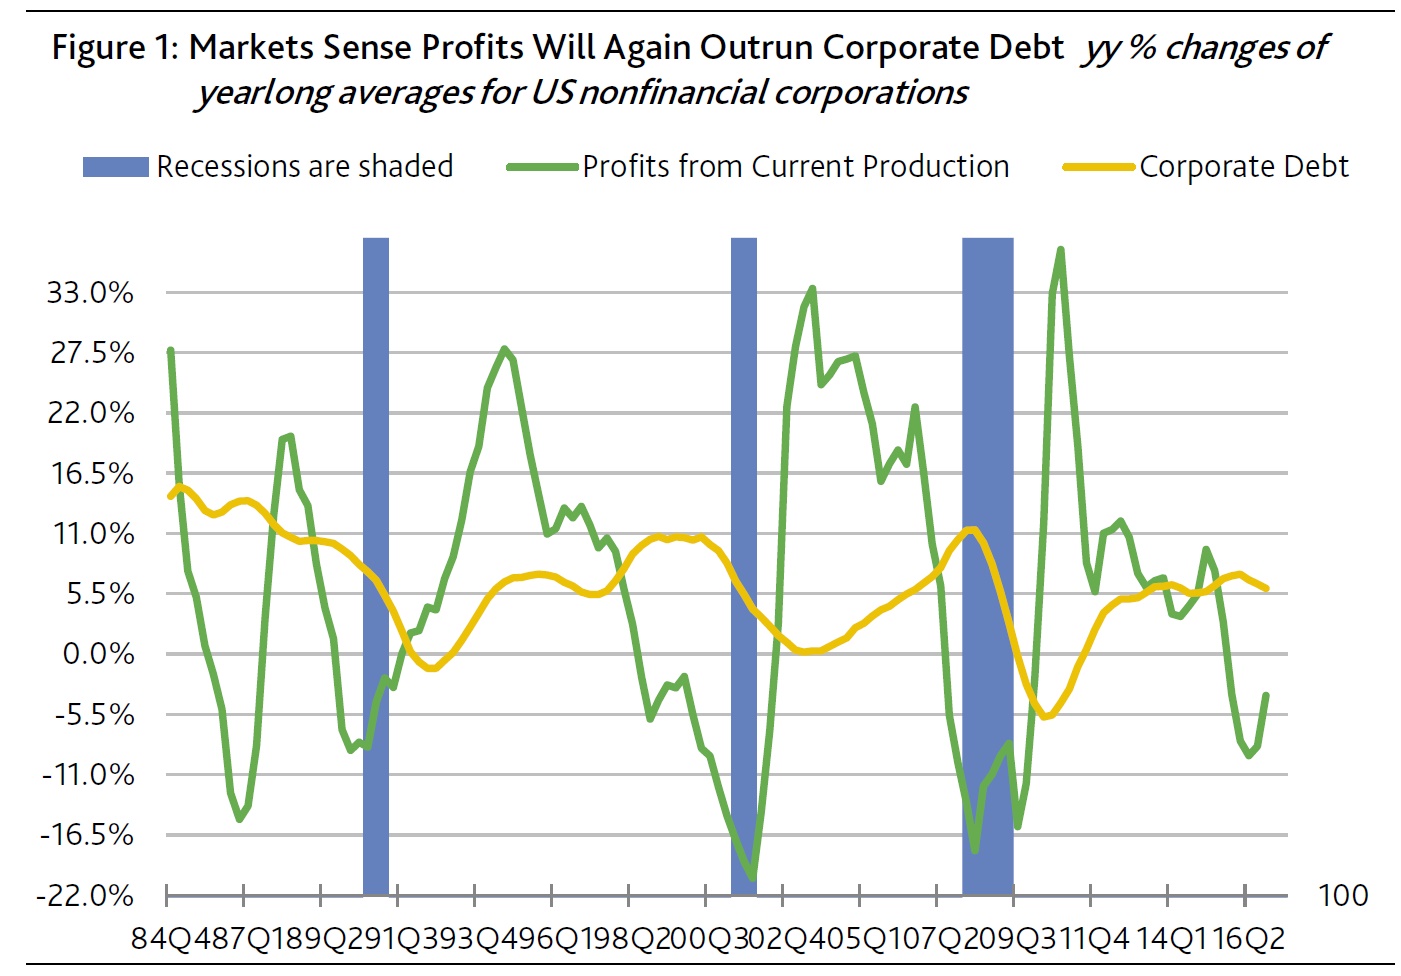
The deterioration of high-yield credit rating revisions comparing the six years ended June 2015 with the year ended June 2016 was linked to a dramatically different performance by nonfinancial-corporate profits from current production. After having advanced by 9.8% annually, on average, during the six years ended June 2015, profits from current production contracted by -9.2% annually during the year ended June 2016. The loss of financial flexibility to the shrinkage of profits was made worse by an acceleration of nonfinancial-corporate debt from the 2.5% average annualized rise of the six-years-ended June 2015 to the 6.8% year-over-year increase of the following 12 months. (Figure 1.)

Few broad-based trends weaken corporate credit quality more than the simultaneous contraction of earnings and expansion of debt. To the contrary, the faster growth of profits vis-a-vis debt typically lessens default risk significantly.

Fourth-quarter 2016 showed a narrowing of debt’s faster expansion vis-a-vis profits. For the first time since Q1-2015’s year-to-year increase of 12.0%, Q1-2017’s profits from current production managed to grow from a year earlier by 3.0%. Previously, this measure of profits had contracted annually in each of the six quarters ended Q3-2016 by -7.0%, on average, which had been joined by an accompanying 6.8% average yearly increase for corporate debt. Though Q4-2016’s 5.2% annual increase by corporate debt still outran profits’ 3.0% rise, at least it occurred in the context of profits growth, as well as slowing noticeably from when profits shrank.

Credit often gets pummeled when profits shrink while debt grows

The last two times a year-long contraction by profits was accompanied by an acceleration of corporate debt, the imbalance eventually inflicted heavy damage on corporate credit. The two earlier episodes commenced in Q2-2007 and Q1-1998.

Ultimately, corporate bond yield spreads ballooned and the high-yield default rate climbed sharply higher. The high-yield bond spread swelled from the 283 bp of Q2-2007 and the 338 bp of Q1-1998 to cycle highs of 1,678 bp for Q4-2008 and 971 bp for Q4-2002. In addition, the default rate soared from Q2-2007’s 1.5% and Q1-1998’s 2.5% to cycle highs of 14.5% for Q4-2009 and 10.9% for Q1-2002.

Credit survived mid-1980s drop by profits amid rapid debt growth

However, when corporate debt’s moving year-long average outran comparably measured profits beginning with Q2-1985 and ending in Q3-1987, both spread widening and the climb by the default rate were much more limited compared to 2007 and 1998. Better yet, unlike 1998 and 2007, 1986’s simultaneous contraction of profits and expansion of debt did not eventually lead to a recession.

Markets now sense that the 2015-2016 bout of brisk debt growth amid shrinking profits will mimic what transpired in the mid-1980s and, thus, will be succeeded by a profits recovery that outpaces corporate debt. That is exactly what occurred from Q4-1987 through Q4-1988, when profits’ 15.0% annualized advance well outran the still lively 10.3% annualized growth of corporate debt.

Nevertheless, the 1987-1988 reprieve was short lived. By year-long 1989, the unfavorable imbalance returned, as profits contracted by -6.9% annually while corporate debt grew by +9.6%.

The experience of the mid- to late-1980s warns against becoming too optimistic if, as the market implicitly expects, profits again outrun debt by late 2017. By itself, the current upturn’s maturity suggests that pent-up demand has been mostly depleted. For example, despite the most attractive auto sales incentives since 2009, unit sales of light motor vehicles fell from a year earlier in 2017’s first quarter. Elsewhere, a growing number of retail chains struggle with lower than expected sales.

The pace of home sales during housing’s peak selling season of March through June will provide critical insight regarding the health of domestic expenditures. If home sales unexpectedly stall, profits may be incapable of outpacing corporate debt, which would widen spreads significantly and worsen the now benign outlook for defaults. Comparably to what transpired in the 1980s, corporate credit’s current reprieve may not last much longer than a year. And that would be especially true if short- and long-term interest rates rose to heights that are too burdensome for financial markets and business activity.

High-yield downgrades eclipse upgrades when focusing on fundamentals
The US high-yield credit rating revisions of 2017’s first quarter showed the most upgrades relative to downgrades since 2014’s third quarter. A preliminary count revealed 89 upgrades and 83 downgrades. However, the accompanying revisions of investment-grade ratings showed three more downgrades (17) than upgrades (14).

It is important to note that not all rating revisions are the consequence of changed fundamentals. For example, some rating revisions stem from changes in creditor protection owing to the issuance of new debt. Other revisions not viewed as fundamentally driven include stand-alone special-events such as mergers, acquisitions, divestitures, equity buybacks, special dividends, and infusions of common equity capital.

Whenever fundamentals and special events simultaneously trigger a rating revision, the rating change is tallied as driven by fundamentals. Only when the influence of fundamentals is viewed as negligible is the revision deemed to be for some other reason.

Recognizing the impossibility of establishing unequivocally that a rating change was due only to fundamentals, fundamentals appear to have been responsible for 54 of Q1-2017’s high-yield upgrades and 59 of the high-yield downgrades. Thus, when considering only rating changes caused by fundamental drivers, Q1-2017 was home to more high-yield downgrades than upgrades.

The first-quarter 2017 upgrade share of high-yield credit rating changes fell from 52% to 48% after limiting the sample to fundamentally-driven revisions. Fundamentals last figured in more high-yield upgrades than downgrades in 2014’s third quarter, or when non-financial corporations posted lively year-to-year advances of 5.8% for gross-value-added and 11.3% for profits from current production, as the high-yield spread averaged a thin 376 bp.

Comparable revenue and earnings results for 2017’s first quarter are not yet available, though the consensus looks for implied year-long 2017 gains of 4.3% for gross-value-added and 5.0% for pretax operating profits. First-quarter 2017’s high-yield bond spread of 397 bp was much thinner than the 477 bp of Q4-2016, or when upgrades’ share of high-yield rating changes fell from 32% overall to just 27% when limited to fundamentals.

A switch to the opposite direction held for investment-grade revisions, too, where the 11 upgrades led the eight downgrades when limiting the sample to fundamentally driven rating changes. Mergers and acquisitions (M&A) figured in nine of the 17 investment-grade downgrades, but entered into fewer three of the group’s 14 upgrades.

No longer do the problems of the oil & gas industry skew the number of downgrades higher. In Q1-2017, the oil & gas industry figured in 12 upgrades and 12 downgrades — 11 apiece for high-yield and one each for investment grade. Ample liquidity and firmer energy prices account for why the frequency of oil & gas-related high-yield rating revisions improved from the per quarter averages of four upgrades and 57 downgrades from the year-ended June 2016.

Recent high-yield spread implies the market expects more upgrades than downgrades

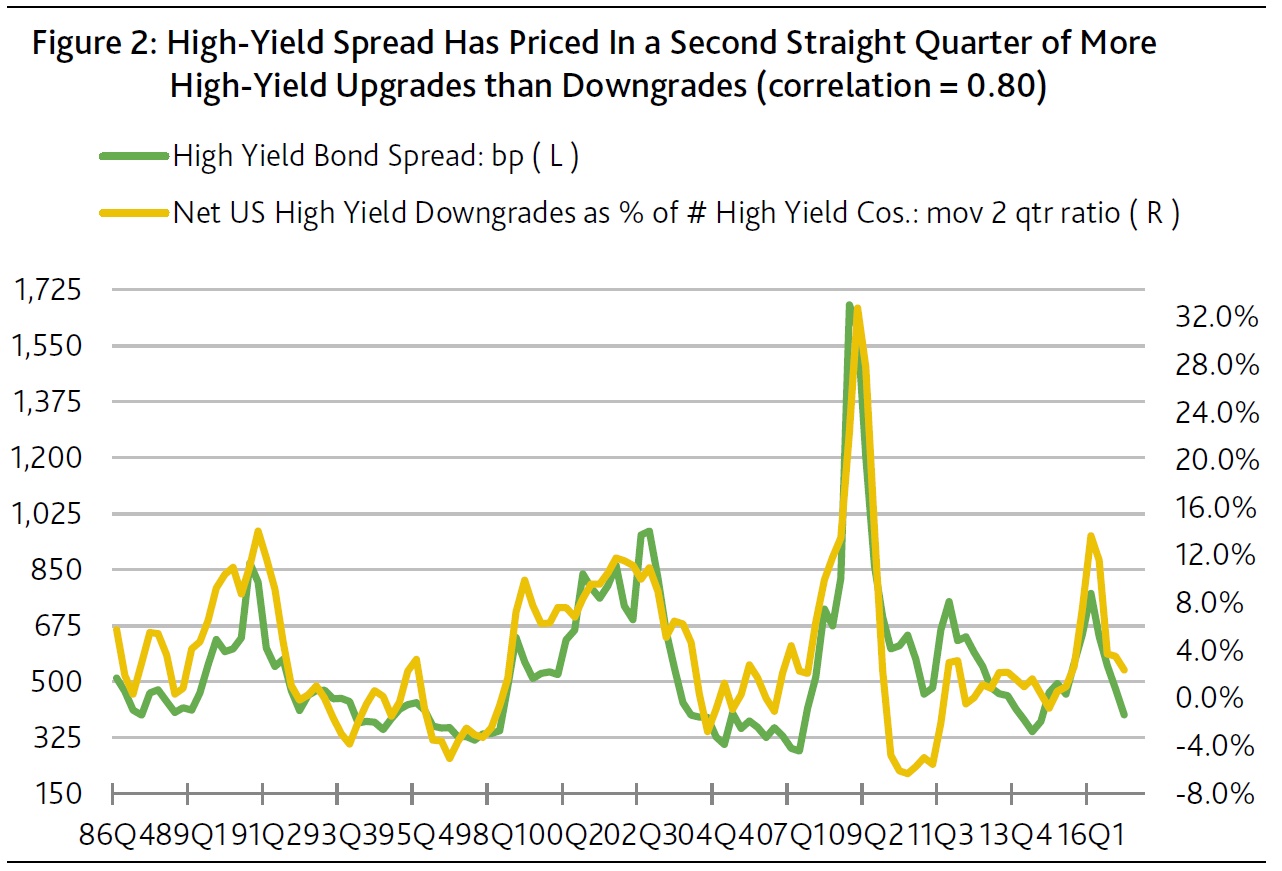
As derived from a sample that commences with 1986’s final quarter, the quarter-long average of the US high-yield bond spread generates a relatively strong correlation of 0.80 with the moving two-quarter ratio of net high-yield downgrades as a percent of the number of high-yield issuers. Net high-yield downgrades, or the difference between the number of downgrades less upgrades, fell from Q4-2016’s +53 to Q1-2017’s -6. In turn, the moving two-quarter ratio of net high-yield downgrades dipped from Q4-2016’s 3.6% to Q1-2017’s 2.4% of the number of high-yield issuers.

The narrowing of the high-yield bond spread from the 551 bp of Q4-2016 to Q1-2017’s 477 bp was qualitatively consistent with the accompanying drop by the relative incidence of net downgrades. First-quarter 2017’s moving two-quarter net downgrade ratio was the lowest since the 1.0% of 2015’s second quarter, or when the high-yield spread averaged 462 bp. When the net downgrade ratio last peaked at Q1-2016’s 13.7%, the high-yield spread averaged a very wide 776 bp. (Figure 2.)

If high-yield downgrades equal upgrades over a two-quarter span, the long-term statistical relationship predicts a midpoint of 436 bp for the high-yield bond spread. Thus, the recent high-yield spread of 412 bp implicitly expects that upgrades will outnumber downgrades for a second straight quarter in Q2-2017.

Steepening yield curve a risk for long-dated bonds

From Investor Daily.

Australian fixed income investors should focus on shorter-dated bonds as the US Treasury yield curve begins to steepen, says FIIG Securities.

The minutes from the most recent meeting of the US Federal Open Markets Committee suggests the Federal Reserve is likely to commence unwinding its quantitative easing programs, which will result in “a reduction in the quantity of bonds and mortgage backed securities held on the Federal Reserve’s balance sheet”, FIIG Securities said.

The firm cautioned that even if this process is well signaled by the Federal Reserve, it will likely lead to a steepening of the yield curve and a subsequent sell-off of long duration bonds.

“The Fed is a significant investor in US Treasury markets and if they do start to reduce holdings – most likely through non re-investment of coupon and principal redemptions – it is likely to lead to a steeper yield curve as demand for US Treasury bonds will necessarily fall,” FIIG Securities said.

“This is a de facto tightening of monetary policy and, in 2018 alone, would amount to an extra US$425 billion.”

Much like the ‘Taper Tantrum’ which followed former Federal Reserve chair Ben Bernanke’s signaling of an end to quantitave easing in 2013, the rise in US Treasury yields would likely carry through to Australian dollar denominated assets.

“Indeed, over the last month the AUD yield curve has rallied strongly (yields lower, prices higher), which could exacerbate the problem,” FIIG Securities said.

The firm said that while not all longer duration bonds will be negatively affected, investors must think about how they’re positioned to handle the steepening yield curve.

“Long-dated bonds with high credit margins have historically performed better in an environment where benchmark yields rise, due to those margins contracting,” FIIG Securities said.

“Holders of some longer-dated bonds … can take some comfort from this, but should nevertheless consider their interest rate exposure.”

US Unemployment Rate was 4.5 percent in March

According to the US Bureau of Labor Statistics, the unemployment rate was 4.5 percent in March 2017. The last time the unemployment rate was 4.5 percent was during the first half of 2007.

The March unemployment rate of 4.5 percent resulted from there being 7.2 million unemployed people among the 160.2 million people in the labor force. People were counted as unemployed if they did not work for pay during the week that included March 12, had actively sought employment during the preceding 4 weeks or were waiting to be recalled from a temporary layoff, and could have started a job if they had received an offer of employment. The labor force is the sum of employed and unemployed people.

BLS publishes six “alternative measures of labor underutilization,” known as U-1 through U-6, in each month’s Employment Situation news release. The unemployment rate, also called U-3, is the total number of unemployed people as a percentage of the labor force. U-1 and U-2 are more narrowly defined and always lower than the U-3 rate. U-4, U-5, and U-6 are more broadly defined and always higher.

In March 2017, the narrower measures, U-1 and U-2, were 1.7 percent and 2.2 percent, respectively. U-1 includes only people who were unemployed for 15 weeks or longer. U-2 includes only unemployed people who lost their jobs or completed temporary jobs.

The most broadly defined rate, U-6, includes unemployed people, plus people who are “marginally attached” to the labor force, plus people who work part time for economic reasons. The marginally attached are neither working nor looking for work but want and are available for a job and have looked for work sometime in the past 12 months. People who work part time for economic reasons are those that would have preferred full-time employment, but were working part time because their hours had been cut or because they were unable to find a full-time job. The U-6 rate was 8.9 percent in March 2017. Before that, it was most recently below 9.0 percent in December 2007.

These data are from the Current Population Survey and are seasonally adjusted. To learn more, see “The Employment Situation — March 2017” (HTML) (PDF). Also see charts from the Employment Situation data.


Generation Rent

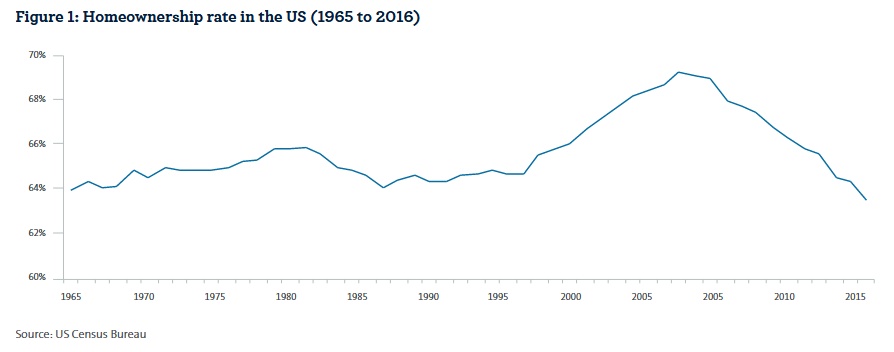
A report by AMP says a major demographic shift in the US has contributed to a steady decline in home ownership since the Global Financial Crisis (GFC), with Generation Y dubbed Generation Rent as millennials delay purchasing a home in the suburbs in favour  of renting in the urban core.

A new AMP Capital whitepaper, Generation Rent, explores this trend, the  implications for real estate investors and the opportunities within the US apartment REIT sector.

AMP Capital Client Portfolio Manager for Global Listed Real Estate and report author Chris  Deves said: “The greater propensity for millennials to rent isn’t necessarily a surprise.  After all, this is the same generation that pioneered the ‘sharing economy’, a collaborative approach to consumption, which draws heavily  on the notion of renting.

“Millennials are opting for proximity to nightlife, restaurants and the workplace along with  access to shared spaces and amenities, which is translating into greater demand for rented apartments in the urban core.  As a demographic cohort, the  strong willingness of millennials to relocate in the pursuit of new career  opportunities necessitates flexibility and mobility, which is also more  conducive to renting over owning.”

The paper shows this is an important tailwind for US apartment REITs, which  make up roughly 8 per cent of the global listed real estate benchmark or more  than US$100 billion of equity market capitalisation.

“On a  through-cycle basis, this shift is a positive for residential landlords and, in  turn, a positive for investors in the listed institutional apartment operators,  which have asset portfolios with meaningful exposure to key urban centres.

“Apartment  REITs are generally high quality and consolidation in the sector has left a set  of large, well-capitalised companies with seasoned management teams, making  them attractive for real estate investors with a long-term investment horizon,”  Mr Deves said.

Mr Deves notes that millennials won’t, however, rent forever.  He said: “The  American dream of home ownership is not dead and buried.  Gen Y are just  as likely to head for the suburbs as previous generations, and starting a  family is often an important catalyst.  The key difference is that we are  seeing this occur increasingly later in life.

“Cyclical affordability issues and demographic change has and will support demand for  apartment rentals in city centres.  During the property cycle, the US  apartment REITs should therefore be in a stronger position to push rents, and quality management teams with insight into the needs of millennials will be  best placed to deliver value for investors of all sizes.”

While the story is similar for Australian millennials, investing in the US is the best way to play this trend for local investors as it offers the largest, highest quality, and most liquid set of listed apartment landlords.

Mr Deves said: “Australian investors should consider a global strategy for listed real  estate in order to access these kinds of thematics, which may not be as readily  investible in their local market.  A global approach also offers geographic diversification for the real estate portfolio.”


US Payroll employment edged up by 98,000 in March 2017

From February 2017 to March 2017, total nonfarm payroll employment edged up by 98,000, following gains of 219,000 in February and 216,000 in January according to the Bureau of Labor Statistics, The Economics Daily.

Over the past 3 months, job gains have averaged 178,000 per month; over the past year, they have averaged 182,000 per month.

Employment increased by 56,000 over the month in professional and business services, about in line with the average monthly gain over the prior 12 months.

Mining employment increased by 11,000 in March, with most of the gains occurring in support activities for mining. Mining employment has increased by 35,000 since reaching a recent employment low in October 2016.

Employment continued to trend up in health care, with 14,000 jobs added in March 2017. Within health care, hospitals added 9,000 jobs and outpatient care facilities added 6,000 jobs. In the first 3 months of 2017, health care employment has increased by an average of 20,000 per month, compared with an average monthly increase of 32,000 in 2016.

Employment in financial activities continued to trend up in March 2017 (+9,000). Over the past 12 months, the industry has added 178,000 jobs.

Employment in retail trade declined by 30,000 in March. Within retail trade, employment in general merchandise stores declined by 35,000 over the month and 89,000 since reaching a recent employment high in October 2016.

Employment in other major industries, including manufacturing, wholesale trade, transportation and warehousing, information, leisure and hospitality, and government, showed little or no change in March.

These data are from the Current Employment Statistics program. Data for the most recent 2 months are preliminary.

US Consumer Credit Rises

In February, consumer credit increased at a seasonally adjusted annual rate of 4-3/4 percent. Revolving credit increased at an annual rate of 3-1/2 percent, while nonrevolving credit increased at an annual rate of 5-1/4 percent, according to the Federal Reserve.

Consumer Credit Growth (Seasonally Adjusted). Recessions are shaded.

This covers most credit extended to individuals, excluding loans secured by real estate, including student loans, car loans, and credit cards.

Capital Flows to the Banking Sector

Deputy RBA Governor Guy Debelle, spoke at the Australian Financial Review Banking & Wealth Summit on “Recent Trends in Australian Capital Flows“. He highlights that Australian banks are still reliant on US funding sources, and this includes exposure to US commercial paper.

We therefore highlight that events there will impact banks here, especially changes in market rates (which are likely to be impacted by FED policy as we discussed earlier).

For more than a century, Australia’s high level of investment relative to saving has been supported by capital inflows from the rest of the world. These net capital inflows are the financial counterpart to Australia’s current account deficit. Foreign investment has been instrumental in expanding our domestic productive capacity and has been attracted by the favourable risk-adjusted returns on offer here.

Although net capital inflows have been a consistent feature of Australia’s balance of payments, the composition of both the inflows, as well as the outflows when Australians invest offshore, has varied substantially over time.

When I spoke about capital flows a few years ago, I discussed the significant changes in the composition of capital flows that had taken place since 2007. At that time, I highlighted three noteworthy developments: a marked increase in foreign direct investment in the mining sector associated with the mining investment boom; the significant change in flows to the Australian banking sector from sizeable inflows pre-crisis to around zero; and a substantial increase in foreigners’ purchases of Australian government debt.

Graph 1: Net Capital Inflows


To a large degree, these trends have continued over the past three years. But under the surface, there have been some significant changes in the composition of these flows in recent years.

The aggregate pattern of capital flows to the banking sector has not changed materially since I last spoke on this topic. Since 2014 – and indeed over the period since the financial crisis – there have been minimal net capital flows to or from the banking sector. Following the shift away from offshore wholesale debt towards domestic deposits that took place in the wake of the global financial crisis, the funding composition of banks has remained relatively stable. But notwithstanding this stability, recently there have been two noteworthy developments relating to short-term debt, both stemming from regulatory reforms.

Firstly, over the past year or so, Australian banks have reduced their short-term debt issuance in preparation for the introduction of the Net Stable Funding Ratio (NSFR) next year. The NSFR provides an incentive for banks to shift to sources of funding considered to be more stable and away from sources such as short-term wholesale liabilities.

Graph 3: Net Foreign Purchases of Australian Bank Debt


Secondly, the composition of Australian banks’ short-term offshore funding has also changed following the implementation of US Money Market Fund (MMF) reforms by the Securities and Exchange Commission in October 2016. As a result of these reforms, the value of assets under management of prime MMFs (those that lend to banks) has fallen by US$1 trillion or around 70 per cent over the past couple of years. Some prime funds have switched to become government-only funds, that is, funds that invest only in US government debt. At the same time, investors have allocated away from prime funds to government-only funds. Although prime MMFs have maintained their exposure to Australian banks relative to banks globally (at around 8 per cent of total MMF exposures to banks), their holdings of Australian bank debt have declined from around US$100 billion to under US$30 billion currently.

However, in aggregate, Australian banks have continued to raise almost as much short-term funding from US commercial paper markets, despite the decline in MMFs. They have been able to tap other investors, in particular US corporates with large cash holdings, such as those in the technology sector.

Fed Minutes From March Meeting – Financial Market Impact

The minutes of the US Federal Open Market Committee March 14–15, 2017 have been released. They provide context for the rate decision. All but
one member agreed to raise the target range for the federal funds rate to ¾ to 1 percent. We also got some impressions on how the FED will manage the billions of dollars in assets it purchased in an attempt to reflate the economy after the financial crisis. This is a big deal, with global consequences for financial markets.  Not least, think about how expected future rate rises may interact with reducing asset purchases.  Bond prices may be impacted. The US T10 was down a little.

In the U.S. economic projection prepared by the staff for the March FOMC meeting, the near-term forecast for real GDP growth was a little weaker, on net, than in the previous projection. Real GDP was expected to expand at a slower rate in the first quarter than in the fourth quarter, reflecting some data for January that were judged to be transitorily weak, but growth was projected to move back up in the second quarter.

Recent information on housing activity suggested that residential investment increased at a solid pace early in the year. Starts for both new single-family homes and multifamily units strengthened in the fourth quarter and remained near those levels in January. Issuance of building permits for new single-family homes—which tends to be a reliable indicator of the underlying trend in construction—also moved up in the fourth quarter and remained near that level in January. Sales of existing homes rose in January, while new home sales maintained their fourth-quarter pace.

The open market reinvestment operations, are currently supporting the financial markets in the US, and are having global impact on interest rate and bond benchmarks. When the time comes to implement a change to reinvestment policy, participants generally preferred to phase out or cease reinvestments of both Treasury securities and agency MBS.

The staff provided several briefings that summarized issues related to potential changes to the Committee’s policy of reinvesting principal payments from securities held in the System Open Market Account (SOMA). These briefings discussed the macroeconomic implications of alternative strategies the Committee could employ with respect to reinvestments, including making the timing of an end to reinvestments either date dependent or dependent on economic conditions.

The briefings also considered the advantages and disadvantages of phasing out reinvestments or ending them all at once as well as whether using the same approach would be appropriate for both Treasury securities and agency mortgage-backed securities (MBS). In their discussion, policymakers reaffirmed the approach to balance sheet normalization articulated in the Committee’s Policy Normalization Principles and Plans announced in September 2014. In particular, participants agreed that reductions in the Federal Reserve’s securities holdings should be gradual and predictable, and accomplished primarily by phasing out reinvestments of principal received from those holdings. Most participants expressed the view that changes in the target range for the federal funds rate should be the primary means for adjusting the stance of monetary policy when the federal funds rate was above its effective lower bound. A number of participants indicated that the Committee should resume asset purchases only if substantially adverse economic circumstances warranted greater monetary policy accommodation than could be provided by lowering the federal funds rate to the effective lower bound. Moreover, it was noted that the Committee’s policy of maintaining reinvestments until normalization of the level of the federal funds rate was well under way had supported the smooth and effective conduct of monetary policy and had helped maintain accommodative financial conditions.

US GDP Revised To 2.1 percent

U.S. Real gross domestic product (GDP) increased at an annual rate of 2.1 percent in the fourth quarter of 2016, according to the “third” estimate released by the Bureau of Economic Analysis. In the third quarter of 2016, real GDP increased 3.5 percent.

The GDP estimate released today is based on more complete source data than were available for the “second” estimate issued last month. In the second estimate, the increase in real GDP was 1.9 percent. With this third estimate for the fourth quarter, the general picture of economic growth remains largely the same; personal consumption expenditures (PCE) increased more than previously estimated.

Real GDP: Percent Change from Preceding Quarter

Real gross domestic income (GDI) increased 1.0 percent in the fourth quarter, compared with an increase of 5.0 percent in the third. The average of real GDP and real GDI, a supplemental measure of U.S. economic activity that equally weights GDP and GDI, increased 1.5 percent in the fourth quarter, compared with an increase of 4.3 percent in the third quarter.

The increase in real GDP in the fourth quarter reflected positive contributions from PCE, private inventory investment, residential fixed investment, nonresidential fixed investment, and state and local
government spending that were partly offset by negative contributions from exports and federal government spending. Imports, which are a subtraction in the calculation of GDP, increased.

The deceleration in real GDP in the fourth quarter reflected downturns in exports and in federal government spending, an acceleration in imports, and a deceleration in nonresidential fixed investment that were partly offset by accelerations in private inventory investment and in PCE, and upturns in residential fixed investment and in state and local government spending.

Current-dollar GDP increased 4.2 percent, or $194.1 billion, in the fourth quarter to a level of $18,869.4 billion. In the third quarter, current-dollar GDP increased 5.0 percent, or $225.2 billion.

The price index for gross domestic purchases increased 2.0 percent in the fourth quarter, compared with an increase of 1.5 percent in the third quarter. The PCE price index increased 2.0 percent, compared with an increase of 1.5 percent. Excluding food and energy prices, the PCE price index increased 1.3 percent, compared with an increase of 1.7 percent.

The USA’s New Debt Bubble

From Mises Wire.

The New York Fed’s most recent household debt report showed ballooning debt and delinquency in student and auto loans. Total household debt has just about reached its previous late-2008 high of over $12.5 trillion.

newman1_1.png

You’ll notice that housing debt (blue) has not increased much since its 2013 low, meaning that the increases in total debt have mostly come from non-housing debt (red). A closer look at the composition of non-housing debt reveals that the biggest increases in debt have come from student and auto loans (red and green, below).

newman2_0.png

In fact, the numbers make it look like the housing bubble was almost exactly replaced by new bubbles in education and cars. From 2008 to 2016, housing debt has decreased by $1.01 trillion, while student and auto loan debt together have increased by $1.04 trillion. The Board of Governors of the Federal Reserve has an even higher estimate than the NY Fed for current student loan debt, at $1.41 trillion.

newman3.png

Shahein Nasiripour at Bloomberg showed the relative changes based on the same data this way:

newman5.png

While both student and auto loan debt have increased substantially, delinquency rates are higher for student loans. In 2012, student loan delinquency spiked up enough to claim the top spot, probably due to the number of people who chose more school over searching for employment during the bust. The graph below shows that student and auto loan delinquency rates are the only ones not decreasing.

newman6.png

Of course, this is more of an intended feature than a flaw of the Fed’s monetary policy since the housing bubble popped. Expansionary monetary policy can only replace bubbles with new bubbles. Malinvestments are not totally liquidated, but shift from one sector to another. Consumer debt is not directly paid off, but transferred from one type to another.

The redirection is mostly guided by new government interference in markets. Pre-2008, federal government programs to encourage new housing and mortgages, along with the low interest rates and new money from the Fed, created the housing bubble. Since 2008, programs like Cash for Clunkers, auto manufacturer bailouts, and income-based student loan repayment have funneled spending, borrowing, and increasing prices into education and autos.

Some recent headlines already signal a collapse in used car prices this year. Meanwhile, college tuition increases are still the norm every year, despite the decreasing value of a diploma. According to this AP report, “the average amount owed per borrower rose to $30,650 in 2016, after rising steadily for years. In 2013, borrowers on average owed $26,300.”

Another recent release by the NY Fed contains data on labor outcomes for college graduates versus all other laborers. There have been dramatic swings in employment across the board since 2008, but comparing September 2008 to September 2016 on net, the unemployment rate for college graduates has increased while the unemployment rate for all other workers has decreased. The underemployment rate (“defined as the share of graduates working in jobs that typically do not require a college degree”) for recent graduates has hovered around 45% since 2008. An indexed measure of job postings indicates that demand for laborers with a college degree has not increased as much as demand for laborers that don’t need a college degree, though both reached a peak late 2015.

newman7.png

The overwhelming conclusion from all of this data is that we almost certainly have new bubbles in education and the auto industry. A trillion dollars of housing debt has been replaced by a trillion dollars (or more) of student and auto loan debt. Delinquency rates are increasing for student and auto loans, while other loan types have seen a decrease in delinquency. Finally, the value of both the university education and the automobiles people are buying don’t seem to justify the amount being borrowed and spent, from a big picture perspective. Their prices are artificially inflated due to the Fed and the federal government teaming up to create new bubbles, just like they did to create the housing bubble.