US Regulators Say Wells Fargo Has More To Do

The Federal Deposit Insurance Corporation (FDIC) and the Federal Reserve Board on Tuesday announced that Bank of America, Bank of New York Mellon, JP Morgan Chase, and State Street adequately remediated deficiencies in their 2015 resolution plans. The agencies also announced that Wells Fargo did not adequately remedy all of its deficiencies and will be subject to restrictions on certain activities until the deficiencies are remedied.

Resolution plans, required by the Dodd-Frank Act and commonly known as living wills, must describe the company’s strategy for rapid and orderly resolution under bankruptcy in the event of material financial distress or failure of the company.

In April 2016, the agencies jointly determined that each of the 2015 resolution plans of the five institutions was not credible or would not facilitate an orderly resolution under the U.S. Bankruptcy Code, the statutory standard established in the Dodd-Frank Act. The agencies issued joint notices of deficiencies to the five firms detailing the deficiencies in their plans and the actions the firms must take to address them. Each firm was required to remedy its deficiencies by October 1, 2016, or risk being subject to more stringent prudential requirements or to restrictions on activities, growth, or operations. The review and the findings announced today relate only to the joint deficiencies identified in April 2016.

The agencies jointly determined that Wells Fargo did not adequately remedy two of the firm’s three deficiencies, specifically in the categories of “legal entity rationalization” and “shared services.” The agencies also jointly determined that the firm did adequately remedy its deficiency in the “governance” category. In light of the nature of the deficiencies and the resolvability risks posed by Wells Fargo’s failure to remedy them, the agencies have jointly determined to impose restrictions on the growth of international and non-bank activities of Wells Fargo and its subsidiaries. In particular, Wells Fargo is prohibited from establishing international bank entities or acquiring any non-bank subsidiary.

The firm is expected to file a revised submission addressing the remaining deficiencies by March 31, 2017. If after reviewing the March submission the agencies jointly determine that the deficiencies have not been adequately remedied, the agencies will limit the size of the firm’s non-bank and broker-dealer assets to levels in place on September 30, 2016. If Wells Fargo has not adequately remedied the deficiencies within two years, the statute provides that the agencies, in consultation with the Financial Stability Oversight Council, may jointly require the firm to divest certain assets or operations to facilitate an orderly resolution of the firm in bankruptcy.

The Federal Reserve Board is releasing the feedback letters issued to each of the five firms. The letters describe the steps the firms have taken to address the deficiencies outlined in the April 2016 letters. The feedback letter issued to Wells Fargo discusses the steps the firm has taken to address its deficiencies and those needed to adequately remedy the two remaining deficiencies.

The determinations made by the agencies today pertain solely to the 2015 plans and not to the 2017 or any other future resolution plans. In addition to requiring that the firms address their deficiencies, in April the agencies also identified institution-specific shortcomings, which are weaknesses identified by both agencies, but are not considered deficiencies.

The agencies in April also provided guidance to be incorporated into the next full plan submission due by July 1, 2017, to the five firms, as well as Goldman Sachs, Morgan Stanley, and Citigroup, and will review those plans under the statutory standard. If the agencies jointly decide that the shortcomings or the guidance are not satisfactorily addressed in a firm’s 2017 plan, the agencies may determine jointly that the plan is not credible or would not facilitate an orderly resolution under the U.S. Bankruptcy Code.

The decisions announced today received unanimous support from the FDIC and Federal Reserve boards.

Feedback letters:
Bank of America (PDF)
Bank of New York Mellon (PDF)
JP Morgan Chase (PDF)
State Street (PDF)
Wells Fargo (PDF)

Big banks in US could see fat payday under Trump

After eight years of unrelenting scrutiny and billions of dollars in legal settlements, the banking industry suddenly is facing a more hospitable political climate in Washington next year, says AFP.

Prior to November 8, Wall Street had been girding for a potential Democratic victory that would have empowered progressive firebrands like Massachusetts Democrat Elizabeth Warren, who has pushed to break up large banks and jail banking executives in the wake of the finanical crisis.

Instead, the Republican sweep of Congress and President-elect Donald Trump’s election in one fell swoop bolstered the chances for pro-growth measures, tax cuts and loosening of a whole swath of regulations, including the 2010 Dodd-Frank banking law passed in response to the crisis.

“You’re going to have a very substantial reversal in regulations of all types,” Blackstone Group chief executive Stephen Schwarzman told the Goldman Sachs banking conference Tuesday.

Schwarzman, a major Republican donor tapped by Trump to chair a advisory council of prominent business leaders, gushed that the election would usher in the biggest regulatory revolution in his 45 years in finance.

Trump’s cabinet appointments have furthered the sense that his presidency will be good for big finance.

And he tapped Goldman Sachs President Gary Cohn to lead the National Economic Council, according to reports Friday, his third major personnel pick from the prestigious New York investment bank following selections of Steven Mnuchin as Treasury secretary and Steve Bannon as chief strategist.

Critics have accused the president-elect of hypocrisy after he railed against Wall Street on the campaign and then brought many financial market insiders onto his team.

“We’re intensely worried,” said Bart Naylor, financial policy advisor at Public Citizen, a consumers advocacy organization.

“What we do have on our side is a public that knows the banks screwed them to get into the financial crisis.”

Wall Street itself is literally cashing in on the fat expectations.

The S&P banks index has surged more than 25 percent since November 8, lifting the entire sector, including Goldman Sachs, the midsized Capital One and regional banks like KeyCorp in Cleveland.

Yet Erik Oja, a banking analyst at CFRA, rejected the suggestion that big banks will win major rollbacks under the Trump administration. Smaller banks may win concessions, but big banks are still under fire.

“I don’t think there’s any political will at all to do any rollback for the largest banks,” Oja said, who added that there was still a remote chance large banks could face calls to break them up.

Oja attributed the rise in bank share prices primarily to rosier outlooks about the economy due to the anticipated pro-growth policies and the expectation the Federal Reserve will accelerate interest rate increases.

– Tear up Dodd-Frank? –

During the presidential campaign, Trump vowed to dismantle the Dodd-Frank law, whose main provisions include tougher capital requirements on banks, the creation of the Consumer Financial Protection Board and Volcker rule, which restricts the ability of big banks to make highly lucrative investments that do not benefit their customers.

Smaller regional banks in particular have complained about the burden of regulations meant to rein in excesses of the large banks that could take down the whole system.

Mnuchin took aim at the 2010 law last week, shortly after he was picked for the Treasury post.

“The number one problem with the Volcker rule is it is too complicated and people don’t know how to interpret it,” Mnuchin said. “So we’re going to look at what to do with it, as we are with all of Dodd Frank with the number one priority that banks lend.”

At the Goldman Sachs conference, large banks offered guarded optimism on regulatory relief they expect from Washington.

“The first thing I would ask for is nothing new, no new rules,” said Citigroup chief financial officer John Gerspach, who said unnecessarily high liquidity requirements crimp lending.

Bank of America Chief Executive Brian Moynihan estimated his bank was holding about $15 billion in “excess” capital due to overlapping regulatory requirements that could be returned to shareholders.

“At the end of the day, we are overcapitalized,” he said.

But Marty Mosby, banking analyst at Vining Sparks, said the changes have broadly succeeded since 2008 in safeguarding the financial system, even if there have been some regulatory excesses.

Overregulating and overcapitalizing big banks is preferable to the alternative “because you can’t have those banks failing,” he said.

US Mortgage Rates Continue To Move Higher

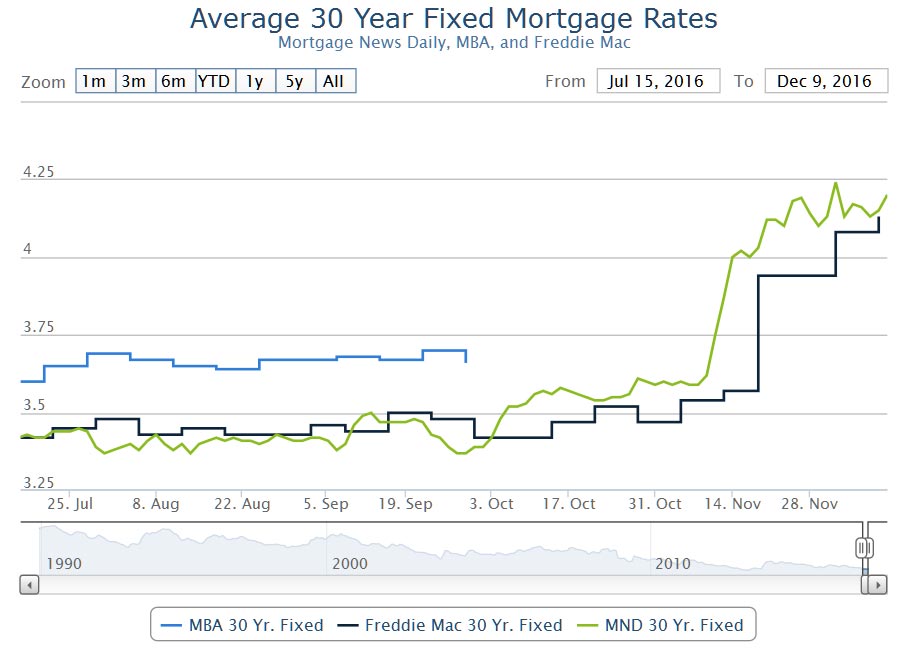
According to MortgageNewsDaily, US mortgage rates rose further, continuing their upward trajectory since the US election. As we discussed yesterday, this will have a flow-on effect here.

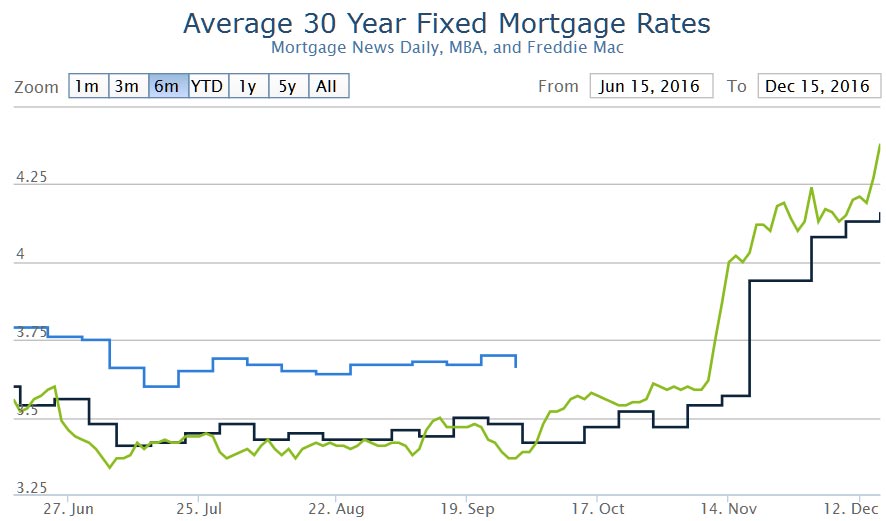
Mortgage rates rose meaningfully today, with most lenders coming close to the highest levels in more than 2 years (on December 1st).  Keep in mind though, that my daily assessment puts rate movement under a microscope, so “rose meaningfully” is a relative term.  In fact, many lenders are quoting the exact same contract rates today compared to yesterday, with the only deterioration being seen in the form of higher upfront costs (or lower lender credit, depending on the scenario).  Even so, there was enough movement to shift the average lender’s top tier conventional 30yr fixed quote up to 4.25% although 4.125% is nearly as prevalent.

Today’s market movement had to do with investor anxiety heading into a few challenging days at the beginning of next week.  In addition to the Fed announcement on Wednesday, Treasury auctions (Where the government sells bonds to investors directly, typically a Tue/Wed/Thu affair) are packed into the first 2 days of the week.  Bond market movement (which drives interest rates) is all about supply and demand.  When supply is more challenging, it puts upward pressure on rates.  Moving the bond market’s key source of “supply” ahead in the calendar and condensing 3 days of supply into 2 definitely makes supply more challenging.

The bottom line is that bond markets are anxious, and that anxiety is being managed by selling bonds.  It could absolutely still be the case that bond traders are interested in keeping rates from moving above recent highs, but we won’t have a great sense of that until the middle of next week.  The blanket advice for any new loans is to lock in this environment.  That said, risk-takers might consider the fact that 10yr Treasury yields (a good proxy for momentum in longer-term rates, like mortgages) have yet to break above 2.50%, despite facing maximum anxiety this afternoon.  2.50% could be used as line in the sand that lets risk-takers know it’s time to lock.

Trump is changing the rules for American business

From The Economist.

His inauguration is still six weeks away but Donald Trump has already sent shock waves through American business. Chief executives—and their companies’ shareholders—are giddy at the president-elect’s promises to slash burdensome regulation, cut taxes and boost the economy with infrastructure spending. Blue-collar workers are cock-a-hoop at his willingness to bully firms into saving their jobs.

In the past few weeks, Mr Trump has lambasted Apple for not producing more bits of its iPhone in America; harangued Ford about plans to move production of its Lincoln sports-utility vehicles; and lashed out at Boeing, not long after the firm’s chief executive had mused publicly about the risks of a protectionist trade policy. Most dramatically, Mr Trump bribed and cajoled Carrier, a maker of air-conditioning units in Indiana, to change its plans and keep 800 jobs in the state rather than move them to Mexico. One poll suggests that six out of ten Americans view Mr Trump more favourably after the Carrier deal. This muscularity is proving popular.

Popular but problematic. The emerging Trump strategy towards business has some promising elements, but others that are deeply worrying. The promise lies in Mr Trump’s enthusiasm for corporate-tax reform, his embrace of infrastructure investment and in some parts of his deregulatory agenda. The dangers stem, first, from the muddled mercantilism that lies behind his attitude to business, and, second, in the tactics—buying off and attacking individual companies—that he uses to achieve his goals. American capitalism has flourished thanks to the predictable application of rules. If, at the margin, that rules-based system is superseded by an ad hoc approach in which businessmen must take heed and pay homage to the whim of King Donald, the long-term damage to America’s economy will be grave.

US Employment Stronger

Latest US data shows the unemployment rate declined by 0.3 percentage point to 4.6 percent in November, and nonfarm payroll employment increased by 178,000. Further support for a FED rate rise.

work-pic

Job growth continued in professional and business services and in health care. Thus far this year, nonfarm job growth has averaged 180,000 per month, compared with an average gain of 229,000 per month in 2015.

Incorporating revisions for September and October, which reduced nonfarm payroll employment by 2,000 on net, monthly job gains have averaged 176,000 over the past 3 months.

Employment in professional and business services increased by 63,000 in November and has expanded by 571,000 over the year. Within the industry, accounting and bookkeeping services added 18,000 jobs over the month. Employment continued to trend up in administrative and support services (+36,000), computer systems design and related services (+5,000), and management and technical consulting services (+4,000).

Health care employment rose by 28,000 in November, with a gain of 22,000 in ambulatory health care services. Health care has added 407,000 jobs over the year.

Employment in construction continued on its recent upward trend in November (+19,000), led by a gain in residential specialty trade contractors (+15,000). Over the past 3 months, construction has added 59,000 jobs, largely in residential construction.

Employment in other major industries–mining, manufacturing, wholesale trade, retail trade, transportation and warehousing, information, financial activities, leisure and hospitality, and government–changed little over the month.

Average hourly earnings of all employees on private nonfarm payrolls decreased by 3 cents in November to $25.89, following an 11-cent increase in October. Over the past 12 months, average hourly earnings have risen by 2.5 percent. From October 2015 to October 2016, the Consumer Price Index for All Urban Consumers (CPI-U) increased by 1.6 percent (on a seasonally adjusted basis).

Turning to measures from the survey of households, the unemployment rate declined by 0.3 percentage point to 4.6 percent in November. The number of unemployed people fell by 387,000 over the month to 7.4 million. The decrease was largely among adult men. From August 2015 through October 2016, both the unemployment rate and the number of unemployed people had shown little movement on net.

In November, the number of people searching for work for 27 weeks or more was little changed at 1.9 million. These long-term unemployed accounted for 24.8 percent of the total unemployed.

The labor force participation rate, at 62.7 percent, was about unchanged in November, and the employment-population ratio held at 59.7 percent. Both measures have shown little movement in recent months.

In November, there were 5.7 million people working part time for economic reasons (also referred to as involuntary part-time workers). This measure was little changed over the month but was down by 416,000 from a year earlier.

Among those neither working nor looking for work in November, 1.9 million were considered marginally attached to the labor force, up from 1.7 million a year earlier. Discouraged workers, a subset of the marginally attached who believed that no jobs were available for them, numbered 591,000 in November, essentially unchanged from a year earlier. (Marginally attached to the labor force refers to people who had not looked for work in the 4 weeks prior to the survey but wanted a job, were available for work, and had looked for a job within the last 12 months.)

In summary, the unemployment rate declined to 4.6 percent in November, and nonfarm payroll employment increased by 178,000.

US Mortgage Rates Surge Higher

Mortgage News Daily Says Mortgage rates spiked abruptly today, bringing them to the highest levels in well over 2 years.  The average lender is now quoting conventional 30yr fixed rates of 4.25% on top tier scenarios with more than a few already up to 4.375%.  You’d have to go back to the summer of 2014 to see a similar mortgage rate landscape.

us-mortggae-02-dec-16


(NOTE: Freddie Mac’s widely-cited primary mortgage market survey, released today, showed a 0.05% increase week-over-week.  That increase is actually fairly close to the true week-over-week increase, but only if you’re using last Wednesday or Friday as your baseline.  Freddie’s baseline was Mon/Tue–shorter than normal due to the holiday week.  Additionally, Freddie’s survey doesn’t capture today’s rate spike, which was roughly 0.10%.  The bottom line is that many borrowers will be seeing rates that are .125-0.25% higher this week versus the beginning of last week.  By my calculations, if rates didn’t change at all in the coming week, Freddie’s next survey would likely be 0.08% higher.)

The situation is all the more troubling considering the fact that rates weren’t too far above all-time lows less than a month ago.  The pace of losses has only been seen 2 other times in the last 30 years (in 1987 and 1996).  For the record, 2013’s taper tantrum resulted in a bigger rate spike than we’re seeing currently, but it took more than twice as long to play out.  There were no 4-week periods of time in 2013 that compare to rise in rates seen over the past 4 weeks.  For those who recall the vicious rate spike at the end of 2010, the current pace is just a bit faster.

The higher rates go–the more the boundaries of past precedent are stretched, the more likely we are to see a rebound.  The catch is that there’s no way to know when that rebound will happen until it’s underway.  That makes floating very dangerous, and locking potentially very frustrating (because it’s clearly the safer bet since the election, but increasingly runs the risk of being ill-timed).

The US Money Machine

Moody’s says the recent ascent by Treasury bond yields threatens to offset the positive implications for corporate bond issuance stemming from widespread expectations of a declining default rate for 2017.

us-bond-yield

Markets now look for a Republican President and a Republican Congress to supply a major fiscal jolt to the economy even if tax cuts and additional infrastructure spending further widen a federal deficit that approximated 3.2% of GDP for the year-ended September 2016. By contrast, the federal deficit was a smaller 2.4% of GDP prior to the Great Recession. Moreover, late 2007’s outstanding federal debt approximated 35% of GDP, which was far lower than its recent 76% share.

The Republican Party’s many fiscal conservatives now sitting in Congress are likely to oppose the adoption of a fiscal stimulus program that adds significantly to federal indebtedness in the context of an economic recovery. They will warn of an even greater debt burden once the inevitable recession triggers a cyclical widening of the federal budget deficit. In addition, unforeseen national emergencies or military conflicts can quickly balloon the national debt.

Thus far, the market has been relatively sanguine regarding credit quality’s ability to shoulder recent and forthcoming increases by borrowing costs. However, the narrowing of corporate bond yield spreads since November 8’s Republican sweep masks a climb by the absolute level of borrowing costs that threatens to curb bond issuance noticeably. Were spreads to widen alongside higher bond yields, a likely sell-off of equities would probably spark a “fight to quality” that drives Treasury bond yields lower.

Already, important segments of the equity market have weakened in response to a possibly excessive climb by benchmark bond yields. For example, the interest-sensitive PHLX index of housing-sector share prices was recently down by -4.1% from November 25’s close.

Thus, in addition to Washington’s fiscal conservatives, the Treasury bond market can limit the scope of debt-financed spending. Once the climb by Treasury bond yields materially suppresses business activity, Washington’s new regime will better appreciate the limits to fiscal stimulus.

After considering the late stage of the economic recovery, the favorable default outlook, above-average interest rate risks, as well as the constraints imposed by an aging population and workforce, the prospects for US$-denominated corporate bond issuance appear modest. Following 2016’s prospective 7% increase to $1.416 trillion, investment-grade bond offerings may dip by -2% in 2017. Moreover, high-yield bond issuance’s likely -5% drop to $337 billion for 2016 may give way to a 3.5% increase in 2017, which would still leave 2017’s tally a deep -19% under 2013’s yearlong cycle high. Though the widely anticipated fiscal jolt may fall short of current expectations, less regulation might deliver an upside surprise.

The Month When Everything Changed

November marked one of the most decisive shifts for global financial markets in recent years, with a bevy of asset classes — from bank stocks, emerging-market bonds to hard commodities — staging sharp price swings in the space of a mere three weeks, says Bloomberg.


Investors reckon the ascent of Donald Trump presages a regime shift for the global economy, marked by trade protectionism, a stronger U.S. inflation outlook, and a higher U.S. fiscal deficit.

The anchors of global asset repricing: a stronger dollar, an increase in U.S. growth expectations, fears of a more protectionist Trump-led administration, and a steeper U.S. yield curve which brought the premium for borrowing at the long-end, relative to short-end obligations, back to positive territory.

Developed-market equities have been in vogue over the past three weeks, with a rotation out of defensive stocks in favor of consumer discretionary shares, industrial commodities, and financials underscoring how a repricing of growth expectations has trumped the prospect of a higher discount rate. Meanwhile, fixed-income has fallen firmly out of favor, stocking fears the 35-year bond bull-run is coming to an abrupt end. That signals a reversal of the perverse investment strategy in the first half of the year to snap up equities for yield, and bonds for capital gain.

November was the worst month ever for the Bloomberg Barclays Aggregate Total Return Index, which staged a 4 percent loss, as yields on U.S. 10-year Treasuries climbed from 1.8 percent to 2.4 percent in swings reminiscent of 2013’s taper tantrum.

“The U.S. election result just over 3 weeks ago sparked a huge divergence across asset classes and also between developed and emerging markets,” Jim Reid, Deutsche Bank AG strategist, wrote in a note to clients on Thursday. “In years to come markets may well look back at the month just passed as one of the most pivotal in recent memory.”

Most asset classes were in a relatively stable trading range in the first 8 months of the year. All that changed in the month after the Trump victory.

trump elect

trump second

With the prospect of regulatory relief from a Trump administration, the S&P 500 Financials Index returned 13.9 percent in November, while copper gained 18.9 percent — its best monthly gain in a decade — driven, in part, by Trump’s campaign pledge to turbocharge infrastructure spending.

By contrast, emerging-market local-currency bonds had their worst month of 2016, with Latin American debt, tracked by IHS Markit, shedding 7 percent. The drop in local currencies erased returns for equity and debt investors in dollar terms. The sharp appreciation of the dollar — and associated liquidity fears for emerging markets next year — has challenged leveraged fixed-income trades that rely on cheap dollar funding, with the cost to borrow dollars in Japan rising.

FX EM

 In sum, November saw credit and rate markets taking a hit, while developed equity markets led the gains. “Analysts have been criticized for suggesting beforehand that a Trump victory would instigate a selloff in assets but the reality is that of the 39 global assets we cover (excluding currencies) only 11 are up in November in dollar terms (12 in local currency) with most being U.S. assets,” Reid wrote.

It wasn’t bad news for all emerging markets, however. Russia’s benchmark Micex index of equities gained 4 percent in dollar terms, underscoring expectations of a thawing of tensions between Washington and Moscow next year.

dolalr returns

Taking stock: credit, particularly U.S. high yield, has had a solid year thus far while November losses have crimped year-to-date gains in developed rate markets. Elsewhere, there are a flurry of interesting local stories that dominate asset returns this year, including the ongoing saga of European banks, the gilt market’s struggle to recover from its October maelstrom, and the roller coaster in Brazil’s Ibovespa index.

ytd
The rationale behind November’s memorable, market-moving month — investors are positioning for a game-changing shift in U.S. fiscal and monetary policies — is largely backed by Wall Street strategists. A bevy of analysts this week, from Goldman Sachs Group Inc, JPMorgan Chase & Co, and Societe Generale SA, have upgraded their index forecasts for the S&P 500 over the next two years, citing the prospect of tax reform, regulatory relief and higher government spending, while downgrading their outlook for emerging markets.

US Household Debt Hits $12.4 Trillion

From Zero Hedge.

The latest just released Quarterly Report on Household Debt and Credit  from the New York Fed showed a small increase in overall debt in the third quarter of 2016, prompted by gains in non-housing debt, and new all time highs in student loans which hit $1.279 trillion, rising $20 billion in the quarter.11.0% of aggregate student loan debt was 90+ days delinquent or in default at the end of 2016 Q3.

Total household debt rose $63 billion in the quarter to $12.35 trillion, driven by a $32 billion increase in auto loans, which also hit a record high of $1.14 trillion. 3.6% of auto loans were 90 or more days delinquent.

Mortgage balances continued to grow at a sluggish pace since the recession while auto loan balances are growing steadily, and hit a new all time high of $1.14 trillion.

What was most troubling, however, is that delinquencies for auto loans increased in the third quarter, and new subprime auto loan delinquencies have not hit the highest level in 6 years.

The rise in auto loans, a topic closely followed here, has been fueled by high levels of originations across the spectrum of creditworthiness, including subprime loans, which are disproportionately originated by auto finance companies.

Disaggregating delinquency rates by credit score reveals signs of distress for loans issued to subprime borrowers—those with a credit score under 620.

To address the troubling surge in auto loan delinquencies, the NY Fed Liberty Street Economics blog posted an analysis of the latest developments in the sector. This is what it found.

LSE_Just Released: Subprime Auto Debt Grows Despite Rising Delinquencies

Subprime Auto Debt Grows Despite Rising Delinquencies

The rise in auto loans has been fueled by high levels of originations across the spectrum of creditworthiness, including subprime loans, which are disproportionately originated by auto finance companies. Disaggregating delinquency rates by credit score reveals signs of distress for loans issued to subprime borrowers—those with a credit score under 620. In this post we take a deeper dive into the observed growth in auto loan originations and delinquencies. This analysis and our Quarterly Report are based on the New York Fed’s Consumer Credit Panel, a data set drawn from Equifax credit reports.

Originations of auto loans have continued at a brisk pace over the past few years, with 2016 shaping up to be the strongest of any year in our data, which begin in 1999. The chart below shows total auto loan originations broken out by credit score. The dollar volume of originations has been high for all groups of borrowers this year, with the quarterly levels of originations only just shy of the highs reached in 2005. The overall composition of both originations and outstanding balances has been stable.

Just Released: Subprime Auto Debt Grows Despite Rising Delinquencies

As we noted in an earlier blog post, one feature of our data set is that it enables us to infer whether auto loans were made by a bank or credit union, or by an auto finance company. The latter are typically made through a car manufacturer or dealer using Equifax’s lender classification. Although it remains true that banks and credit unions comprise about half of the overall outstanding balance of newly originated loans, the vast majority of subprime loans are originated by auto finance companies. The chart below disaggregates the $1.135 trillion of outstanding auto loans by credit score and lender type, and we see that 75 percent of the outstanding subprime loans were originated by finance companies.Auto

Just Released: Subprime Auto Debt Grows Despite Rising Delinquencies

In the chart below, auto loan balances broken out by credit score reveal that balances associated with the most creditworthy borrowers—those with a score above 760 (in gray below)—have steadily increased, even through the Great Recession. Meanwhile, the balances of the subprime borrowers (in light blue below), contracted sharply during the recession and then began growing in 2011, surpassing their pre-recession peak in 2015.

Just Released: Subprime Auto Debt Grows Despite Rising Delinquencies

Delinquency Rates

Auto loan delinquency data, reported in our Quarterly Report, show that the overall ninety-plus day delinquency rate for auto loans increased only slightly in 2016 through the end of September to 3.6 percent. But the relatively stable delinquency rate masks diverging performance trends across the two types of lenders. Specifically, a worsening performance among auto loans issued by auto finance companies is masked by improvements in the delinquency rates of auto loans issued by banks and credit unions. The ninety-plus day delinquency rate for auto finance company loans worsened by a full percentage point over the past four quarters, while delinquency rates for bank and credit union auto loans have improved slightly. An even sharper divergence appears in the new flow into delinquency for loans broken out by the borrower’s credit score at origination, shown in the chart below. The worsening in the delinquency rate of subprime auto loans is pronounced, with a notable increase during the past few years.

Just Released: Subprime Auto Debt Grows Despite Rising Delinquencies

It’s worth noting that the majority of auto loans are still performing well—it’s the subprime loans that heavily influence the delinquency rates. Consequently, auto finance companies that specialize in subprime lending, as well as some banks with higher subprime exposure are likely to have experienced declining performance in their auto loan portfolios.

Conclusion

The data suggest some notable deterioration in the performance of subprime auto loans. This translates into a large number of households, with roughly six million individuals at least ninety days late on their auto loan payments. Even though the balances of subprime loans are somewhat smaller on average, the increased level of distress associated with subprime loan delinquencies is of significant concern, and likely to have ongoing consequences for affected households.

Is Financial Risk Socially Determined?

From The St. Louis On The Economy Blog.

The authors of the In the Balance—Senior Economic Adviser William Emmons, Senior Analyst Lowell Ricketts and Intern Tasso Pettigrew, all with the St. Louis Fed’s Center for Household Financial Stability—found that eliminating so-called “bad choices” and “bad luck” reduced the likelihood of serious delinquency. With the exception of Hispanic families, this did not get rid of disparities in delinquency risk relative to the lower-risk reference group.

However, this exercise was based on the idea that the young (or less-educated or nonwhite) families’ financial and personal choices, behavior and exposure to luck could conform to those of the old (or better-educated or white) families. The authors suggested that such an approach may not be realistic.

A Lack of Choice?

“We believe a more realistic starting point for assessing the mediating role of financial and personal choices, behavior and luck in determining delinquency risk is a family’s peer group,” the authors wrote. They looked at how an individual family’s circumstances differ from its peer group, hoping to capture the “gravitational” effects of the peer group.

The odds are similar to those that were not adjusted, as seen in the figures below. (For 95 percent confidence intervals, see “Choosing to Fail or Lack of Choice? The Demographics of Loan Delinquency.”)

Probability Serious Delinquency1

ProbSeriousDelin2

In particular, they examined how a randomly chosen family fared against the average of its peer group, such as how much debt a young black or Hispanic family with at most a high school diploma has compared to the family’s peer-group norm.

“We assume that the distinctive financial or personal traits associated with a peer group ultimately derive from the structural, systemic or historical circumstances and experiences unique to that demographic group,” the authors wrote.

When assuming that individual families’ choices extend only to deviations from peer-group averages, the authors estimated that:

  • A family headed by someone under 40 years old is 5.8 times as likely to become seriously delinquent as a family headed by someone 62 years old or more.
  • Middle-aged families (those with a family head aged 40 to 61 years old) are 4.2 times as likely to become seriously delinquent as old families.
  • A family headed by someone with at most a high school diploma is 1.8 times as likely to become seriously delinquent as a family headed by someone with postgraduate education.
  • A family headed by someone with at most a four-year college degree is 1.4 times as likely to become seriously delinquent as a family headed by someone with postgraduate education.
  • A black family is 2.0 times as likely to become seriously delinquent as a white family.
  • A Hispanic family is 1.2 times as likely to become seriously delinquent as a white family.

These demographic groups still appear to have a higher delinquency risk than older, better-educated and white families. This suggests that younger, less-educated and nonwhite families may have little choice in the matter.

“The striking differences in delinquency risk across demographic groups cannot be explained simply by referring to differences in risk preferences,” Emmons, Ricketts and Pettigrew wrote. “Instead, we suggest that deeper sources of vulnerability and exposure to financial distress are at work.”

The authors also concluded: “Families with ‘delinquency-prone’ demographic characteristics—being young, less-educated and nonwhite—did not choose and cannot readily change these characteristics, so we should refrain from adding insult to injury by suggesting that they simply have brought financial problems on themselves by making risky choices.”

Each family was assigned to one of 12 peer groups, which were defined by age (young, middle-aged or old), race or ethnicity (white or black/Hispanic) and education (at most a high school diploma or any college up to a graduate/professional degree).