Political Uncertainty, Low Rates Will Weigh on 4Q U.S. Bank Earnings

Fitch Ratings says U.S. banks experienced modest earnings expansion in the third quarter of 2016 (3Q16) relative to 2Q16; however, earnings will not materially expand in the near term given political uncertainties, prolonged low interest rates, modest economic growth and softness in key economies globally, according to their 3Q16 U.S Banking Quarterly Comment which reviews the largest 17 U.S. banks.

calc-pic

“Political uncertainty has resulted in softer demand for commercial credit from businesses, particularly in the middle-market, which resulted in sluggish loan growth for most U.S. banks and could extend into 4Q16,” said Bain Rumohr, Director, Fitch Ratings.

After a strong start to the year, loan growth was muted, particularly for commercial loans. Fitch also believes a regulatory commercial real estate (CRE) regulatory guidance from December 2015 has impacted CRE loan growth. However, banks are increasing their consumer lending efforts with many growing credit card balances and mortgage portfolios while pulling back from indirect auto lending which has shown recent signs of weakness. Large mortgage originators all reported growth in originations and applications in 3Q16. Despite sluggish loan growth, deposit growth continues to be strong as consumers and businesses remain relatively less levered.

Overall most banks with large loan portfolios reported sequential improvement in loan losses, but Fitch expects losses to deteriorate from currently unsustainably low levels. Median credit losses for the group have been 50-60 bps lower than the FDIC long-term average over the last five quarters.

Citing a slowdown in growth and broad credit improvement some banks released loan loss reserves this quarter; however, JP Morgan Chase and Citi both built reserves tied to credit quality expectations and growth in consumer portfolios going forward.

Following a good 2Q16, capital markets results for the large global trading and universal banks were once again strong in 3Q16, relatively flat to 2Q but increasing 20% from the year-ago quarter. Higher revenues from FICC trading, drove the growth while equities trading remained relatively muted.

“As we expected, most banks reported flat or compressed net interest margins for the quarter and Fitch reiterates that a sustained and consistently steep yield curve will be critical to improving NIMs for a meaningful period and the shape of the curve to be more important than the level of short-term interest rates,” added Rumohr.

Given this persistently low rate environment banks of all sizes have been especially focused on controlling and/or cutting expenses. During the 3Q16 earnings season, many large U.S. banks pointed to new or expanded cost cutting measures to be carried out going forward In general, Fitch believes that many of the easier cost cuts have already been executed on and that incremental savings will be more difficult to produce going forward.

Overblown Inflation Fear Roils Markets – Moody’s

Thus far, according to Moody’s, US financial assets have fared poorly during the fourth quarter. Fear of a fundamentally unwarranted climb by Treasury yields has weighed on the performance of earnings-sensitive securities.

USA-Economy-Pic

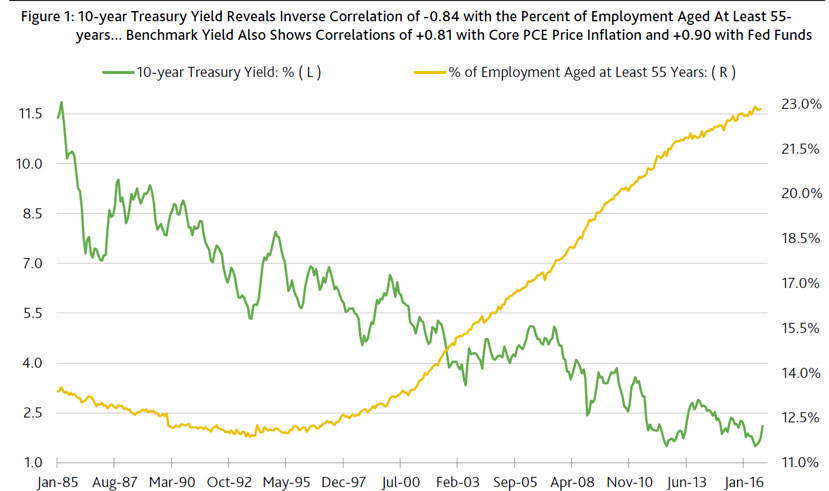
The latest climb by the 10-year Treasury yield from a September 2016 average of 1.63% to a more recent 1.81% has been ascribed to expectations of a series of Fed rate hikes in response to a possibly much faster than 2% annual rate of CPI inflation. Though the current bout of inflation anxiety may be overblown, holders of earnings-sensitive securities worry about long-term borrowing costs reaching burdensome levels. In addition, higher yielding Treasury securities will drive up the returns investors demand from other assets. And, the surest way to boost an asset’s future prospective return is to lower its current price.

Since the end of September, the market value of US common stock was recently down by -4.0%. The accompanying -7.3% dive by the Russell 2000 stock price index shows that the prospective loss of liquidity to higher interest rates may weigh more heavily on small- to mid-sized companies.

For businesses incurring flat to lower sales volumes, higher borrowing costs make absolutely no sense. It should be noted that the NFIB’s survey of small businesses found that the net percent of polled firms reporting a three-month increase by sales volumes sank from the -5.5 percentage points, on average, of the year-ended June 2016 to the -7.8 points of Q3-2016. (When the net percent is negative, the number of surveyed firms incurring a decline by sales volumes tops the number reporting an increase.)

Only once during the current recovery has the sales volume statistic’s moving three-month average achieved a positive reading — the +1.1 points of the three-months-ended May 2012. For the current recovery, the sales volume index has averaged a woeful -9.4 points, which was worse than its insipid +1.0 point average of 2002-2007’s upturn.

Housing-sector share prices plunge

The fourth-quarter-to-date’s -8.0% plunge incurred by the PHLX index of housing-sector share prices reflects considerable worry over a possible ascent by benchmark yields that will stifle housing activity. Markets remember all too well how a climb by mortgage yields during the “taper tantrum” of 2013 reduced home sales.

Yes, the 10-year Treasury yield could jump up to 2% or higher, but its stay will be limited if housing buckles under the weight of higher mortgage yields. The fact that housing did not get more of a boost from a -50 bp drop by the 30-year mortgage yield from a Q3-2015 average of 3.95% to the 3.45% of Q3-2016 warns of an annual contraction by home sales if the 10-year Treasury yield remains above 2%.

Housing’s muted response to a less than 3.5% 30-year mortgage yield suggests only a limited upside for the 10-year Treasury yield. After surging by +16.1% year-over-year during the year-ended June 2016, dollar outlays on single family home construction dipped by -0.8% year-over-year during Q3-2016.

In addition, the year-over-year percent increase for unit sales of new and existing homes slowed from the 4.9% of 2016’s first half to the 1.6% of the third quarter. Looking ahead, a slowdown by the annual rise for the index of pending home sales from first-half 2016’s 1.7% to the third quarter’s 1.2% signals a slowing by home sales that risks deteriorating into an outright contraction if mortgage yields jump higher.

Inflation worries overlook deep pockets of deflation

Forecasts of a 10-year Treasury yield noticeably above 2% are derived from expectations of faster price inflation. Nevertheless, exaggerated fears of faster price inflation have surfaced at various times during the current recovery. Remember those earlier off-the-wall predictions of Weimar-like hyperinflation for the US economy? Forecasts of persistently rapid price inflation have proven to be so very wrong largely because US consumers have lacked the cash needed to fund runaway price inflation. In addition, the aging of both the US population and the US workforce add to the difficulty of sustaining accelerations by consumer prices.

Price inflation now lacks breadth. If the Fed decides to fight headline inflation, the plight of those having exposure to tangible consumer goods is likely to worsen. Third-quarter 2016’s PCE price index rose by 1.0% annually, which was well under the Fed’s 2% target for PCE price index inflation. Moreover, the third-quarter’s yearly pace for the Fed’s preferred index of consumer prices contained major pockets of consumer-goods price deflation.

For example, Q3-2016’s price index for durable consumer goods was down by -2.3% from a year earlier, while the price index for consumer nondurable goods fell by -1.3% annually. By contrast, the consumer services’ component of the PCE price index rose by 2.3% annually. Thus, consumer service price inflation explains Q3-2016’s 1.7% annual increase by the core PCE price index, which excludes food and energy prices.
Many fret over an increase by the annual rate of core CPI inflation from September 2015’S 1.9% to September 2016’s 2.2%. However, that quickening was largely the consequence of an increase by core consumer service price inflation from 2.7% to 3.2% that differed radically from an accompanying deepening of core consumer goods price deflation from -0.5% to -0.6%.

The rise by the annual rate of core consumer service price inflation was driven by increases in (i) medical-care service price inflation from September 2015’s 2.4% to September 2016’s 4.8% and (ii) shelter cost price inflation from 3.2% to 3.4%. Excluding shelter costs, the annual rate of core CPI inflation rose from September 2015’s 1.0% to a still very low 1.3% for September 2016.

Shelter cost inflation may peak soon

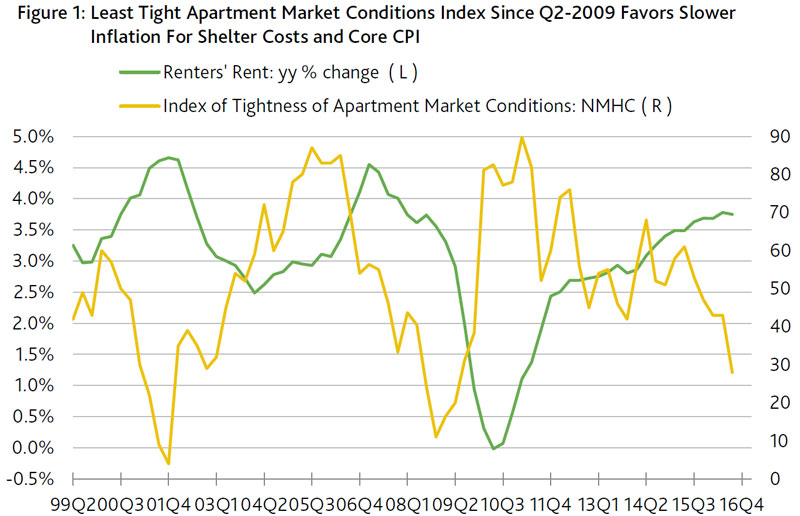
Recent data favor a slowing of shelter cost inflation from September’s 3.4% annual pace. The National Multifamily Housing Council (NMHC) compiles an index describing the tightness of apartment market conditions for the US. The rate of change for apartment rents tends to respond with a lag of 12 to 15 months following a major swing by the index of apartment market tightness.

After most recently peaking at the 89.7 of Q1-2011, the apartment market tightness index has subsequently plunged to the 28.0 of Q3-2016. The latter was the index’s lowest reading since the 20.0 of Q2-2009, or the final quarter of the Great Recession. (Figure 1.)

moodys04novEach previous drop by the apartment market conditions index to a reading of less than 30 was followed by a significantly slower rate of growth for rents and, in turn, the shelter cost component of the core CPI. For example, in response to Q2-2009’s ultra-low apartment conditions index, the average annual rate of rent inflation sank from the 3.1% of 2009’s first half to the 0.2% of April 2010 through December 2010. Thus, rent inflation is likely to slow noticeably from Q3-2016’s 3.7%.

Other forthcoming sources of consumer price disinflation include autos (owing to a glut of used vehicles and sweetened sales incentives) and restaurant meals (stemming from an excess supply of eateries).

In summary, if Treasury yields extend their latest climb absent indications of much improved profitability, the recent sell-off of high-yield bonds may continue. After bottoming at October 25’s 6.10% — the lowest reading since May 2015 — the composite speculative-grade bond yield rapidly ascended to November 2’s 6.63%. In response, the accompanying high-yield bond spread widened from 478 bp to 531 bp. The latter is very close to the spread’s predicted value of 529 bp mostly because of the return of an above-trend VIX index. To the degree Treasury yields rise faster than what is warranted by business activity, higher yields practically assure lower prices for equities and lower-grade corporates.

Initial US Q3 Growth Estimate Higher

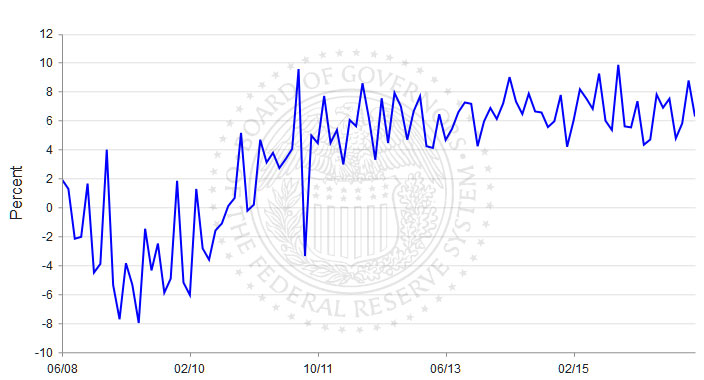
The US Bureau of Economic Analysis says real gross domestic product increased at an annual rate of 2.9 percent in the third quarter of 2016, according to the “advance” estimate. In the second quarter, real GDP increased 1.4 percent.

However a key inflation indicator in the GDP report, the personal consumption expenditures price index, slowed from the second quarter to a 1.4 percent annual rate. The Fed has focused its easy money policy on boosting inflation to 2.0 percent, based on the broader PCE price index.

The Bureau emphasized that the third-quarter advance estimate released is based on source data that are incomplete or subject to further revision by the source agency. The “second” estimate for the third quarter, based on more complete data, will be released on November 29, 2016.

Real GDP: Percent Change from Preceding Quarter

Real GDP: Percent Change from Preceding Quarter

The increase in real GDP in the third quarter reflected positive contributions from personal consumption expenditures (PCE), exports, private inventory investment, federal government spending, and nonresidential fixed investment that were partly offset by negative contributions from residential fixed investment and state and local government spending. Imports, which are a subtraction in the calculation of GDP, increased.

The acceleration in real GDP growth in the third quarter reflected an upturn in private inventory investment, an acceleration in exports, a smaller decrease in state and local government spending, and an upturn in federal government spending. These were partly offset by a smaller increase in PCE, and a larger increase in imports.

Current-dollar GDP increased 4.4 percent, or $201.1 billion, in the third quarter to a level of $18,651.2 billion. In the second quarter, current dollar GDP increased 3.7 percent, or $168.5 billion.

The price index for gross domestic purchases increased 1.6 percent in the third quarter, compared with an increase of 2.1 percent in the second quarter (table 4). The PCE price index increased 1.4 percent, compared with an increase of 2.0 percent. Excluding food and energy prices, the PCE price index increased 1.7 percent, compared with an increase of 1.8 percent.

Personal Income

Current-dollar personal income increased $153.6 billion in the third quarter, compared with an increase of $153.1 billion in the second.

Disposable personal income increased $125.3 billion, or 3.6 percent, in the third quarter, compared with an increase of $140.6 billion, or 4.1 percent, in the second. Real disposable personal income increased 2.2 percent, compared with an increase of 2.1 percent.

Personal saving was $800.6 billion in the third quarter, compared with $793.5 billion in the second. The personal saving rate — personal saving as a percentage of disposable personal income — was 5.7 percent in the third quarter, the same as in the second.

China Oceanwide Acquires Genworth For $2.7 Billion

From Zero Hedge.

China Oceanwide Holdings Group agreed to buy troubled US insurer Genworth Financial Inc. for $2.7 billion in cash, pledging to help the U.S. firm manage its debt and strengthen life insurance units after it was hurt by higher-than-expected losses tied to long-term care coverage. A China Oceanwide investment platform will pay $5.43 per share, the companies said Sunday in a statement. That’s 4.2% more than Genworth’s closing price of $5.21 Friday. The buyer also promised to provide $600 million to Genworth to address debt maturing in 2018, as well as $525 million to strengthen the life insurance businesses.

genworth“Genworth is an established leader in both mortgage insurance and long-term care insurance, which are markets that present significant long-term growth opportunities,” China Oceanwide Chairman Lu Zhiqiang said in the statement. “We are providing crucial financial support to Genworth’s efforts to restructure its U.S. life insurance businesses.”

In recent months, Genworth CEO Tom McInerney has been selling assets to ensure the insurer has sufficient liquidity after it was hit by losses on its long-term care coverage, which pays for home-health aides and nursing home stays, and as low interest rates crimp returns. At that point, it was almost as if a white knight emerged for the troubled company, one from across the Pacific. China Oceanwide plans to let Richmond, Virginia-based Genworth operate as a standalone company after the takeover with senior management still in place, according to the statement. “Genworth is an established leader in both mortgage insurance and long-term care insurance, which are markets that present significant long-term growth opportunities,” China Oceanwide Chairman Lu Zhiqiang said in the statement. “We are providing crucial financial support to Genworth’s efforts to restructure its U.S. life insurance businesses.”

A quick prime on what Oceanwide’s $2.7 billion in cash will buy it:

Genworth writes mortgage insurance in the U.S., and has stakes in a Canadian and an Australian home-loan guarantor. Mortgage insurers cover losses for lenders when homeowners default and foreclosure fails to recoup costs. This deal gives China Oceanwide the chance to benefit from gains in the U.S. housing market.

McInerney has been seeking to free up capital to pay bonds coming due, and has also been boosting capital by selling assets. He struck a deal in 2015 to sell a European mortgage unit to AmTrust Financial Services Inc. and also agreed to have Axa SA buy a European unit that offers customers protection against the financial impact of major illness, accident or death. He’s also been working to restructure the business units in a way that’s acceptable to regulators, and won approval from bondholders earlier this year to reorganize some of its units.

The deal will help give Genworth the finances to separate a life and annuity operation from another life insurance arm, according to the statement. Lu said the transaction was structured to make it easier to obtain regulatory approval.

According to Bloomberg. the deal is expected to close by the middle of 2017.
Genworth received advice from Goldman Sachs Group Inc., Lazard Ltd., Willkie, Farr & Gallagher LLP, and Weil, Gotshal & Manges LLP, while the board of directors sought guidance from Richards, Layton & Finger. China Oceanwide was advised by Citigroup Inc., Willis Towers Watson Plc, Sullivan & Cromwell and Potter Anderson & Corroon LLP.

Should the deal close, it will likely unleash a surge of more Chinese acquisitions of questionable US companies, leading to even more short squeezes on concerns that the “Chinese are coming.”

M&A Is In Very Late Cycle Mode Says Moody’s

Mergers, acquisitions and divestitures tend to accelerate when profits are nearing a cyclical peak says Moody’s.

Once it becomes apparent that organic revenues will fall short of expanding rapidly enough to supply sufficient earnings growth, companies often either look to the outside to acquire growth or attempt to divest underperforming businesses.

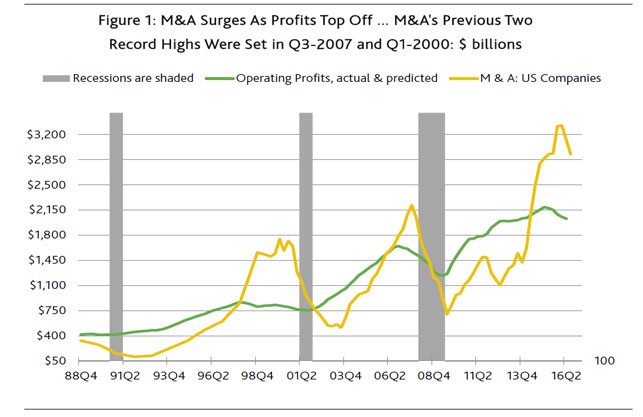
The previous two record highs for yearlong M&A activity involving at least one US-based company as either buyer or target occurred in the third quarter of 2007 and 2000’s first quarter. The cycle peaks for the yearlong averages of pretax profits from current production were set prior to the tops for M&A, in Q4-2006 and Q4-1997, respectively.

Between the peaks for profits and M&A, yearlong M&A posted scintillating average annualized growth rates of (i) 32.5% from Q4-2006 to Q3-2007 and (ii) 37.2% from Q4-1997 to Q1-2000. Similarly, M&A advanced by 15.9% annually, to a record $3.325 trillion, between profits’ latest peak of Q1-2015 to Q1-2016’s new zenith for M&A.

moodys-ma1Latest Ratio of M&A to Profits Hints of Final Stage for Current Upturn

Since 1988, the ratio of M&A to pretax operating profits has averaged 90%. Nevertheless, the ratio of M&A to profits changes considerably throughout the business cycle. For example, the ratio of M&A to profits increased from its 73% average of the first four years of 2002-2007’s business cycle upturn to 121% during the recovery’s final two years. Moreover, after averaging 58% of profits during the first seven years of 1991-2000 economic recovery, M&A soared to 197% of profits during the upturn’s final three years.

The current recovery has followed the same pattern. Through the first five years of the current recovery through June 2014, M&A averaged 74% of pretax profits from current production. However, for the following two years ended June 2016, M&A averaged 144% of profits. As inferred from the recent historical trend, the 154% ratio of M&A to profits for the year-ended June 2016 suggests that the current business upturn is much closer to its demise than to its inception.

Rebound by Equities Contradicts What Occurred Following M&A’s Prior Two Record Highs

The continuation of subpar profitability offers no assurance of new record highs for M&A, especially if some combination of higher share prices amid above-average earnings uncertainty increases the risk of overpaying for business assets. At some difficult to define inflection point, persistently soft profits begin to weigh on M&A.

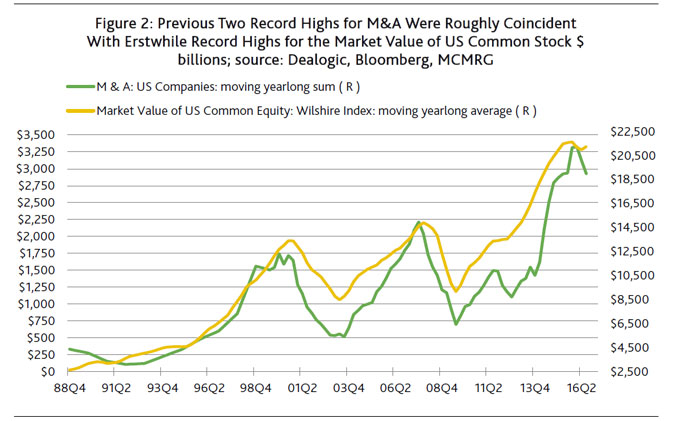
The previous two record highs for M&A suggest that M&A is likely to recede amid below-trend profits once the market value of US common stock crests. Immediately after M&A’s yearlong sum peaked in Q3-2007, the market value of US common equity set a new record high in October 2007. Similarly, March 2000’s then record high for the market value of US common stock occurred at the very end of an earlier record high for the yearlong sum of M&A.

moodys-ma2 Though the moving yearlong sum of M&A is likely to continue to fall from its latest zenith of Q1-2016, the market value of US common stock’s moving 20-day average has rebounded by 16% from its most recent low of February 15, 2016. Nevertheless, M&A has been unable to respond positively to higher share prices owing to how both business sales and profits have yet to convincingly establish rising trends. The fact that Q3-2016’s moving yearlong sum of M&A was down by -12% from its Q1-2016 peak hints of a growing sense among prospective buyers that business assets are grossly overvalued. The longer M&A slides amid a rising trend for share prices, the greater the likelihood that an equity market bubble has formed.

California Attorney General Launches Criminal Probe Into Wells Fargo Over Fake Accounts

From Zero Hedge.

John Stumpf is now gone from Wells Fargo, but his – and the bank’s – problems may be just starting.

According to a report by the LA Times, California Department of Justice is investigating Wells Fargo on allegations of criminal identity theft over its creation of millions of unauthorized accounts, according to a search warrant sent to the bank’s San Francisco headquarters this month. The warrant and related documents, served Oct. 5 and obtained by The Times through a FOIA request, confirm that California AG Kamala Harris, in the final weeks of a run for U.S. Senate, has joined the growing list of public officials and agencies investigating the bank in connection with the accounts scandal.

calc-pic

As Reuters adds, the AG warrant seeks to seize documents at Wells, and cites probable cause that felonies were committed at the bank.

Harris’ office demanded the bank turn over a trove of information, including the identities of California customers who had unauthorized accounts opened in their names, information about fees related to those accounts, the names of the Wells Fargo employees who opened the accounts, the names of those employees’ managers and emails or other communication related to those accounts.  Her office is also requesting the same information about accounts opened by Wells Fargo workers in California for customers in other states.

While on the surface this would be an admirable move, it appears to be merely the latest attempt by a politician to score brownie points with voters. According to the LA Times, Harris has made her combat of wrongdoing in the financial services industry one of the themes of her Senatorial campaign. She has especially pointed to her role in negotiating $20 billion in relief from banks for California homeowners who lost homes or suffered losses in the housing bust. But that deal failed to live up to promises she had made to send those responsible to jail, opening her up to some criticism.

Higher GDP Growth in the Long Run Requires Higher Productivity Growth

From The St. Louis Fed Blog.

Real gross domestic product (GDP) growth in the U.S. has been relatively slow since the recession ended in June 2009. It has averaged about 2 percent over the past seven years, compared with roughly 3 percent to 4 percent in the three previous expansions. At this point, the slower growth during the current recovery can no longer be attributed to cyclical factors that resulted from the recession—rather, it likely reflects a trend.


source: tradingeconomics.com

A common topic of discussion among observers of the U.S. economy is how to return to a higher growth rate for the U.S. economy. The pace of growth is important because it has implications for the nation’s standard of living. For instance, at an annual growth rate of 1 percent, a country’s standard of living would double roughly every 70 years; at 2 percent it would double every 35 years; at 7 percent it would double every 10 years.

While some might want to turn to monetary policy as the tool for increasing the GDP growth trend, monetary policy cannot permanently alter the long-run growth rate. Leading theories say that monetary policy can have only temporary effects on economic growth and that, ultimately, it would have no effect on economic growth because money is neutral in the medium term and the long term. Monetary policy can only pull some growth forward (e.g., when the economy is in recession) in exchange for less growth in the future. This process allows for a smoother growth rate across time—so-called “stabilization policy”—but there would be no additional output produced overall.

One of the most important drivers of increased real GDP growth in the long run is growth in productivity. In recent years, average labor productivity growth in the U.S. has been very slow. For the total economy, it grew only 0.4 percent on average from the second quarter of 2013 to the first quarter of 2016, whereas it grew 2.3 percent on average from the first quarter of 1995 to the fourth quarter of 2005.

What influences productivity over time? The literature on the fundamentals of economic growth tends to focus on three factors. One is the pace of technological development. Productivity improves as new general purpose technologies are introduced and diffuse through the whole economy. Classic examples are the automobile and electricity. The second factor is human capital. The workforce receives better training and a higher level of knowledge over time, both of which help make workers more productive and improve growth over the medium and long run. The third factor is productive public capital. The idea is that government would provide certain types of public capital that would not otherwise be provided by the private sector, such as roads, bridges and airports. This type of public capital can improve private-sector productivity and, therefore, may lead to faster growth.

The U.S. experienced faster productivity growth in the not-too-distant past. If we could return to the productivity growth rates experienced in the late 1990s, the U.S. economy would likely see better outcomes overall. As a nation, we need to think about what kinds of public policies are needed to encourage higher productivity growth—and, in turn, higher real GDP growth—over the next five to 10 years. The above considerations suggest the following might help: encouraging investment in new technologies, improving the diffusion of technology, investing in human capital so that workers’ skillsets match what the economy needs, and investing in public capital that has productive uses for the private sector. These are all beyond the scope of monetary policy.

The Problem With Low Interest Rates

Low interest rates have a profound impact on economies, and households. It is important to understand what is driving the ultra-low rates, and the implications for future growth. The Fed’s Vice Chairman Stanley Fischer  says lower growth, demographic changes, weak investment and global developments all are responsible for driving rates lower for longer.

However, we think there is a missing link. The factors discussed are driving incomes lower for many, making the prospect of debt repayment just a distant dream. Excessive debt was not discussed. It should be.

USA-Economy-Pic

There are at least three reasons why we should be concerned about such low interest rates. First, and most worrying, is the possibility that low long-term interest rates are a signal that the economy’s long-run growth prospects are dim. Later, I will go into more detail on the link between economic growth and interest rates. One theme that will emerge is that depressed long-term growth prospects put sustained downward pressure on interest rates. To the extent that low long-term interest rates tell us that the outlook for economic growth is poor, all of us should be very concerned, for–as we all know–economic growth lies at the heart of our nation’s, and the world’s, future prosperity.

A second concern is that low interest rates make the economy more vulnerable to adverse shocks that can put it in a recession. That is the problem of what used to be called the zero lower bound on interest rates. In light of several countries currently operating with negative interest rates, we now refer not to the zero lower bound, but to the effective lower bound, a number that is close to zero but negative. Operating close to the effective lower bound limits the room for central banks to combat recessions using their conventional interest rate tool–that is, by cutting the policy interest rate. And while unconventional monetary policies–such as asset purchases, balance sheet policies, and forward guidance–can provide additional accommodation, it is reasonable to think these alternatives are not perfect substitutes for conventional policy. The limitation on monetary policy imposed by low trend interest rates could therefore lead to longer and deeper recessions when the economy is hit by negative shocks.

And the third concern is that low interest rates may also threaten financial stability as some investors reach for yield and compressed net interest margins make it harder for some financial institutions to build up capital buffers. I should say that while this is a reason for concern and bears continual monitoring, the evidence so far does not suggest a heightened threat of financial instability in the post-financial-crisis United States stemming from ultralow interest rates. However, I note that a year ago the Fed did issue warnings–successful warnings–about the dangers of excessive leveraged lending, and concerns about financial stability are clearly on the minds of some members of the Federal Open Market Committee, FOMC.

Those are three powerful reasons to prefer interest rates that are higher than current rates. But, of course, Fed interest rates are kept very low at the moment because of the need to maintain aggregate demand at levels that will support the attainment of our dual policy goals of maximum sustainable employment and price stability, defined as the rate of inflation in the price level of personal consumption expenditures (or PCE) being at our target level of 2 percent.

That the actual federal funds rate has to be so low for the Fed to meet its objectives suggests that the equilibrium interest rate–that is, the federal funds rate that will prevail in the longer run, once cyclical and other transitory factors have played out–has fallen. Let me turn now to my main focus, namely an assessment of why the equilibrium interest rate is so low.

To frame this discussion, it is useful to think about the real interest rate as the price that equilibrates the economy’s supply of saving with the economy’s demand for investment. To explain why interest rates are low, we look for factors that are boosting saving, depressing investment, or both. For those of you lucky enough to remember the economics you learned many years ago, we are looking at a point that is on the IS curve–the investment-equals-saving curve. And because we are considering the long-run equilibrium interest rate, we are looking at the interest rate that equilibrates investment and saving when the economy is at full employment, as it is assumed to be in the long run.

I will look at four major forces that have affected the balance between saving and investment in recent years and then consider some that may be amenable to the influence of economic policy.

The economy’s growth prospects must be at the top of the list. Among the factors affecting economic growth, gains in productivity and growth of the labor force are particularly important. Second, an increase in the average age of the population is likely pushing up household saving in the U.S. economy. Third, investment has been weak in recent years, especially given the low levels of interest rates. Fourth and finally, developments abroad, notably a slowing in the trend pace of foreign economic growth, may be affecting U.S. interest rates.

To assess the empirical importance of these factors in explaining low long-run equilibrium interest rates, I will rely heavily on simulations that the Board of Governors’ staff have run with one of our main econometric models, the FRB/US model. This model, which is used extensively in policy analyses at the Fed, has many advantages, including its firm empirical grounding, and the fact that it is detailed enough to make it possible to consider a wide range of factors within its structure.

Going through the four major forces I just mentioned, I will look first at the effect that slower trend economic growth, both on account of the decline in productivity growth as well as lower labor force growth, may be having on interest rates. Starting with productivity, gains in labor productivity have been meager in recent years. One broad measure of business-sector productivity has risen only 1-1/4 percent per year over the past 10 years in the United States and only 1/2 percent, on average, over the past 5 years. By contrast, over the 30 years from 1976 to 2005, productivity rose a bit more than 2 percent per year. Although the jury is still out on what is behind the latest slowdown in productivity gains, prominent scholars such as Robert Gordon and John Fernald suggest that smaller increases in productivity are the result of a slowdown in innovation that is likely to persist for some time.

Lower long-run trend productivity growth, and thus lower trend output growth, affects the balance between saving and investment through a variety of channels. A slower pace of innovation means that there will be fewer profitable opportunities in which to invest, which will tend to push down investment demand. Lower productivity growth also reduces the future income prospects of households, lowering their consumption spending today and boosting their demand for savings. Thus, slower productivity growth implies both lower investment and higher savings, both of which tend to push down interest rates.

In addition to a slower pace of innovation, it is also likely that demographic changes will weigh on U.S. economic growth in the years ahead, as they have in the recent past. In particular, a rising fraction of the population is entering retirement. According to some estimates, the effects of this population aging will trim about 1/4 percentage point from labor force growth in coming years.

Lower trend increases in productivity and slower labor force growth imply lower overall economic growth in the years ahead. This view is consistent with the most recent Summary of Economic Projections of the FOMC, in which the median value for the rate of growth in real gross domestic product (GDP) in the longer run is just 1-3/4 percent, compared with an average growth rate from 1990 to 2005 of around 3 percent.

We can use simulations of the FRB/US model to infer the consequences of such a slowdown in longer-run GDP growth for the equilibrium federal funds rate. Those simulations suggest that the slowdown to the 1-3/4 percent pace anticipated in the Summary of Economic Projections would eventually trim about 120 basis points from the longer-run equilibrium federal funds rate.

Let me move now to the second major development on my list. In addition to its effects on labor force growth, the aging of the population is likely to boost aggregate household saving. This increase is because the ranks of those approaching retirement in the United States (and in other advanced economies) are growing, and that group typically has above-average saving rates.9 One recent study by Federal Reserve economists suggests that population aging–through its effects on saving–could be pushing down the longer-run equilibrium federal funds rate relative to its level in the 1980s by as much as 75 basis points.

In addition to slower growth and demographic changes, a third factor that may be pushing down interest rates in the United States is weak investment. Analysis with the FRB/US model suggests that, given how low interest rates have been in recent years, investment should have been considerably higher in the past couple of years. According to the model, this shortfall in investment has depressed the long-run equilibrium federal funds rate by about 60 basis points.

Investment may be low for a number of reasons. One is that greater perceived uncertainty could also make firms more hesitant to invest. Another possibility is that the economy is simply less capital intensive than it was in earlier decades.

Fourth on my list are developments abroad: Many of the factors depressing U.S. interest rates have also been working to lower foreign interest rates. To take just one example, many advanced foreign economies face a slowdown in longer-term growth prospects that is similar to that in the United States, with similar implications for equilibrium interest rates in the longer run. In the FRB/US model, lower interest rates abroad put upward pressure on the foreign exchange value of the dollar and thus lower net exports. FRB/US simulations suggest that a reduction in the equilibrium federal funds rate of about 30 basis points would be required to offset the effects in the United States of a reduction in foreign growth prospects similar to what we have seen in the United States.

Employment, Capacity Utilization and Business Cycles

From the St. Louis Fed On The Economy Blog.

Two measures commonly used to gauge the country’s economic activity have started to move in opposite directions, according to an Economic Synopses essay.

Economist Ana Maria Santacreu examined these two measures:

  • The capacity utilization rate, which is the percentage of resources used by corporations and factories to produce finished goods
  • The fraction of the labor force currently employed, which is measured as 100 percent minus the unemployment rate

Santacreu noted that companies typically use around 80 percent of their available productive capacity (measured by the capacity utilization rate). This number is higher during economic expansions and lower during recessions. She noted: “Indeed, during the most recent recession, U.S. capacity utilization dropped below 67 percent, the lowest point since the late 1960s.”

The figure below plots the two measures at quarterly intervals from 1967 through the first quarter of 2016.

As the figure shows, employment as a fraction of the labor force tends to move in a similar fashion to the capacity utilization rate. Santacreu noted that the correlation between the two measures was 0.90 for the period 1967:Q1 through 1990:Q1.

However, the correlation became less pronounced during the early 1990s economic crisis and the early 2000s dot-com bubble. Santacreu wrote: “During both episodes, capacity utilization dropped before employment did and began recovering earlier. That is, industrial activity was booming while employment was still low. This phenomenon is known as a jobless recovery.”

Following the Great Recession, these two measures didn’t follow the same pattern as in the previous two recessions. Both measures dropped initially, but employment has been recovering quickly since 2009, while capacity utilization recovered initially but began falling again in 2015.

Why the Divergence?

Santacreu noted that there are several potential reasons why unemployment took longer to recover following the recessions of the early 1990s and early 2000s:

  • Firms may have postponed hiring to be sure the recovery was strong.
  • Firms may have purchased new equipment instead of hiring additional workers.
  • Workers may have had to switch industries, which may have lengthened the time it took to fill positions.

Santacreu wrote: “This is important in comparing capacity utilization and employment as measures of economic activity. Capacity seems to be mainly affected by cyclical factors. Employment, however, is also affected by a structural factor that makes it adjust more slowly than industrial capacity adjusts to recessions and recoveries.”

Regarding the recent divergence, Santacreu noted that two factors may be at play:

  • The unemployment rate may have decreased initially because some displaced workers became discouraged and simply dropped out of the labor force.
  • More recently, new jobs have been created, bringing the U.S. closer to full employment.

Santacreu concluded: “Capacity utilization and employment tend to comove along the business cycle. However, they may drift apart when labor markets are less flexible or there are structural changes in the economy.”

Additional Resources

US Budget Deficit Spikes 34%

From Zero Hedge.

One week after the US Treasury revealed that total US debt in fiscal 2016 rose by $1.422 trillion,the third highest annual increase in history, and hitting an all time high of $19.6 trillion…

.. it also revealed that in the fiscal year ended September 30, the US budget deficit grew by $587 billion, a 34% spike compared to the post-crisis low of $439 billion in fiscal 2015, despite the Treasury enjoying a healthy surplus of $33 billion in the month of September.

The latest figures show that the government is borrowing 15 cents of every dollar it spends. Government spending went up almost 5 percent to $3.9 trillion in fiscal 2016, but revenues stayed flat at $3.3 trillion.

The deficit arose as a result of $3.3 trillion in receipts (of which $1.5 trillion in personal income taxes, and $1.1 trillion in social security and other taxes), offset by $3.9 trillion in outlays, of which Social Security was by far the biggest spending item, at $916 billion.

But more importantly, in fiscal 2016 the deficit was 3.2% of GDP, compared to a deficit of 2.5% of GDP a year earlier, which was the first increase in the deficit as a share of GDP since 2009. It was also the first increase in the deficit in dollar terms since the financial crisis.

What was also notable is that while total debt rose by over $1.4 trillion, the deficit that needed debt funding grew only $587 billion, raising questions what the rest of the debt was used for. Indicatively, the ratio in the growth of debt to deficit, was 2.4x, the second highest in history, and second only to the 2007 recorded in the year just prior to the financial crisis.