US Industrial Production Wobbles

According to the FED, industrial production decreased 0.2 percent in May after falling 0.5 percent in April. The decline in April was larger than previously reported, but the rates of change for previous months were generally revised higher, leaving the level of the index in April slightly above its initial estimate. Manufacturing output decreased 0.2 percent in May and was little changed, on net, from its level in January. In May, the index for mining moved down 0.3 percent after declining more than 1 percent per month, on average, in the previous four months. The slower rate of decrease for mining output last month was due in part to a reduced pace of decline in the index for oil and gas well drilling and servicing. The output of utilities increased 0.2 percent in May. At 105.1 percent of its 2007 average, total industrial production in May was 1.4 percent above its year-earlier level. Capacity utilization for the industrial sector decreased 0.2 percentage point in May to 78.1 percent, a rate that is 2.0 percentage points below its long-run (1972–2014) average.

Probably not enough negative news to hold off on interest rates rises in the US later in the year, but was enough to drive the markets lower overnight.

Real Wages Show US Economy is Stronger Than You Think

From The Conversation. Last month’s US employment report, released on Friday, contained a lot of good news.

First, monthly jobs growth exceeded expectations, as employers hired 280,000 people. Second, the labor force participation rate ticked up, indicating that people who had stopped looking for work were becoming more optimistic about finding a job and thus had resumed their search for one.

Finally, average hourly earnings for all production and non-supervisory workers in the private sector grew by 2%, compared with May 2014.

Some people may question why wage growth of 2% would be considered good news. The reason is there was no rise in prices over that period, so the average real wage also grew by about 2%. And it is the real wage, rather than nominal pay without accounting for inflation, that ultimately determines the living standards of the American worker.

While the first two highlights from the jobs report are indeed good news, this last one might be its most important takeaway – though it’s been true for a few months now. We’ve been reading articles for years about how stagnant wages have been without focusing on the impact of the lack of inflation. In other words, while we’re not making a lot more money, it should feel like more because consumer prices have barely budged since the financial crisis – by that measure, wages for most workers are the highest they’ve been in decades.

This matters because it suggests the economy is in better shape than we think and may be what the Federal Reserve has in mind as it considers raising rates this year, with many (including the International Monetary Fund) urging the central bank to wait until 2016.

One of the biggest risks, however, concerns productivity, which is truly stagnant. That and take-home pay are highly correlated, so if productivity doesn’t pick up, the rise in real wages may well evaporate.

The real wage story

The consumer price inflation data for May will not be released until later this month, so the balance of this essay will focus on the real wage rate in the private sector through April – although I would not expect the story to change once we can evaluate the latest data. (Hourly wage data for government workers are not available.)

I would also like to focus on the economic prospects of middle- and lower-income workers, so I will be looking at the earnings of those in production and non-supervisory roles. This group accounts for 82% of all private sector workers, who on average earned US$20.91 an hour in April.

The average hourly real wage for this group since 2007 is shown below (converted to April 2015 dollars). The shape of this graph undoubtedly will surprise many readers given the widely held believe that the middle class has been falling behind economically.

Real wages are now the highest since 1979. Bureau of Labor Statistics

The average hourly real wage did decline during the “Great Recession” and again in 2011 and 2012, but since falling to its recent low of $20.17 in October 2012 it has increased, first at a modest pace and then more rapidly since September as price inflation disappeared.

Perhaps even more surprising for most people is that the average real wage for these employees is now at the highest level since March 1979, although it is still 8.2% below the all-time peak ($22.27) reached in January 1973.

The average real wage for middle-class workers declined during the second half of the 1970s, the 1980s and the first half of the 1990s, reaching a low of $17.97 in April 1995 (data go back to 1964). Since then, wages have tended to slowly increase, with the largest gains when price inflation disappears and the greatest losses occurring when it spikes upward.

Widespread gains

That brings us back to the most recent figures. During the 12 months through April, average hourly real earnings for production and non-supervisory workers increased by 2%. These wage gains are fairly widespread among industries, as is shown in this table.

Real wages are up across the board over the past year through April. Bureau of Labor Statistics

Moreover, the greatest wage gains occurred in some of the lowest-wage industries: in retail trade (up 2.3%), accommodations (4.6%), full-service restaurants (4.7%) and fast food restaurants (3.7%). Clearly some of the lowest-paid workers in America have enjoyed some very substantial real wage gains during the past year.

Real wage gains have also far outstripped productivity gains. From the first quarter of 2014 to the first quarter of this year (most recent data), labor productivity in the non-farm business sector increased by only 0.3%, compared with real wage growth of 1.9% for private sector production and non-supervisory workers over the same period.

The poor rate of productivity growth has been a feature of the current economic recovery. Over the past five years, from the first quarter of 2010 to the first quarter of 2015, output per labor hour has increased by only 2.8%, or 0.6% per year. Over the long run, productivity growth puts a cap on the maximum rate of growth in the real hourly wage rate – meaning if productivity doesn’t start rising, neither will wages.

Why real wage growth is poorly understood

So why are people so convinced that middle- and low-wage workers have been losing ground?

Many people point to the fact that the real hourly wage is less than it was in 1973, but that reflects the decline that occurred between 1973 and 1995. Since then, the average hourly wages have been on a slow upward trend, averaging 0.76% per year – not much, but positive all the same. And as I’ve shown, those gains accelerated in the past year year, with even larger ones in lower-wage industries.

Perhaps the recent wage gains have yet to sink into people’s consciousness, and thus their assessment of the economy will shortly improve. Also, millions of people are still unemployed or have dropped out of the labor force, and their income has not benefited from the increase in average wages.

Or perhaps people are unhappy because they are comparing their financial situation with higher-income households, who have done even better, although income inequality is only slightly worse than it was in 2000, when the middle class seemed much happier (see the excellent work of Berkeley’s Emmanuel Saez).

Or maybe it’s something as simple as our spending desires outpacing the growth in the real wage rate. People clearly were spending a lot of borrowed money through 2007, when the financial crisis sharply curtailed many people’s ability to borrow and spend.

What I do know, however, is that unless productivity growth improves, the real wage gains that the data show will prove fleeting. And then we really will be in a world of hurt.

Author – Donald R Grimes, Senior Research Associate, Institute for Research on Labor, Employment and the Economy at University of Michigan

US Economic Outlook and Monetary Policy

A speech by Governor Lael Brainard at the Center for Strategic and International Studies, Washington, D.C. on “The U.S. Economic Outlook and Implications for Monetary Policy” suggests that whilst the US economic outlook is patchy, interest rates will rise.

This spring marks the end of the Federal Reserve’s calendar-based forward guidance and the return to full data dependency in the setting of the federal funds rate. So it is notable that just as policymaking is becoming more anchored in meeting-by-meeting assessments of the data, the data are presenting a mixed picture that lends itself to materially different readings.

No doubt, bad weather, port disruptions, and statistical issues are responsible for some of the softness in first-quarter indicators of aggregate spending. Indeed, it may be that the dismal estimate by the Bureau of Economic Analysis of the annualized change in first-quarter gross domestic product (GDP), negative 0.7 percent, is principally an extension of the pattern, seen for several years, of significantly slower measured GDP growth in the first quarter followed by considerably stronger readings during the remainder of the year. In that case, it would be appropriate to minimize the importance of the first-quarter estimate in judging the likely path of the economy over the remainder of the year.

But there may be reasons not to ignore the recent readings entirely. First, the limited data in hand pertaining to the second quarter do not suggest a significant bounceback in aggregate spending, which we would expect if all of the weakness in the first quarter were due to transitory factors. Private-sector forecasts of second-quarter growth are centered around 2-1/2 percent, while the Federal Reserve Bank of Atlanta’s GDPNow forecast, which was quite accurate in its prediction of the first estimate of first-quarter GDP growth, is projecting second-quarter GDP growth of only 0.8 percent.

Second, it would not be the first time this recovery has proceeded in fits and starts. The underlying momentum of the recovery has proven relatively susceptible to successive headwinds, which have kept overall economic growth well below the average pace of previous upturns.

My own reading is that earlier, more optimistic growth projections may have placed too much weight on the boost to spending from lower energy prices and too little weight on the negative implications for aggregate demand of the significant increase in the foreign exchange value of the dollar and large decline in the price of crude oil.

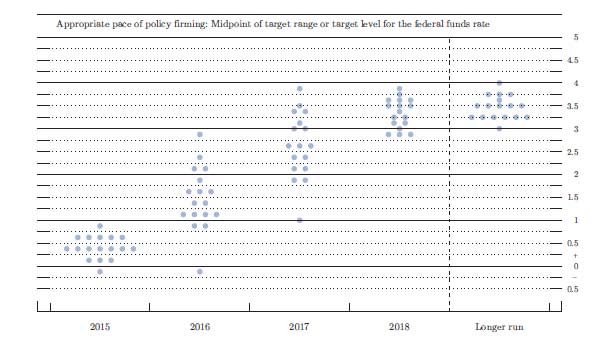
Based on today’s picture of moderate underlying momentum in the domestic economy and the likelihood of continued crosscurrents from abroad, the process of normalizing monetary policy is likely to be gradual. It is also important to remember that the stance of monetary policy will remain highly accommodative even after the federal funds rate moves off the effective lower bound, because the real federal funds rate will initially still be low and because of the elevated size of the Federal Reserve’s balance sheet and the associated downward pressure on long-term rates. Moreover, the FOMC has stated clearly that it will reduce the size of the balance sheet in a gradual and predictable manner starting at an appropriate time after liftoff, which will depend on how economic and financial conditions evolve.

In summary, the string of soft data in the first quarter raises some questions about the contours of the outlook. While it is possible that residual seasonality and temporary factors were responsible, it would be difficult, based on the data available today, to dismiss the possibility of a more significant drag on the economy than anticipated from foreign crosscurrents and the negative effects of the oil price decline, along with a more cautious U.S. consumer. This possibility argues for giving the data some more time to confirm further improvement in the labor market and firming of inflation toward our 2 percent target. But while the case for liftoff may not be immediate, it is coming into clearer view. When that time comes, the policy path will be highly attuned to incoming data and not on a preset course, and it is important to be mindful of the possibility of volatility as markets adjust to a change in the stance of policy. Thus, the FOMC will continue communicating as clearly as possible regarding the outlook and the factors underlying its policy determinations.

Chair Yellen Says US Rates Will Rise, Slowly

 In a speech by Fed Chair Janet L. Yellen at the Providence Chamber of Commerce, Providence, Rhode Island, she outlined the state of play of the US economy. Whilst there are mixed signals, she affirmed that rates will begin to rise later this year.

Implications for Monetary Policy
Given this economic outlook and the attendant uncertainty, how is monetary policy likely to evolve over the next few years? Because of the substantial lags in the effects of monetary policy on the economy, we must make policy in a forward-looking manner. Delaying action to tighten monetary policy until employment and inflation are already back to our objectives would risk overheating the economy.

For this reason, if the economy continues to improve as I expect, I think it will be appropriate at some point this year to take the initial step to raise the federal funds rate target and begin the process of normalizing monetary policy. To support taking this step, however, I will need to see continued improvement in labor market conditions, and I will need to be reasonably confident that inflation will move back to 2 percent over the medium term.

After we begin raising the federal funds rate, I anticipate that the pace of normalization is likely to be gradual. The various headwinds that are still restraining the economy, as I said, will likely take some time to fully abate, and the pace of that improvement is highly uncertain. If conditions develop as my colleagues and I expect, then the FOMC’s objectives of maximum employment and price stability would best be achieved by proceeding cautiously, which I expect would mean that it will be several years before the federal funds rate would be back to its normal, longer-run level.

Having said that, I should stress that the actual course of policy will be determined by incoming data and what that reveals about the economy. We have no intention of embarking on a preset course of increases in the federal funds rate after the initial increase. Rather, we will adjust monetary policy in response to developments in economic activity and inflation as they occur. If conditions improve more rapidly than expected, it may be appropriate to raise interest rates more quickly; conversely, the pace of normalization may be slower if conditions turn out to be less favorable.

Fast-track Could Help Roll Back Dodd-Frank

Simon Johnson, Professor of Global Economics and Management at MIT Sloan School of Management writes in The Conversation that Sen Warren is right: fast-track could help roll back Dodd-Frank

Earlier this month Senator Elizabeth Warren suggested that the Trade Promotion Authority (TPA) bill currently before Congress could make it easier, in the future, to roll back Dodd-Frank financial reforms. The reaction from the Obama administration was an immediate rebuttal, including from the president himself.

And a number of commentators joined the president’s side of the argument, claiming that Senator Warren’s concerns were hypothetical or far-fetched.

On this issue, however, Senator Warren is entirely correct, and President Obama and his supporters appear to have completely misunderstood the risks of passing TPA, dubbed fast-track, in its current form – which after some snags appears to be close to a vote in the Senate.

What TPA means in practice

The Trade Promotion Authority is a procedure for passing trade agreement-implementing legislation through Congress.

Under TPA, Congress agrees in advance to consider implementing legislation – such as the Trans-Pacific Partnership (TPP) – on an up-or-down basis. Members can vote for or against, but they cannot offer amendments.

In the House of Representatives, this amounts to promising to adopt a particular rule for implementing legislation when proposed. In practice, however, those rules are controlled by the House leadership – and they can always decide that a particular piece of legislation will be considered without amendments being allowed.

When the House leadership wants a trade agreement – as the Republicans want the TPP – then fast-track does not have much impact on the House side for free trade agreement-implementing legislation.

The real impact is on the Senate side. Here TPA would commit the Senate to vote on TPP – and any future trade agreements while TPA is in effect – without allowing any potential filibuster. So the support of only 50 senators would be needed (as the vice president can break a tie) rather than 60.

How Dodd-Frank is at risk

Dodd-Frank financial reform and regulation issues are not central, as far as we know, to the Trans-Pacific Partnership, but they are absolutely on the table in the upcoming free trade agreement with the European Union, known as the Transatlantic Trade and Investment Partnership (TTIP).

TTIP is still being negotiated, but the Europeans have said publicly and repeatedly – including recently – that they would like to include a great deal about financial regulation in this agreement. And important parts of the US and European financial sector lobby are egging them on.

The current Treasury Department is adamantly opposed to including such issues, precisely because it would impede the working of financial regulation in general and implementation of Dodd-Frank in particular. (For more details, see this Policy Brief that I wrote with Jeffrey J. Schott, my colleague at the Peterson Institute for International Economics.)

But the term of the TPA, as currently proposed, is six years. (To be precise, it is for three years, renewable for another three, but the terms of renewal are almost automatic. And as long as the Republicans control the House of Representatives in 2017-18, it will be renewed.)

If the next president agreed to amend Dodd-Frank as part of TTIP, he or she would include those changes in the bill that implements it, with no Congressional amendments allowed to strip out the financial changes.

Any direct Dodd-Frank repeal attempt in 2017 or later would presumably be subject to potential filibuster in the Senate – and as long as Democrats can control at least 41 seats, they can block it. But TPA would allow TTIP to pass the Senate with a simple majority.

The GOP’s back door to rolling back Dodd-Frank

If a Republican is elected president in November 2016, it is likely the Republicans will control the House and have a majority in the Senate – but not 60 votes. So a Dodd-Frank rollback through TTIP would be entirely feasible and easier to implement (for a Republican president in that scenario) than any kind of direct attack on the law.

The odds of this scenario are roughly the same as that of a Republican being elected president in 2016. (The latest polls show the two parties are neck-and-neck to win the White House.)

To be clear, the TPP and TTIP agreements will involve and require changes to US law, assuming specific tariffs are reduced or eliminated (and the same goes for many changes to non-tariff barriers). If a trade agreement didn’t require such changes, we wouldn’t need an implementing bill.

Politicians are often criticized for not looking sufficiently far ahead. Ironically, Senator Warren is being criticized for doing just that, applying the logic of the Obama Treasury (in not wanting financial regulation included in TTIP) and pointing out that the TPA would greatly increase the probability of exactly what the president claims he does not want: a significant or substantial legislative repeal of Dodd-Frank on any number of dimensions.

In addition, TTIP could have a chilling effect on regulation and even the supervision of finance. This is precisely why big banks are so keen to get financial regulation into TTIP.

Was it a mistake?

Why doesn’t the White House simply thank Senator Warren for pointing out this potential problem – and move to limit the term of TPA? The Republicans want TPP and soon; they would vote for a TPA that expires at the end of 2016.

President Obama says that he would do nothing to facilitate the rollback of Dodd-Frank. But his administration did exactly that with the repeal of Section 716 in December (Section 716 limited the ability of big banks to bet heavily on derivatives).

Senator Warren and others on Capitol Hill fought hard against that repeal, wanting to keep this sensible restriction on big banks. But at the decisive moments the White House pushed strongly in the other direction.

Has the White House made a simple and perhaps embarrassing mistake by seeking TPA that runs for six years? Or does the Obama administration know exactly what it is doing when it opens the backdoor to undermining its own signature Dodd-Frank legislation? The latter, unfortunately, seems more likely.

USA Industrial Production Falls Again In April

US Industrial production decreased 0.3 percent in April for its fifth consecutive monthly loss. This adds further weight to the view that interest rates hikes to normal levels in the US will be further delayed.

Manufacturing output was unchanged in April after recording an upwardly revised gain of 0.3 percent in March. In April, the index for mining moved down 0.8 percent, its fourth consecutive monthly decrease; a sharp fall in oil and gas well drilling has more than accounted for the overall decline in mining this year. The output of utilities fell 1.3 percent in April. At 105.2 percent of its 2007 average, total industrial production in April was 1.9 percent above its year-earlier level. Capacity utilization for the industrial sector decreased 0.4 percentage point in April to 78.2 percent, a rate that is 1.9 percentage points below its long-run (1972–2014) average.

USA-Produciton-May-2015

The Industrial Production and Capacity Utilization statistical release, which is published around the middle of the month, reports measures of output, capacity, and capacity utilization in manufacturing, mining, and the electric and gas utilities industries.

The industrial production (IP) index measures the real output of all manufacturing, mining, and electric and gas utility establishments located in the United States, regardless of their ownership, but not those located in U.S. territories; the reference period for the index is 2007. Manufacturing consists of those industries included in the North American Industry Classification System (NAICS) definition of manufacturing plus those industries—newspaper, periodical, book, and directory publishing plus logging—that have traditionally been considered to be manufacturing. For the period since 1997, the total IP index has been constructed from 312 individual series based on the 2007 NAICS codes. These individual series are classified in two ways: (1) market groups, and (2) industry groups. Market groups consist of products and materials. Total products are the aggregate of final products, such as consumer goods and equipment, and nonindustrial supplies (which are inputs to nonindustrial sectors). Materials are inputs in the manufacture of products. Major industry groups include three-digit NAICS industries and aggregates of these industries—for example, durable and nondurable manufacturing, mining, and utilities.