I discuss the US market and property investing more generally with Anthony Davis, currently based in Texas, but with property interests spread widely.
Tag: USA
Fed Chair On Economic Outlook and Monetary Policy Review
Jerome H. Powell spoke at the Council on Foreign Relations, New York.

He said when the FOMC met at the start of May, tentative evidence suggested economic crosscurrents were moderating, so they left the policy rate unchanged. But now, risks to their favorable baseline outlook appear to have grown with concerns over trade developments contributing to a drop in business confidence. That said, monetary policy should not overreact to any individual data point or short-term swing in sentiment.
They are also formally and publicly opening their decisionmaking to suggestions, scrutiny, and critique.
It is a pleasure to speak at the Council on Foreign Relations. I will begin with a progress report on the broad public review my Federal Reserve colleagues and I are conducting of the strategy, tools, and communication practices we use to achieve the objectives Congress has assigned to us by law—maximum employment and price stability, or the dual mandate. Then I will discuss the outlook for the U.S. economy and monetary policy. I look forward to the discussion that will follow.
During our public review, we are seeking perspectives from people across the nation, and we are doing so through open public meetings live-streamed on the internet. Let me share some of the thinking behind this review, which is the first of its nature we have undertaken. The Fed is insulated from short-term political pressures—what is often referred to as our “independence.” Congress chose to insulate the Fed this way because it had seen the damage that often arises when policy bends to short-term political interests. Central banks in major democracies around the world have similar independence.
Along with this independence comes the obligation to explain clearly what we are doing and why we are doing it, so that the public and their elected representatives in Congress can hold us accountable. But real accountability demands more of us than clear explanation: We must listen. We must actively engage those we serve to understand how we can more effectively and faithfully use the powers they have entrusted to us. That is why we are formally and publicly opening our decisionmaking to suggestions, scrutiny, and critique. With unemployment low, the economy growing, and inflation near our symmetric 2 percent objective, this is a good time to undertake such a review.
Another factor motivating the review is that the challenges of monetary policymaking have changed in a fundamental way in recent years. Interest rates are lower than in the past, and likely to remain so. The persistence of lower rates means that, when the economy turns down, interest rates will more likely fall close to zero—their effective lower bound (ELB). Proximity to the ELB poses new problems to central banks and calls for new ideas. We hope to benefit from the best thinking on these issues.
At the heart of the review are our Fed Listens events, which include town hall–style meetings in all 12 Federal Reserve Districts. These meetings bring together people with wide-ranging perspectives, interests, and expertise. We also want to benefit from the insights of leading economic researchers. We recently held a conference at the Federal Reserve Bank of Chicago that combined research presentations by top scholars with roundtable discussions among leaders of organizations that serve union workers, low- and moderate-income communities, small businesses, and people struggling to find work.
We have been listening. What have we heard? Scholars at the Chicago event offered a range of views on how well our monetary policy tools have effectively promoted our dual mandate. We learned more about cutting-edge ways to measure job market conditions. We heard the latest perspectives on what financial and trade links with the rest of the world mean for the conduct of monetary policy. We heard scholarly views on the interplay between monetary policy and financial stability. And we heard a review of the clarity and the efficacy of our communications.
Like many others at the conference, I was particularly struck by two panels that included people who work every day in low- and middle-income communities. What we heard, loud and clear, was that today’s tight labor markets mean that the benefits of this long recovery are now reaching these communities to a degree that has not been felt for many years. We heard of companies, communities, and schools working together to bring employers the productive workers they need—and of employers working creatively to structure jobs so that employees can do their jobs while coping with the demands of family and life beyond the workplace. We heard that many people who, in the past, struggled to stay in the workforce are now getting an opportunity to add new and better chapters to their life stories. All of this underscores how important it is to sustain this expansion.
The conference generated vibrant discussions. We heard that we are doing many things well, that we have much we can improve, and that there are different views about which is which. That disagreement is neither surprising nor unwelcome. The questions we are confronting about monetary policymaking and communication, particularly those relating to the ELB, are difficult ones that have grown in urgency over the past two decades. That is why it is so important that we actively seek opinions, ideas, and critiques from people throughout the economy to refine our understanding of how best to use the monetary policy powers Congress has granted us.
Beginning soon, the Federal Open Market Committee (FOMC) will devote time at its regular meetings to assess the lessons from these events, supported by analysis by staff from around the Federal Reserve System. We will publicly report the conclusions of our discussions, likely during the first half of next year. In the meantime, anyone who is interested in learning more can find information on the Federal Reserve Board’s website.1
Let me turn now from the longer-term issues that are the focus of the review to the nearer-term outlook for the economy and for monetary policy. So far this year, the economy has performed reasonably well. Solid fundamentals are supporting continued growth and strong job creation, keeping the unemployment rate near historic lows. Although inflation has been running somewhat below our symmetric 2 percent objective, we have expected it to pick up, supported by solid growth and a strong job market. Along with this favorable picture, we have been mindful of some ongoing crosscurrents, including trade developments and concerns about global growth. When the FOMC met at the start of May, tentative evidence suggested these crosscurrents were moderating, and we saw no strong case for adjusting our policy rate.
Since then, the picture has changed. The crosscurrents have reemerged, with apparent progress on trade turning to greater uncertainty and with incoming data raising renewed concerns about the strength of the global economy. Our contacts in business and agriculture report heightened concerns over trade developments. These concerns may have contributed to the drop in business confidence in some recent surveys and may be starting to show through to incoming data. For example, the limited available evidence we have suggests that investment by businesses has slowed from the pace earlier in the year.
Against the backdrop of heightened uncertainties, the baseline outlook of my FOMC colleagues, like that of many other forecasters, remains favorable, with unemployment remaining near historic lows. Inflation is expected to return to 2 percent over time, but at a somewhat slower pace than we foresaw earlier in the year. However, the risks to this favorable baseline outlook appear to have grown.
Last week, my FOMC colleagues and I held our regular meeting to assess the stance of monetary policy. We did not change the setting for our main policy tool, the target range for the federal funds rate, but we did make significant changes in our policy statement. Since the beginning of the year, we had been taking a patient stance toward assessing the need for any policy change. We now state that the Committee will closely monitor the implications of incoming information for the economic outlook and will act as appropriate to sustain the expansion, with a strong labor market and inflation near its symmetric 2 percent objective.
The question my colleagues and I are grappling with is whether these uncertainties will continue to weigh on the outlook and thus call for additional policy accommodation. Many FOMC participants judge that the case for somewhat more accommodative policy has strengthened. But we are also mindful that monetary policy should not overreact to any individual data point or short-term swing in sentiment. Doing so would risk adding even more uncertainty to the outlook. We will closely monitor the implications of incoming information for the economic outlook and will act as appropriate to sustain the expansion.
Fed Holds Again, But Is Less Patient Now.
The Fed held their rate again, but noted that inflation is still below its target range and uncertainties have increased. The patient wording from previous releases is missing, which may suggest a rate cut sooner than later. Their massive market operations continue.

“Effective June 20, 2019, the Federal Open Market Committee directs the Desk to undertake open market operations as necessary to maintain the federal funds rate in a target range of 2-1/4 to 2-1/2 percent, including overnight reverse repurchase operations (and reverse repurchase operations with maturities of more than one day when necessary to accommodate weekend, holiday, or similar trading conventions) at an offering rate of 2.25 percent, in amounts limited only by the value of Treasury securities held outright in the System Open Market Account that are available for such operations and by a per-counterparty limit of $30 billion per day.
The Committee directs the Desk to continue rolling over at auction the amount of principal payments from the Federal Reserve’s holdings of Treasury securities maturing during each calendar month that exceeds $15 billion, and to continue reinvesting in agency mortgage-backed securities the amount of principal payments from the Federal Reserve’s holdings of agency debt and agency mortgage-backed securities received during each calendar month that exceeds $20 billion. Small deviations from these amounts for operational reasons are acceptable.
The Committee also directs the Desk to engage in dollar roll and coupon swap transactions as necessary to facilitate settlement of the Federal Reserve’s agency mortgage-backed securities transactions.”
Here is their statement.
Information received since the Federal Open Market Committee met in May indicates that the labor market remains strong and that economic activity is rising at a moderate rate. Job gains have been solid, on average, in recent months, and the unemployment rate has remained low. Although growth of household spending appears to have picked up from earlier in the year, indicators of business fixed investment have been soft. On a 12-month basis, overall inflation and inflation for items other than food and energy are running below 2 percent. Market-based measures of inflation compensation have declined; survey-based measures of longer-term inflation expectations are little changed.
Consistent with its statutory mandate, the Committee seeks to foster maximum employment and price stability. In support of these goals, the Committee decided to maintain the target range for the federal funds rate at 2-1/4 to 2-1/2 percent. The Committee continues to view sustained expansion of economic activity, strong labor market conditions, and inflation near the Committee’s symmetric 2 percent objective as the most likely outcomes, but uncertainties about this outlook have increased. In light of these uncertainties and muted inflation pressures, the Committee will closely monitor the implications of incoming information for the economic outlook and will act as appropriate to sustain the expansion, with a strong labor market and inflation near its symmetric 2 percent objective.
In determining the timing and size of future adjustments to the target range for the federal funds rate, the Committee will assess realized and expected economic conditions relative to its maximum employment objective and its symmetric 2 percent inflation objective. This assessment will take into account a wide range of information, including measures of labor market conditions, indicators of inflation pressures and inflation expectations, and readings on financial and international developments.
Voting for the monetary policy action were Jerome H. Powell, Chair; John C. Williams, Vice Chair; Michelle W. Bowman; Lael Brainard; Richard H. Clarida; Charles L. Evans; Esther L. George; Randal K. Quarles; and Eric S. Rosengren. Voting against the action was James Bullard, who preferred at this meeting to lower the target range for the federal funds rate by 25 basis points.
US Home Price Gains Continue To Weaken
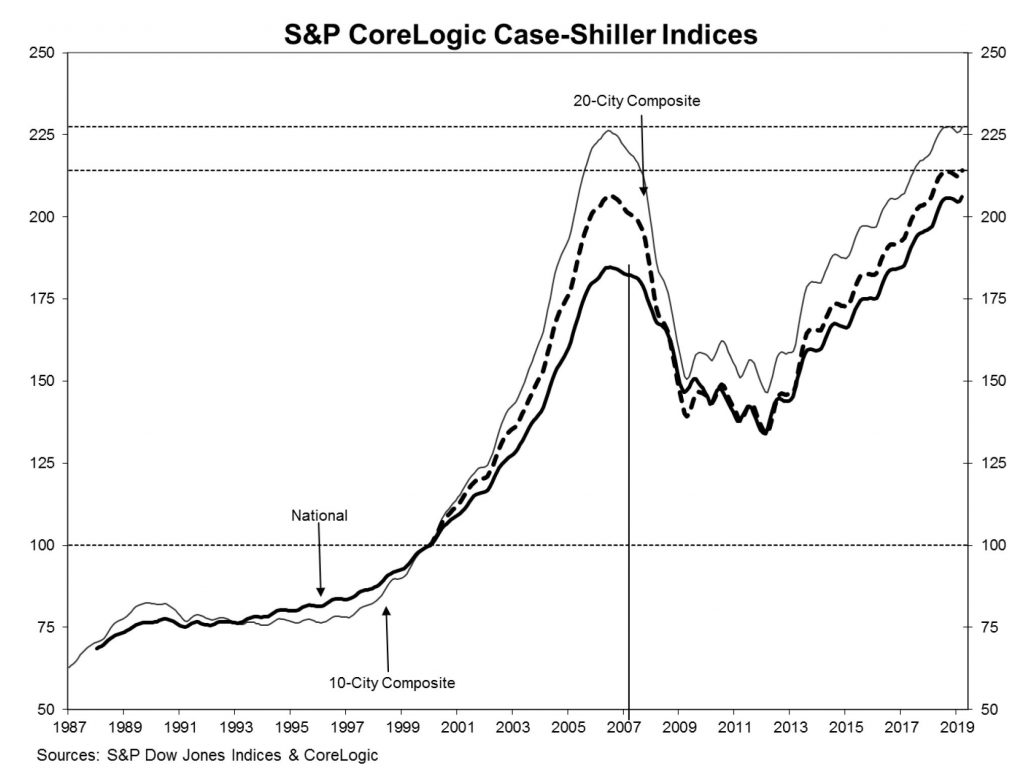
S&P Dow Jones Indices released the latest results for the S&P CoreLogic Case-Shiller Indices, the leading measure of U.S. home prices. Data released for March 2019 shows that the rate of home price increases across the U.S. has continued to slow.
The S&P CoreLogic Case-Shiller U.S. National Home Price NSA Index, covering all nine U.S. census divisions, reported a 3.7% annual gain in March, down from 3.9% in the previous month. The 10-City Composite annual increase came in at 2.3%, down from 2.5% in the previous month. The 20-City Composite posted a 2.7% year-over-year gain, down from 3.0% in the previous month.
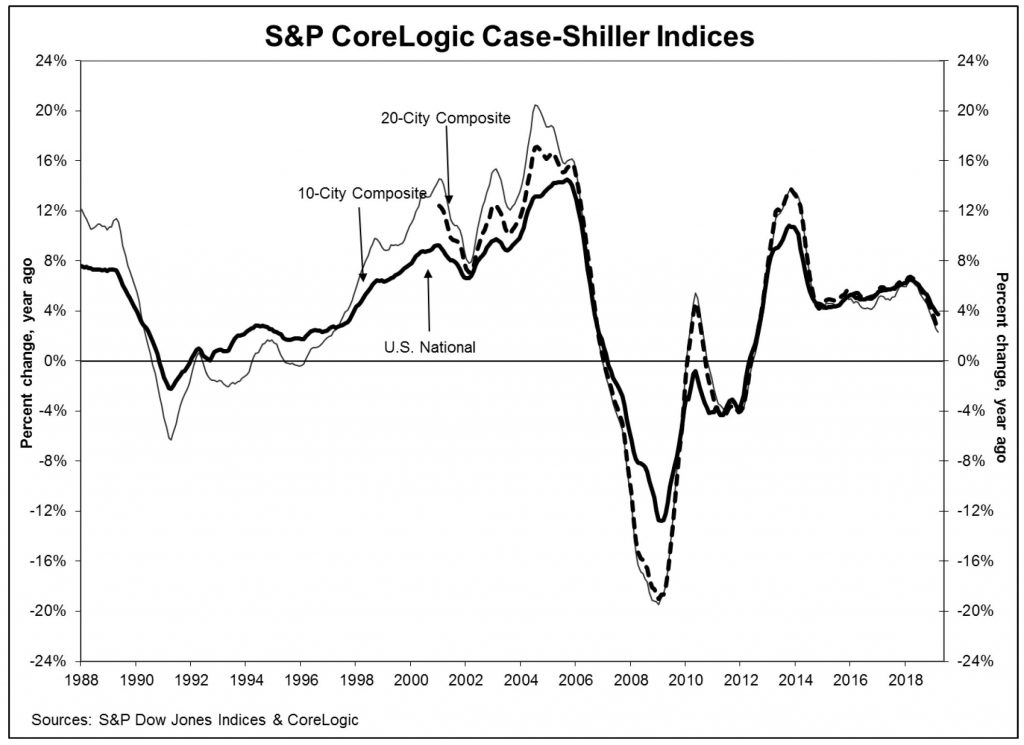
Las Vegas, Phoenix and Tampa reported the highest year-over-year gains among the 20 cities. In March, Las Vegas led the way with an 8.2% year-over-year price increase, followed by Phoenix with a 6.1% increase, and Tampa with a 5.3% increase. Four of the 20 cities reported greater price increases in the year ending March 2019 versus the year ending February 2019.
“Home price gains continue to slow,” says David M. Blitzer, Managing Director and Chairman of the Index Committee at S&P Dow Jones Indices.
“The patterns seen in the last year or more continue: year-over-year price gains in most cities are consistently shrinking. Double-digit annual gains have vanished. The largest annual gain was 8.2% in Las Vegas; one year ago, Seattle had a 13% gain. In this report, Seattle prices are up only 1.6%. The 20-City Composite dropped from 6.7% to 2.7% annual gains over the last year as well. The shift to smaller price increases is broad-based and not limited to one or two cities where large price increases collapsed. Other housing statistics tell a similar story. Existing single family home sales are flat. Since 2017, peak sales were in February 2018 at 5.1 million at annual rates; the weakest were 4.36 million in January 2019. The range was 650,000.
“Given the broader economic picture, housing should be doing better. Mortgage rates are at 4% for a 30-year fixed rate loan, unemployment is close to a 50-year low, low inflation and moderate increases in real incomes would be expected to support a strong housing market. Measures of household debt service do not reveal any problems and consumer sentiment surveys are upbeat. The difficulty facing housing may be too-high price increases. At the currently lower pace of home price increases, prices are rising almost twice as fast as inflation: in the last 12 months, the S&P Corelogic Case-Shiller National Index is up 3.7%, double the 1.9% inflation rate. Measured in real, inflation-adjusted terms, home prices today are rising at a 1.8% annual rate. This compares to a 1.2% real annual price increases in housing since 1975.”
One other point to note, after the 2007 financial crisis, home prices continued to fall for a further three years. A salutatory warning to those in Australia who think prices are about to rebound! In fact it took more than a decade for prices to return to their 2007 levels.
US CPI Is Understated
The “muzzle” on reported inflation has policymakers and analysts perplexed.
As Joseph Carson, former director of economic research at Alliance Bernstein writes in his follow up to a “New Working Theory on Inflation“, numerous economic explanations and theories have been offered, and policymakers are considering making changes to their operating price-targeting framework. Yet, before any decisions are made policymakers should consider all of the factors that could be keeping a “muzzle” on published inflation.
Here are two:
First, a little more than 20 years ago the Bureau of Labor Statistics (BLS) introduced a number of new measurement techniques in the estimation of consumer inflation (see Boskin Commission). So the current business cycle, which started in 2009, is the second consecutive cycle in which these new procedures have been employed.
Statistical changes have been made to account for product substitution, a greater degree of quality changes in products and services and faster introduction of new outlets or ways in which people shop. The introduction of new variables in the estimation of inflation alters the pattern and at various times the rate of change as well.
Prior to their implementation, analysts and government statisticians estimated that the potential reduction in core inflation from all of these statistical changes would range from one-half to a full percentage point. Yet, all of those estimates were looking backwards and there is no guidance from the statistical agencies of the scale of the reduction in reported inflation after implementation.
Odds are high that the impact on reported inflation varies year to year, with some years at the upper end of range of estimate and others at the lower end. Nonetheless, to overlook the impact from changes in measurement would be shortsighted, especially since changes in consumer price of a few tenths of a percent or more do matter a lot when inflation is low, and readings below the 2% target could be misconstrued as a failure of monetary policy, which in turn “forces” the Fed to maintain an unnecessarily easy monetary policy, which results in asset bubbles and wealth inequality, when in fact the only applicable consideration is that the BLS and the Dept of Labor are measuring inflation incorrectly.
Second, research conducted by the Federal Reserve staff has found that the shift in the measurement of shelter costs two decades ago to only use only prices from rental market and exclude those from the owners housing market systematically removed the largest single “driver” of cyclical inflation, while it also simultaneously reduced the volatility in reported inflation.
The significance of these findings has not received as much attention as they should. Removing the largest single driver of cyclical changes in inflation means that reported inflation nowadays does not exhibit the same sensitivity to economic growth and interest rates, as was the case in previous cycles. Accordingly, one of the reasons why the trade-off between changes in unemployment and reported inflation has been so benign in the last 20 years is due to changes in price measurement.
The missed signal from housing inflation was readily apparent in the 2000s when core inflation peaked at a relatively modest 2.5% even though house price increases were recording double-digits increases. In previous business cycles in which house prices recorded gains north of 10% core inflation readings were two or three times higher. In the current cycle, house price increases have run ahead of rent increases, but not to same extent as was the case in the 2000s.
As Carson concludes, these findings strongly suggest that price measurement issues are important to consider when looking at trends in the reported inflation data. For all of the conceptual changes and measurement issues the key question policymakers should be asking is whether the “muzzle” on reported inflation still makes it a useful benchmark for the price-targeting framework. The fact that currently constructed published price measure miss modern day inflation in the asset markets strongly suggests policy may need a new working definition of inflation before they contemplate any changes to the price-target framework.
That’s the theory. Now, courtesy of Bloomberg, here is a dramatic observation of the practical implications of erroneous inflation measurements, which suggests that the US government is under-representing arguably the most important aspect of the consumer price inflation basket, that of food, by as much as 40%.
When Bloomberg’s Cameron Crise encountered the dataset that is used to compute elements of the CPI that is in turn used by the Fed to determine monetary policy (and more often than not, results in asset price bubbles) he decided to compare how this theoretical price compares to real world prices.
Ignoring such volatile series as cell phones or haircut prices, he instead focused on groceries, and specifically cereals and bakery products, “the kind where you can buy the same thing in every grocery store in the country.” He notes that there are six components to this subindex:
- all-purpose flour,
- long-grain rice,
- white bread,
- wheat bread,
- pasta
- chocolate chip cookies.
Then, to figure out what the real world prices are (i.e. not the “extorionate prices we pay in greater New York”), he signed up for supermarket delivery services in Columbus, Ohio, and Murfreesboro, Tennessee, because “while they may not represent the exact national average, they nevertheless seem like a reasonable proxy for middle America.”
Once the representative middle-America venues had been picked , a selection was made of an identical basket of six goods, converting them to a unit price per pound ala the CPI basket. And while the products chosen “aren’t bargain-basement” value” generics, they aren’t premium foodstuffs either.” The results, as Crise, notes, “were pretty compelling.”
As the table below shows, the CPI is chronically misrepresenting the price of every product in the food basket, with the gap between the government “price” and the average real-world price ranging from 14% in the case of chocolate chip cookies, to as much as 64% for a pound of white bread.
Overall, in the specific case of cereals and bakery goods, the difference between the CPI price for the basket of six core food products, and the average price of the same products in Ohio and Tennessee, is a whopping 39%. This same execrise extended to all other goods and services in the basket would reveal a similar bias to misrepresenting prices to the downside relative to reality.
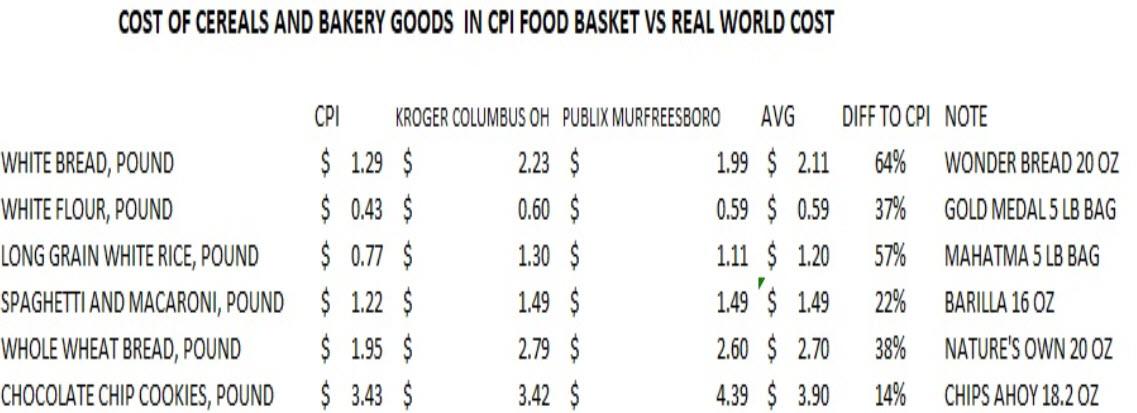
Here again are the results, represented visually.
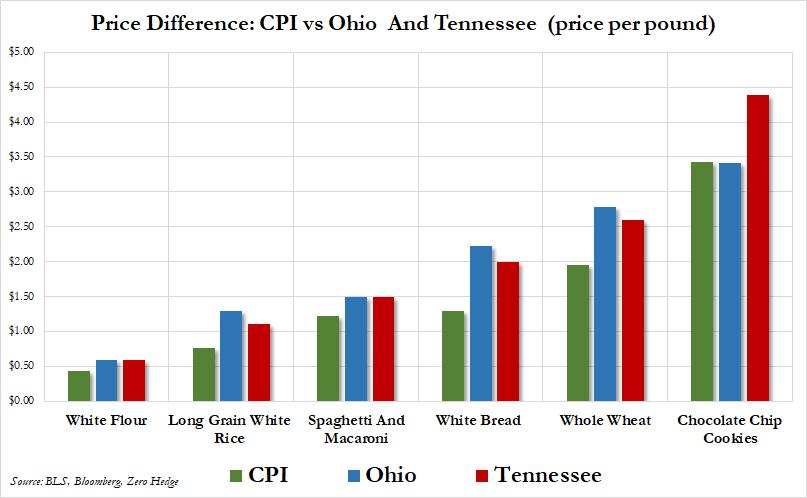
The critical problem represented above is that while the Fed believes that the CPI calculation is accurate, and thus Americans can be subject to far looser monetary policy as the FOMC believes they are paying far less, the reality is that monetary conditions have to be far tighter for reality to catch down with the BLS’s woefully incorrect price assumptions.
And keep in mind, the example above represents what middle-America is paying. The prices for these goods along the east or west seaboard would be substantially higher, resulting in a far greater underpricing of reality by the BLS.
As Crise observes: “while there was one instance where the real world cost matches the bureaucratic estimate, for the most part food – or at least this kind of food – is a lot more expensive than the bean counters would have you believe.“
And his conclusion: “perhaps if the Fed wants to see higher inflation, they should just send a few staff economists to the “social Safeway” in Georgetown.”
How millennials are affecting the price of your home
It used to be that everyone wanted to buy a home, seeking pleasure and security, as well as the potential for future wealth.

But younger Americans are buying homes far less often than their elders’ generations did, and that puts a large sector of the U.S. economy at risk.
Millennial home ownership levels are dramatically lower than the those of previous generations at a similar age. In 1985, 45.5% of 25- to 34-year-olds owned homes in the U.S. By 2015, this had fallen about 25%.
Since the housing industry currently accounts for 15% to 18% of the nation’s gross domestic product, any change in established behavior could have substantial consequences on the larger economy.
Researchers like me who are interested in the future of the U.S. economy are faced with some difficult questions about how millennials’ behavior is changing the housing market.
My recent research suggests that both increases and decreases in home prices can be directly tied to where millennials choose to live. If a long-term behavioral change is afoot, and this generation continues not to buy homes, it will very directly impact GDP.
Homeownership
Research has shown that younger generations lag behind previous generations in terms of milestones like homeownership and marriage.
One of the assets that set previous generations apart is home equity. In 2001, Gen-Xers held an average of US$130,000 in assets, compared to millennials in 2016 that held almost 31% less.
However, assets attributed to home equity are subject to the whims of the housing market. Just ask anyone still underwater on a home purchased before the financial crisis.
And home equity isn’t just vulnerable to large-scale economic upheavals. In fact, it’s constantly fluctuating.
Age and cost
I analyzed data from the U.S. Census Bureau and American Community Survey from about 800 of the most populous counties in the U.S., or about 85% of the population, in a study that has not yet been published. The data show a rather disconcerting trend.
If no one ever moved from one county to another, almost all counties would gradually grow older in terms of average age.
However, the migration of primarily younger individuals has caused an escalation in this aging shift. Some areas are aging much more quickly than expected. In those areas, home prices have been vulnerable to long-term declines.
In other words, the trend of rising or falling home values follows patterns of migration in the U.S.
From 2010 to 2016, counties with aging populations were about 50% more likely to have experienced a decline in home values than those counties that were becoming “younger.” Not surprisingly, counties that were becoming younger were often experiencing increases in both populations and in the prices of homes.
Two areas that provide an illustration of this are key to the oil and gas industry: the Midland-Odessa area of Texas and Ward County, North Dakota. Both areas have experienced not only a net decrease in the age of residents, but also a net increase in population.
This is far from a rural phenomenon. In Allegheny County, the Pennsylvania county that’s home to Pittsburgh, a similar increase in population has also decreased the average age of its residents.
The cost of a home
Millennials’ migration to particular counties has fueled speculative real estate transactions.
In 2018, such transactions are reaching levels just below the pre-crisis highs, accounting for almost 11% of all homes sold last year. The prices are inflated by buyers looking to “flip” houses. This forces younger buyers to compete with the professionals, pushing them out of the markets they are migrating to.
Younger buyers are further frustrated by the cost of what economists refer to as frictions. Frictions include commissions that average 5% to 6% of the purchase price, myriad inspection and appraisal fees, as well as mortgage and title insurance. All of this runs counter to the transparency and ease of access many millennials have become used to in the modern world.
Since the younger generation is better educated, one might expect significant wage increases to counter some of these frictions. But recent graduates between the ages of 22 and 27 earn about 2% less than their predecessors did in 1990.
If home prices had also stayed relatively flat, this likely wouldn’t be an issue. However, from 2000 to the present, average home prices have increased by about 3.8% annually, though this varies dramatically from county to county.
As urban areas continue to attract more new residents, many young people may need to reassess the true value that home ownership offers. Meanwhile, older generations are likely just becoming aware of the impact of millennial migration on the American dream. If you live in an area that is aging faster than the natural rate, the probability of your home value decreasing is very real.
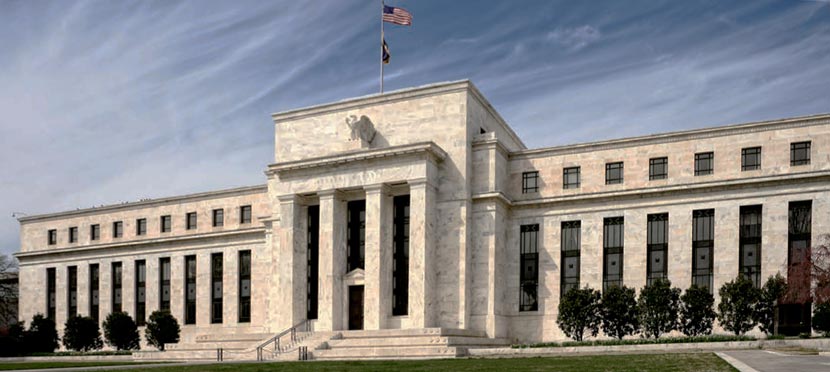
Fed Holds, Cuts Unlikely
The Fed held their rate (some were expecting a cut), and as a result, markets eased back, while bond yields rose. They underscored the patient approach ahead, but also a willingness to look though low inflation in the nearer term.
The Board of Governors of the Federal Reserve System voted unanimously to set the interest rate paid on required and excess reserve balances at 2.35 percent, effective May 2, 2019. Setting the interest rate paid on required and excess reserve balances 15 basis points below the top of the target range for the federal funds rate is intended to foster trading in the federal funds market at rates well within the FOMC’s target range.
Information received since the Federal Open Market Committee met in March indicates that the labor market remains strong and that economic activity rose at a solid rate. Job gains have been solid, on average, in recent months, and the unemployment rate has remained low. Growth of household spending and business fixed investment slowed in the first quarter. On a 12-month basis, overall inflation and inflation for items other than food and energy have declined and are running below 2 percent. On balance, market-based measures of inflation compensation have remained low in recent months, and survey-based measures of longer-term inflation expectations are little changed.
Consistent with its statutory mandate, the Committee seeks to foster maximum employment and price stability. In support of these goals, the Committee decided to maintain the target range for the federal funds rate at 2-1/4 to 2-1/2 percent. The Committee continues to view sustained expansion of economic activity, strong labor market conditions, and inflation near the Committee’s symmetric 2 percent objective as the most likely outcomes. In light of global economic and financial developments and muted inflation pressures, the Committee will be patient as it determines what future adjustments to the target range for the federal funds rate may be appropriate to support these outcomes.
In determining the timing and size of future adjustments to the target range for the federal funds rate, the Committee will assess realized and expected economic conditions relative to its maximum employment objective and its symmetric 2 percent inflation objective. This assessment will take into account a wide range of information, including measures of labor market conditions, indicators of inflation pressures and inflation expectations, and readings on financial and international developments.
US GDP Surprises Higher
The latest data from the bea shows a GDP provisional estimate significantly above expectations, which may suggest the FED will not have to be as patient as they signalled recently. Perhaps expectations of a future recession are overblown?
Real gross domestic product (GDP) increased at an annual rate of 3.2 percent in the first quarter of 2019, according to the “advance” estimate released by the Bureau of Economic Analysis. In the fourth quarter of 2018, real GDP increased 2.2 percent.
The Bureau’s first-quarter advance estimate released today is based on source data that are incomplete or subject to further revision by the source agency. The “second” estimate for the first quarter, based on more complete data, will be released on May 30, 2019.
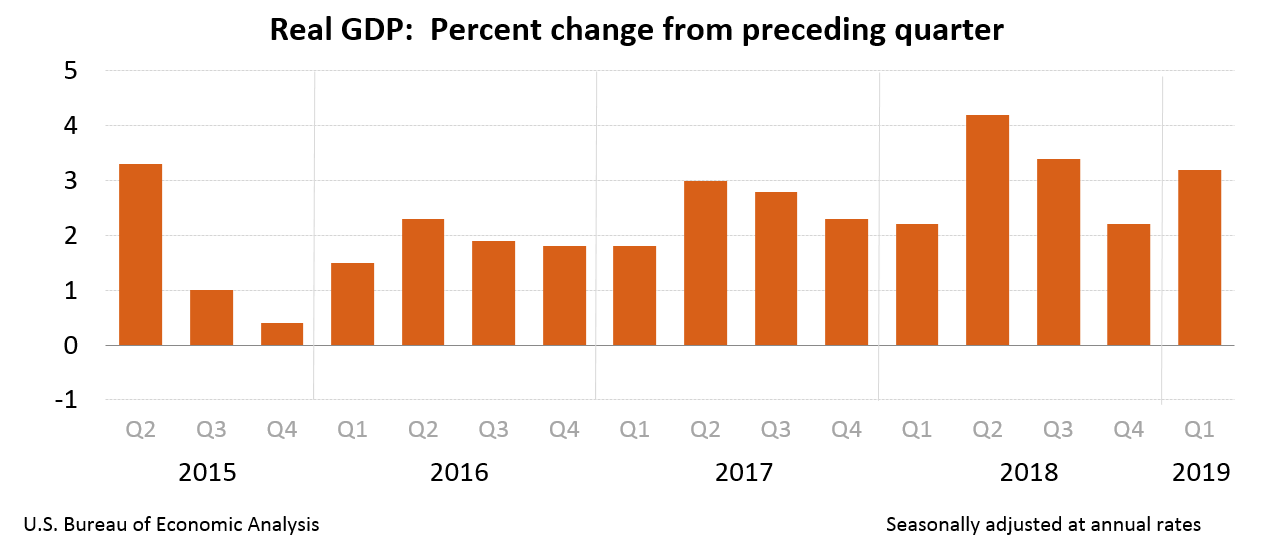
The increase in real GDP in the first quarter reflected positive contributions from personal consumption expenditures (PCE), private inventory investment, exports, state and local government spending, and nonresidential fixed investment. Imports, which are a subtraction in the calculation of GDP, decreased. These contributions were partly offset by a decrease in residential investment.
The acceleration in real GDP growth in the first quarter reflected an upturn in state and local government spending, accelerations in private inventory investment and in exports, and a smaller decrease in residential investment. These movements were partly offset by decelerations in PCE and nonresidential fixed investment, and a downturn in federal government spending. Imports, which are a subtraction in the calculation of GDP, turned down.
Current dollar GDP increased 3.8 percent, or $197.6 billion, in the first quarter to a level of $21.06 trillion. In the fourth quarter, current-dollar GDP increased 4.1 percent, or $206.9 billion.
The price index for gross domestic purchases increased 0.8 percent in the first quarter, compared with an increase of 1.7 percent in the fourth quarter (table 4). The PCE price index increased 0.6 percent, compared with an increase of 1.5 percent. Excluding food and energy prices, the PCE price index increased 1.3 percent, compared with an increase of 1.8 percent.
Personal Income
Current-dollar personal income increased $147.2 billion in the first quarter, compared with an increase of $229.0 billion in the fourth quarter. The deceleration reflected downturns in personal interest income, personal dividend income, and proprietors’ income that were partly offset by an acceleration in personal current transfer receipts.
Disposable personal income increased $116.0 billion, or 3.0 percent, in the first quarter, compared with an increase of $222.9 billion, or 5.8 percent, in the fourth quarter. Real disposable personal income increased 2.4 percent, compared with an increase of 4.3 percent.
Personal saving was $1.11 trillion in the first quarter, compared with $1.07 trillion in the fourth quarter. The personal saving rate — personal saving as a percentage of disposable personal income — was 7.0 percent in the first quarter, compared with 6.8 percent in the fourth quarter.
The US Stock Market And Wealth Inequality
Moody’s says that inequality has been increasing in the U.S. for decades. This has been well-documented. However, new data from the Federal Reserve shed additional light on the distribution of wealth and how it has evolved over time. The Distributional Financial Accounts show levels and share of wealth across four segments of the wealth distribution: the top 1%, the next 9%, the rest of the top half, and the bottom half. This is done by sharing out household wealth as shown in the Financial Accounts using primarily the Survey of Consumer Finances, supplemented with other information in some instances.
The data clearly show the skewed distribution of wealth. The most recent data, for the fourth quarter of last year, show that the wealthiest 1% of households held 30.9% of total household wealth, only marginally below the record high of 31.7% a year earlier and well above the 1990 low of 22.5%. By contrast, the bottom half of the wealth distribution holds only 1.2% of all wealth, down from over 4% at points during the 1990s. However, it is better than the period immediately after the Great Recession, when this group was in debt in aggregate.
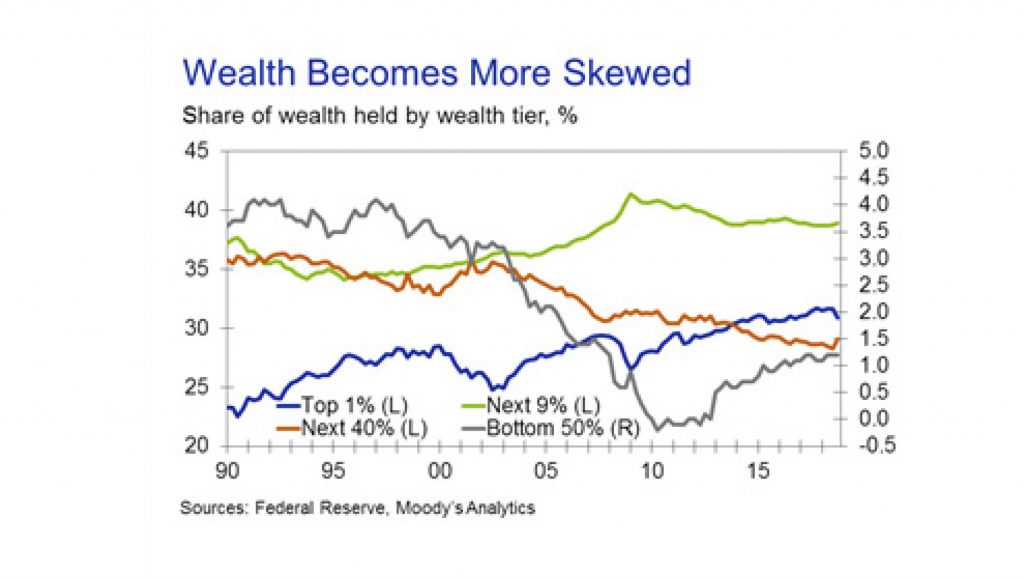
One clear feature of the data is that the distribution of wealth doesn’t change in a linear fashion. The share of wealth held by the richest 1% has declined at times, and in some cases sharply. For example, the share topped 28% at the start of 2000 before falling under 25% in late 2002. Similarly, the share fell from 29.4% in late 2007 to 26.5% in early 2009. Both declines corresponded with sharp declines in U.S. stock prices.
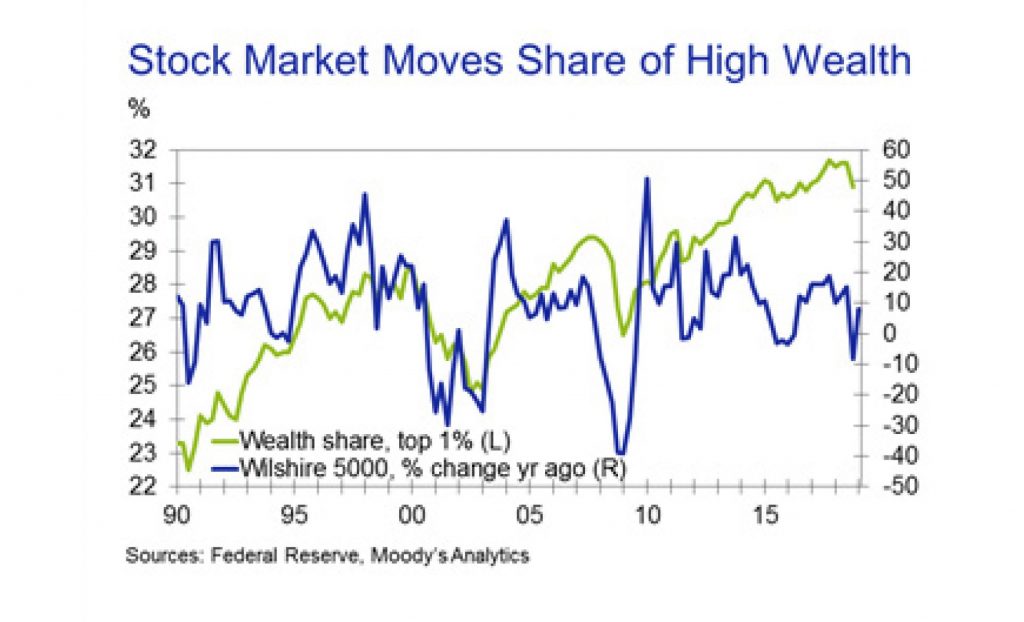
Ownership of stocks is heavily skewed toward the high end of the income and wealth distribution. Hence, the stock market is a strong driver of the share of wealth held by the richest households. The extent of the correlation may be surprising.
More interesting, the correlation largely breaks down for the next richest 9% of the population. Their share of wealth fell in the early 1990s, then rose steadily until the Great Recession before trending lower. While there is some correlation with movements in stock prices, they are clearly not the dominant driver they are for the richest households. This emphasizes how skewed wealth related to equity prices is.
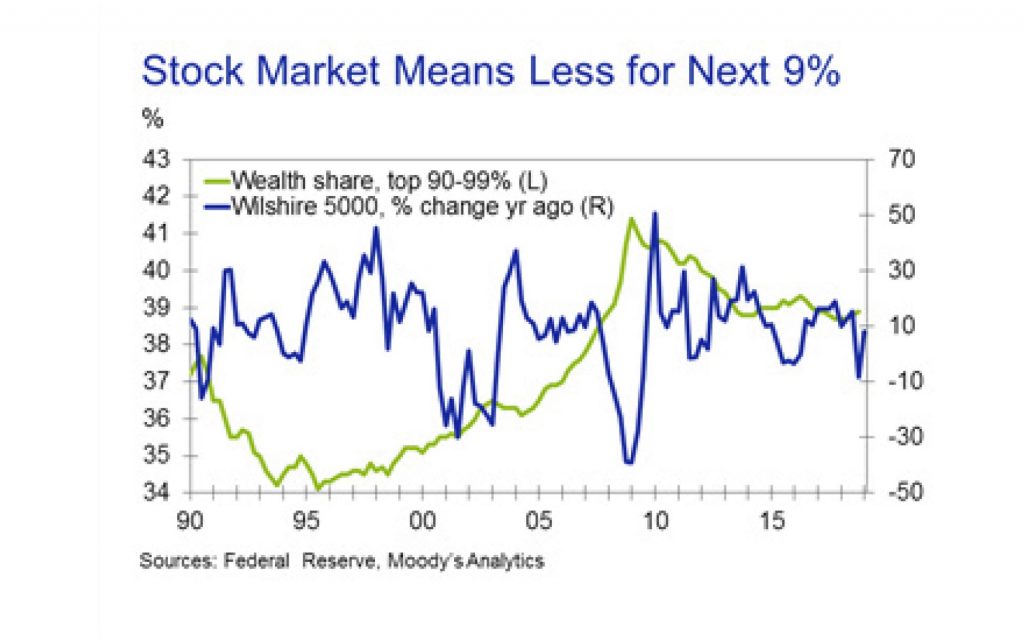
To drive home the point, the correlation between the share of total wealth held by the richest 1% of households and the share of corporate equities and mutual fund shares held by the richest households is an astounding 94%. At present, equities and fund shares account for nearly 40% of wealth for this group of households. However, this share has grown dramatically over time. In the early 1990s it was under 20%, and over the entire history of the series it averages 30%.
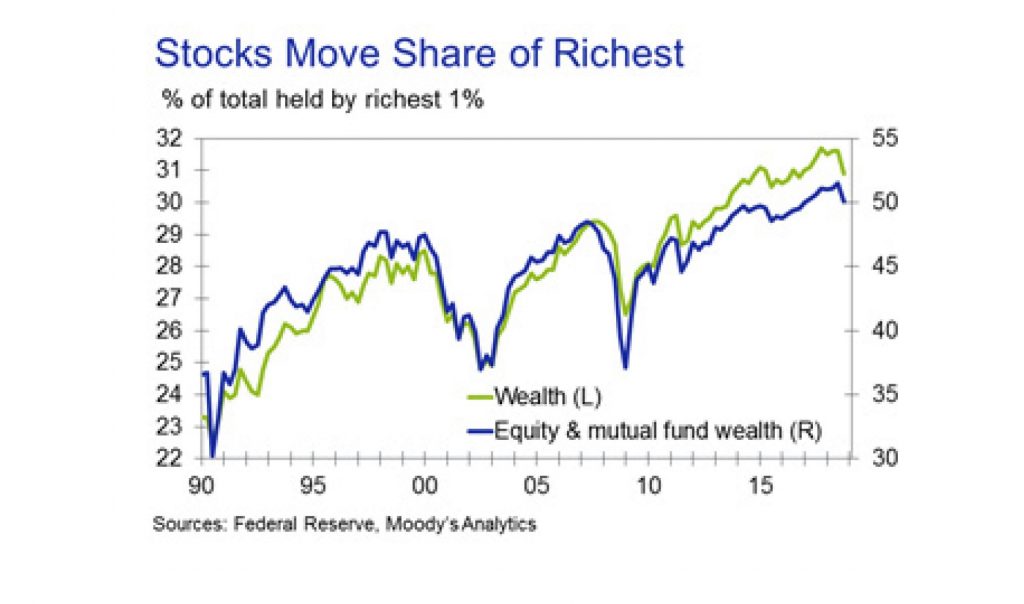
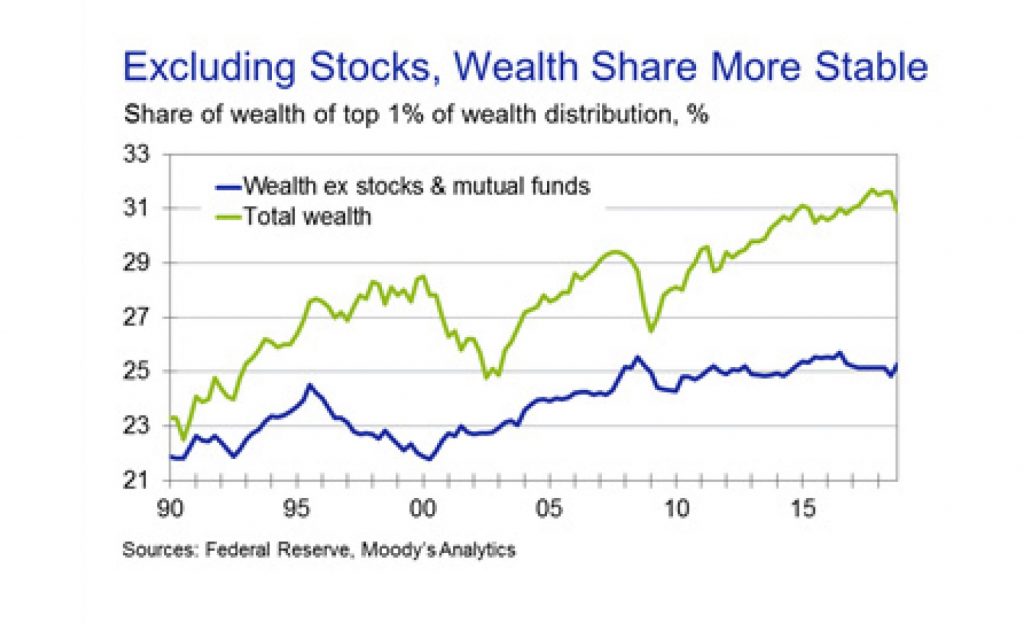
This one component of wealth is the major driver of changes in share for the wealthiest households. Their share of wealth excluding stocks and mutual fund shares is about 4 percentage points lower on average, rises less, and is much more stable. This may understate the impact of equity prices on the wealth of these households, since equities are included in life insurance reserves and pension entitlements and correlate with equity in noncorporate businesses.
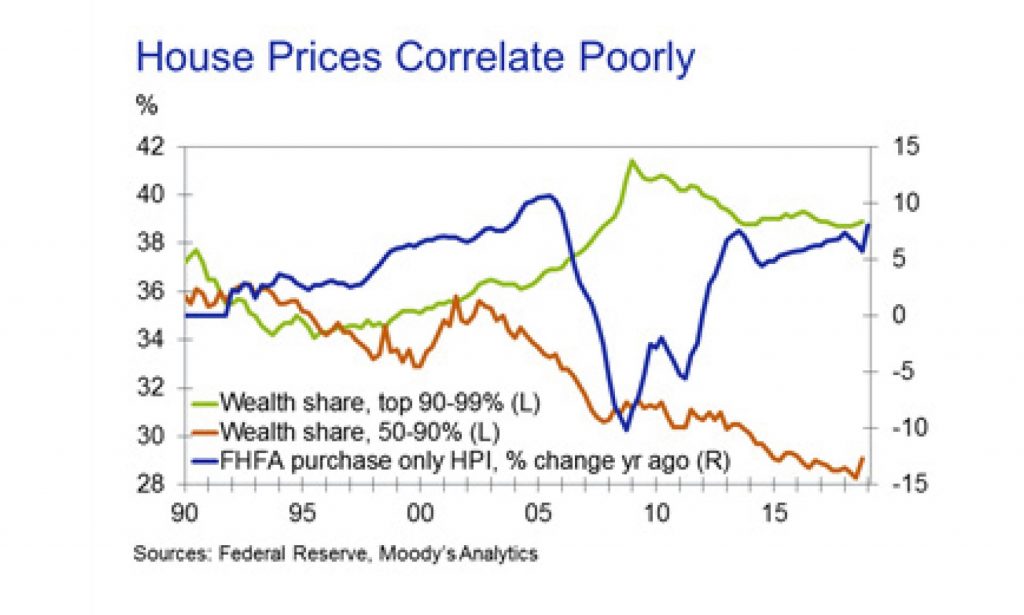
Other obvious candidates as drivers of changes in the wealth distribution fail to achieve anything like the apparent impact of equity markets. Despite making up a larger portion of household assets than corporate equities and mutual funds, housing wealth is less of a driver of wealth shares. Houses are more commonly owned, and, other than around the Great Recession, movements in house price growth tend to be gradual. Even for the lower-wealth households, where real estate would be their primary asset, there seems little linkage between house price growth and those households’ share of total wealth. Similarly, the link between unemployment and wealth shares is weak.
The differences in the makeup of household balance sheets at different positions in the wealth distribution are also shown in the distributional accounts data. This is one of the driving factors in the share movements. Therefore, it should not be surprising that corporate equities and mutual funds are most important for the richest households. They account for over a third of assets for the wealthiest 1% of households, compared with about a fifth for the next 9% of households, under 10% for the next 40% of households, and under 4% of assets for the bottom half of the wealth distribution. Equity in noncorporate business is similarly skewed heavily toward wealthy households.
By contrast, real estate assets are the most important piece of the balance sheet for the bottom half of the wealth distribution. For this group, they account for about half of all assets. The share declines sharply as wealth increases until it falls below 12% of assets for the richest 1% of households.
Pension entitlements are an important component of the balance sheet for households in the upper half of the wealth distribution, excluding the very rich. They make up almost a third of assets for households in the 50th-90th percentiles of the distribution and about 30% for households in the top 10% excluding the top 1%. However, they make up less than 10% of assets for the very wealthy and bottom half of the distribution. Most likely, lower-wealth households don’t have pensions while pensions for the very wealthy are swamped by other assets. Pension entitlements are important for future spending but may be less important for current spending if they are not well-understood.
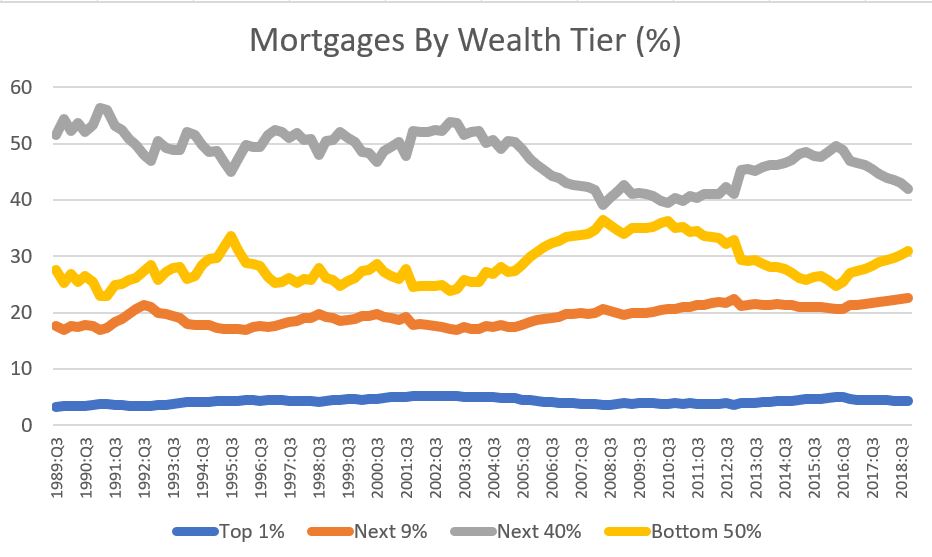
Liabilities follow what is probably an expected pattern. Mortgages account for a little over two-thirds of total household liabilities. However, they account for only a bit more than half of debt for households in the bottom half of the distribution. Consumer credit accounts for about 40% of their debt, the highest for any of the segments and well above the average of about a quarter.
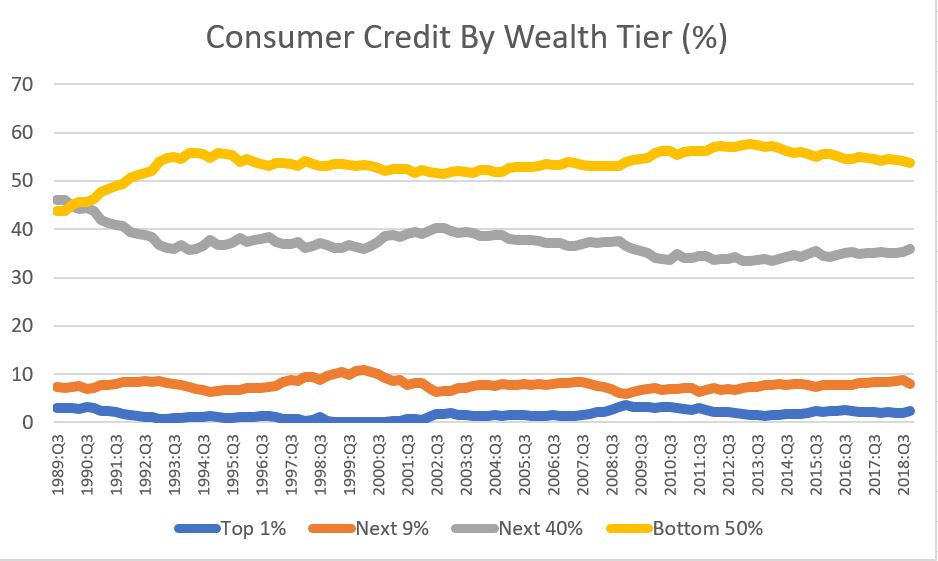
The mortgage share increases until the top 1% of the distribution. They have nearly 15% of their debt in the other loans and advances category, dramatically more than other segments. This category captures debt related to their businesses and investments. Hence, just as real estate is a smaller portion of assets for the richest households, so too is mortgage debt a smaller share of liabilities.
The stock market has shown itself to be an important driver of the distributions of wealth. Current prospects are for the market to perform poorly by historical standards over the next year or so.
Economic growth is expected to slow and valuations remain high. Neither is favorable for the market.
The one silver lining in this is that weak stock market performance tends to associate with a moderation in wealth inequality.
Housing Manhattan Style, Reality Bites
In February, the StreetEasy Manhattan Price Index dropped to its lowest level since July 2015.

Many sellers across New York City cut prices on their homes this February as winter brought a chill to the sales market. In Manhattan, more than 1 in 10 homes had their prices cut, and inventory increased by 11.7 percent from last year. With inventory levels and the share of price cuts high across the borough, prices cooled, too. The StreetEasy Manhattan Price Index [dropped 4.3 percent to $1,119,183, its lowest level since July 2015.
Even with prices down and an abundance of inventory, buyers continued to hesitate to make deals. Manhattan homes spent a median of 117 days on the market — up 27 days year-over-year, and the highest level in seven years. This trend appeared in all areas and price points across the borough. Downtown Manhattan [saw the largest increase in median days on market — up 31 from last year, to 117 days total.
“With a strong economy and home-shopping season right around the corner, plenty of New Yorkers are well-positioned to buy this spring. However, many are willing to walk away from deals that just aren’t financially attractive and continue renting instead — creating a market poised to punish sellers who don’t price their homes sensibly,” says StreetEasy Senior Economist Grant Long. “When the inevitable wave of new inventory hits the market this spring, interested buyers should expect to see an uptick in price cuts as the market forces ambitious sellers to accept reality.”
