In the early hours of the morning of 7 October 2016, the sterling-US dollar exchange rate fell by nearly 10% within around 40 seconds. Most of this movement was reversed within the ten minutes that followed. This was one of a series of such ‘flash’ episodes in major financial markets – that is sharp and short-lived movements in price, which vastly exceed perceived changes in economic fundamentals. It certainly didn’t fail to catch the eye of policymakers, or the media.
This post summarises a recent working paper by Bank staff to understand what happened and why.
What happened?
To get at this question, we took high frequency data from the Thomson Reuters platform. Day-to-day, this platform facilitates between five and ten per cent of trading in the sterling-US dollar spot market – one of the most liquid currency pairs in the world.
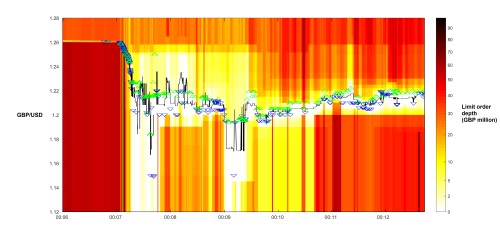
Chart 1 shows data taken from this platform around the episode:
The triangles show the prices at which individual transactions took place. Those in blue (pointing down) indicate transactions initiated by a participant seeking to sell sterling. Those in green (pointing up) indicate those initiated by an order to buy.
The shaded regions show the cumulative distribution of limit orders around these prices. Limit orders are unexecuted orders to buy or sell sterling posted by prospective traders.
The relative weight of the shading on the chart shows the quantity of limit orders between a given price and the limit orders to buy/sell at the highest/lowest prices (the ‘best bid/ask prices’). As might be expected, prices further from the best bid/ask are shaded in darker colours. This indicates that there lies a larger cumulative quantity of limit orders between them and the best bid/ask.
The black line shows the midpoint – or ‘mid-price’ – between the best bid/ask prices.
From this chart we can construct a rough narrative of events:
In the minute preceding the crash, between six and seven minutes past midnight (00:06:00 and 00:07:00 British Summer Time), there was quite a large depth of orders both to buy and sell sterling (£60 million of orders in the observed ten levels of price closest to the best bid and ask prices).
But at around 00:07:00, an imbalance started to develop – with the quantity of orders to sell sterling starting to exceed those to buy.
It was at this point that a rapid succession of trades took place in sterling, at rapidly declining prices.
This imbalance became particularly severe around 00:07:17 BST. This can be seen from the large white areas in the graph, which indicate there to be (close to) no orders to buy sterling. In the half minute that followed, market functioning was severely impaired, with large ‘gaps’ in price visible between trades.
The quantity of, and balance between, limit orders to buy/sell sterling recovered after about 30 seconds but deteriorated severely again after around one minute. Shortly after 00:09 BST, there was a further sharp reduction in orders to buy sterling (corresponding to another white area on the chart).
The order book started to increase in depth around 00:09:30 BST, around 150 seconds after the initial sharp movement in price.
Thankfully, the events of the night of 7 October 2016 were without lasting consequences for financial stability, or the integrity of the functioning of the market for sterling. Higher than usual volumes were observed during the day that followed, and measures of illiquidity (including bid-ask spreads) remained slightly elevated; but broader spill overs were generally limited.
That, however – understandably – hasn’t stopped the search for answers.
…and why?
In its report on the episode, the Bank for International Settlements (2017) found the movement in the currency pair to have resulted from a confluence of factors. These included larger-than-normal trading (predominantly selling) volumes at a typically illiquid part of the trading day. There were also sales of sterling by some market participants seeking to limit the risk associated with their positions in options markets, and to execute client orders in response to the initial fall in the exchange rate.
One important outstanding question is the degree to which the change in price witnessed during the episode was in line with the imbalance between observed orders to buy and sell.
We’d expected an imbalance in order flow during an episode like this to increase the change in price that results from a trade (or trades) of a given size. An imbalance in orders might be interpreted as indicating that some market participants were party to superior, or more up-to-date, information. This might, in turn, widen the spread at which other participants were willing to buy/sell sterling.
To assess this empirically, we develop an estimate of the change in price that is likely to result from an imbalance in orders in foreign exchange markets. This is based on previous literature. It is robust to the possibility that a large order might be split up into a series of smaller orders. This is important, because such splitting of large orders is common in foreign exchange markets, because, by transacting in smaller size, market participants can obtain a better price.
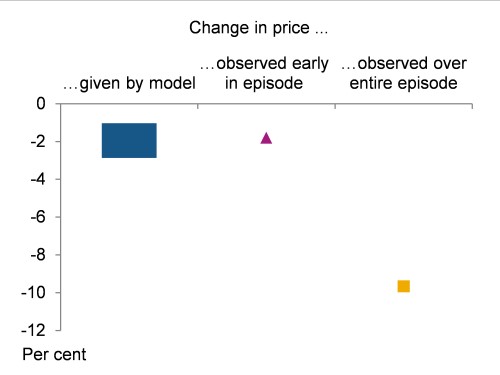
The blue bar in Chart 2 shows the range of estimates of change in price given by this model, when calibrated to past movements in the sterling dollar exchange rate. These imply that the observed orders to sell sterling during the flash episode are consistent with a decrease in the sterling-US dollar exchange rate of between 1.03% and 2.87%, depending on the precise choice of parameters.
Chart 2: The (in)consistency between observed changes in price and those expected given observed orders to buy/sell sterling
The dots in the right-hand columns compare these estimates with the observed decline in the exchange rate. The purple triangle shows that which took place early in the episode, between 00:07:00 and 00:07:15 (roughly step (2), above). The yellow square shows the peak-to-trough fall in sterling over the entirety of the episode.
From this we can see:
- The initial fall in sterling, during the early part of the episode, of 1.8%, is consistent with the range of estimates based on the observed imbalance of orders. This suggests that the movement in price was consistent with the arrival of a large order to sell sterling.
- But the larger change in price that occurred between 00:07:00 to 00:07:17 cannot be explained by expected price impact of trades alone.
Was there another factor at play?
That the overall fall in sterling so vastly exceeds that predicted by our model might suggest that some some other driver might have been at play.
The report by the BIS suggests a number of other factors that might have played a role in reducing available liquidity during the episode. These include the temporary withdrawal of some market participants from their role as market makers. This dynamic may have, in part, reflected the presence of staff with lower risk limits and appetite at some institutions at that time of day. An automatic pause in trading in sterling futures contracts may also have led to a reduction of liquidity in the cash market, because some market makers are thought to rely on futures as a guide to the price at which they offer to buy/sell currency in cash markets. It is, however, difficult to know what weight to place on these different explanations.
All else equal, such a reduction in liquidity would have increased the resulting fall in price beyond that estimated to be in line with observed trading volume.
Conclusion
The events of 7 October 2016 represented one of a series of flash events occurring in electronically traded markets. No such events have, as yet, had longer lasting consequences for market functioning or stability.
Nonetheless, policymakers have recently pointed to the clear onus on central banks and the regulatory community to understand developments in these markets, and how they behave during periods of stress.
This work represents one step in that effort.
Bank Underground is a blog for Bank of England staff to share views that challenge – or support – prevailing policy orthodoxies. The views expressed here are those of the authors, and are not necessarily those of the Bank of England, or its policy committees


