From The St. Louis Fed On The Economy Blog.
The U.S. economy is currently experiencing a prolonged productivity slowdown, comparable to another slowdown during in the 1970s.
Economists have debated the causes for these slowdowns: The reasons range from the 1970s oil price shock to the 2007-08 financial crisis.
But did the baby boom generation partly cause both periods of slowing productivity growth?
A Demographic Shift
Guillaume Vandenbroucke, an economist at the St. Louis Fed, explored the role of the baby boom generation—specifically, those born in the period of 1946 to 1957 when the birth rate increased by 20 percent—in these slowdowns.
In a recent article in the Regional Economist, he pointed out a demographic shift: Many baby boomers began entering the labor market as young, inexperienced workers during the 1970s, and now they’ve begun retiring after becoming skilled, experienced workers.
“This hypothesis is not to say that the baby boom was entirely responsible for these two episodes of low productivity growth,” the author wrote. “Rather, it is to point out the mechanism through which the baby boom contributed to both.”
Productivity 101
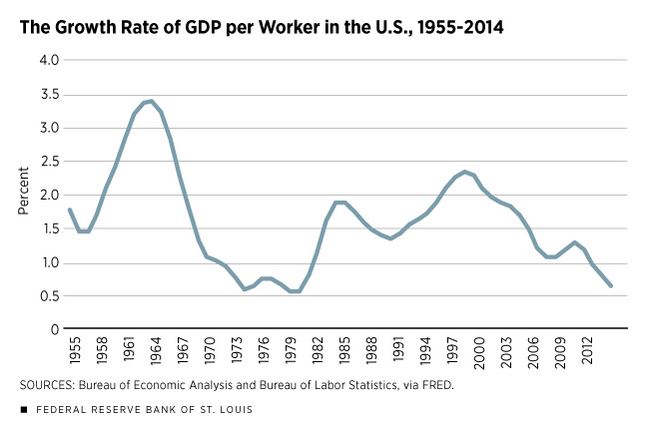
One measure of productivity is labor productivity, which can be measured as gross domestic product (GDP) per worker. By this measure, the growth of labor productivity was low in the 1970s. Between 1980 and 2000, this growth accelerated, but then has slowed since 2000.
“It is interesting to note that the current state of low labor productivity growth is comparable to that of the 1970s and that it results from a decline that started before the 2007 recession,” Vandenbroucke wrote.
How does a worker’s age affect an individual’s productivity? According to economic theory, young workers have relatively low human capital; as they grow older, they accumulate human capital, Vandenbroucke wrote.
“Human capital is what makes a worker productive: The more human capital, the more output a worker produces in a day’s work,” the author wrote.
The Demographic Link
Vandenbroucke gave an example of how this simple idea could affect overall productivity. His example looked at a world in which there are only young and old workers. Each young worker produces one unit of a good, while the older worker—who has more human capital—can produce two goods. If there were 50 young workers and 50 old workers in this simple economy, the total number of goods produced would be by 150, which gives labor productivity of 1.5 goods per worker.
Now, suppose the demographics changed, with this economy having 75 young workers and 25 old workers. Overall output would be only 125 goods. Therefore, labor productivity would be 1.25.
“Thus, the increased proportion of young workers reduces labor productivity as we measure it via output per worker,” he wrote. “The mechanism just described is exactly how the baby boom may have affected the growth rate of U.S. labor productivity.”
The Link between Boomers and Productivity Growth
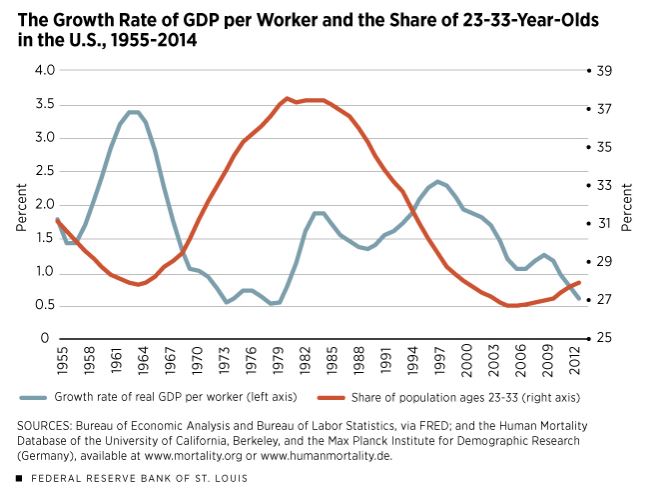
Vandenbroucke then compared the growth rate of GDP per worker (labor productivity) with the share of the population 23 to 33 years old, which he used as a proxy for young workers.
This measure of young workers began steadily increasing in the late 1960s before peaking circa 1980, which represented the time when baby boomers entered the labor force.
Looking at these variables from 1955 to 2014, he found the two lines move mostly in opposite directions (the share of young people growing as labor productivity growth declined) except in the 2000s.
(To see these trends, see the Regional Economist article, “Boomers Have Played a Role in Changes in Productivity.”)
“The correlation between the two lines is, indeed, –37 percent,” Vandenbroucke wrote.1
The share of the population who were 23 to 33 years old began to increase in the late 2000s, which can be viewed as the result of baby boomers retiring and making the working-age population younger.
“This trend is noticeably less pronounced, however, during the 2000s than it was during the 1970s,” the author wrote. “Thus, the mechanism discussed here is likely to be a stronger contributor to the 1970s slowdown than to the current one.”
Conclusion
If this theory is correct, it may be that the productivity of individual workers did not change at all during the 1970s, but that the change in the composition of the workforce caused the productivity slowdown, he wrote.
“In a way, therefore, there is nothing to be fixed via government programs,” Vandenbroucke wrote. “Productivity slows down because of the changing composition of the labor force, and that results from births that took place at least 20 years before.”
Notes and References
1 A correlation of 100 percent means a perfect positive relationship, zero percent means no relationship and -100 percent means a perfect negative relationship.


