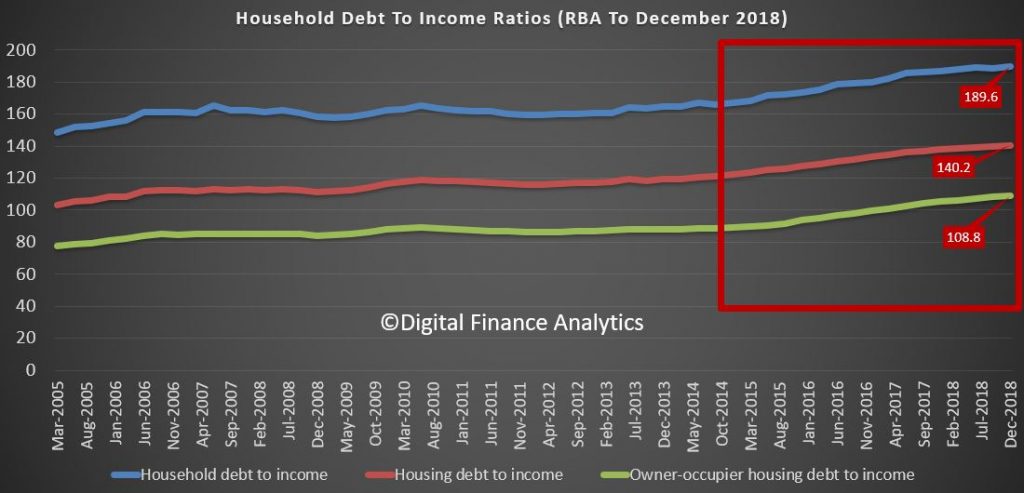
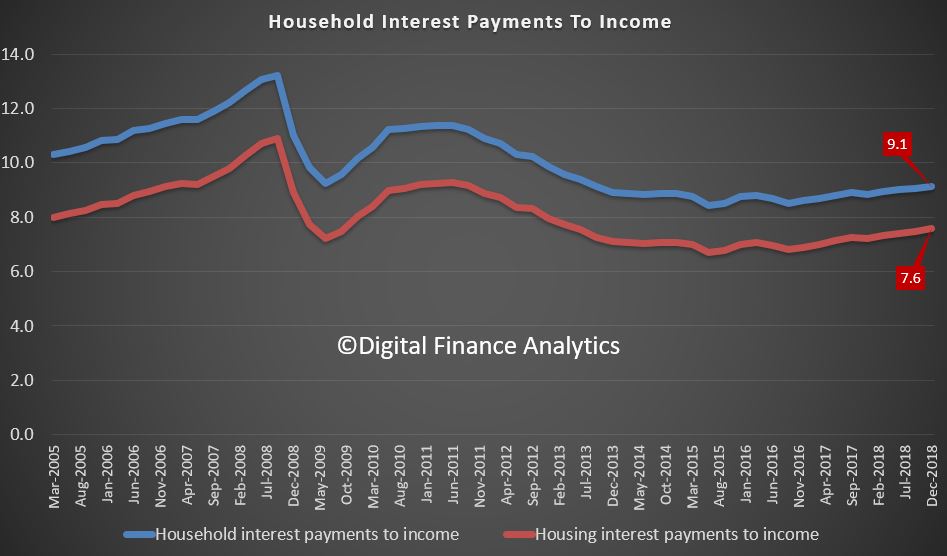
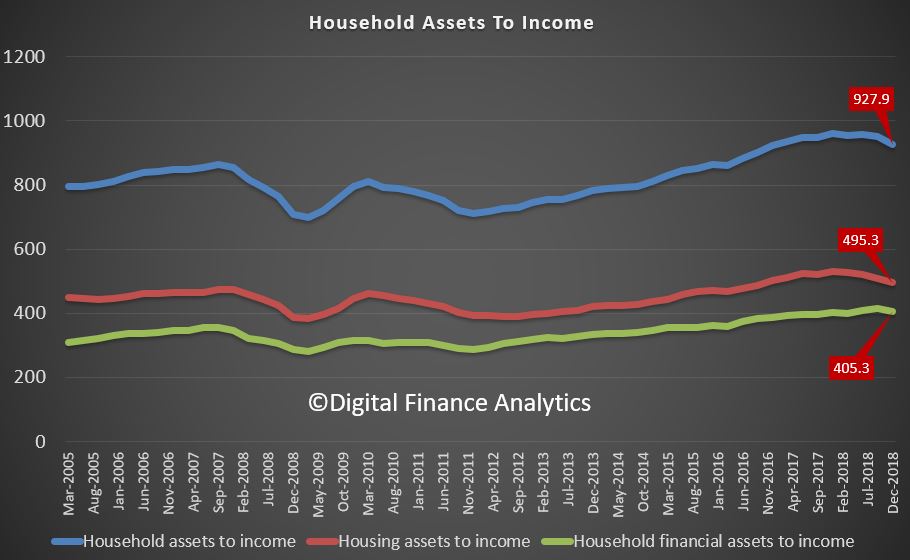
In the latest RBA data series (E2) we get an update on household debt to income and debt to asset ratios, and they are ALL moving in the wrong direction. This is to December 2018.
The household debt to income moved higher to a new record of 189.6, and housing debt to income to a new record of 140.2.
The change in trajectory from 2014/5 is significant, as lending standards were weakened, and interest rates cut (forcing home prices higher).

The interest payments to income also rose, thanks to bigger mortgages, slightly higher interest rates, and little income growth.

But in contrast, the asset values are falling, so the asset to income ratios are falling. Housing assets in particular are dropping.

All pointing to a higher burden of debt on households. And remember only one third, or there about, have a mortgage, so in fact the TRUE ratios are much much worst. But the trends do not lie in relative terms, and by the way these are extended ratios compared with most western economies. We are drowning in rivers of debt!
