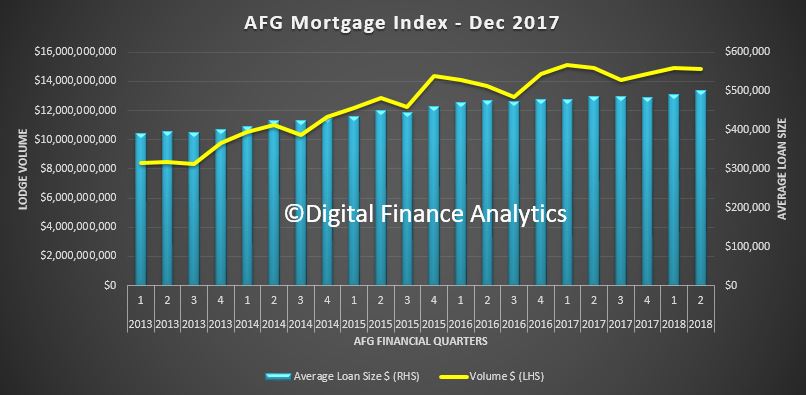
The latest AFG Mortgage Index just released, to December 2017, really highlights some of the transitions underway in the industry. While the view is myopic ( as its only their data) it is useful.
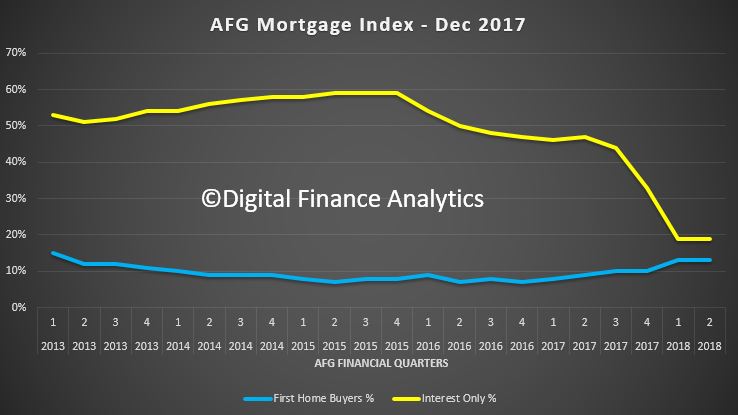
First, there has been an astonishing drop in the number of interest only loans being written, from 60% of volume in 2015, to 20% now – WOW! We also see a small rise in first time buyer volumes, as expected. So the regulatory intervention is having some impact.
 But, the second chart shows the volume of lodgements rising but the average loans size rising (faster than income and inflation). Victoria stands out as the state to watch with an increase in average loan size over the past 12 months nearly double the size of the increase in New South Wales. So more still needs to be done on the regulatory front.
The share of the majors banks is falling, as we have seen from other data, as smaller players and non-banks pick up the slack.
As the year drew to a close, Victoria stands out as the state to watch with an increase in average loan size over the past 12 months nearly double the size of the increase in New South Wales.
“There has been a lot of focus on Sydney house prices, and therefore mortgage sizes, but homebuyers in Victoria are seeing the biggest increases,” explained AFG CEO David Bailey. “In Victoria, the average mortgage size has jumped 3.2% in the final quarter of 2017 to now be sitting at $496,815.”
The increase in the last 12 months for Victoria was $20,385 compared to $10,662 for NSW. With the average NSW mortgage already substantially higher than in Victoria, the increase over the last 12 months was 4.3% for Victorians compared to 1.8% for those buyers in NSW.
“The average loan size in New South Wales is now $613,084. Queensland has increased by 3.4% to now be sitting at $416,921. South Australia is up 3.4% to $390,706. The Northern Territory is up 22% to $469,502, albeit from a low volume. Reflecting the challenges being encountered by the WA economy, the state’s average loan size is down 1.1% to $439,944.
Overall, the national average loan size is up 2.8% over the past 12 months.
“Fixed rate products have dropped back to 21.9% of the market after a high of 26.5% last quarter and First Home Buyers are sitting steady at 13% for the second consecutive quarter.
“What is noticeable is that the majors are continuing to lose ground to the non-majors, as borrowers increasingly look at alternatives to the major bank owned brands. The majors have 64.2% of the market compared to the non-majors sitting at 35.8%,” said Mr Bailey.
“Whilst tightened lending criteria continues to impact the market, particularly with respect to refinancers, our overall volumes compared to prior year remain strong. Refinancers now represent just 22% of the market. Investors have also been caught in the cross-hairs and have dropped to 28%.”

As they turn away from Investors, the majors are proving competitive for First Home Buyers (69.6%). Overall, Upgraders are proving attractive to lenders and now represent 44% of the market.
“Interest rate and lending policy changes have meant many clients are turning to their mortgage broker for help to understand what the changes may mean for them,” said Mr Bailey.
“Individual circumstances are assessed differently by lenders, so having the insight into which lender may be the right fit for your needs is vital to a consumer looking for finance. A mortgage broker is uniquely placed to have that information.

