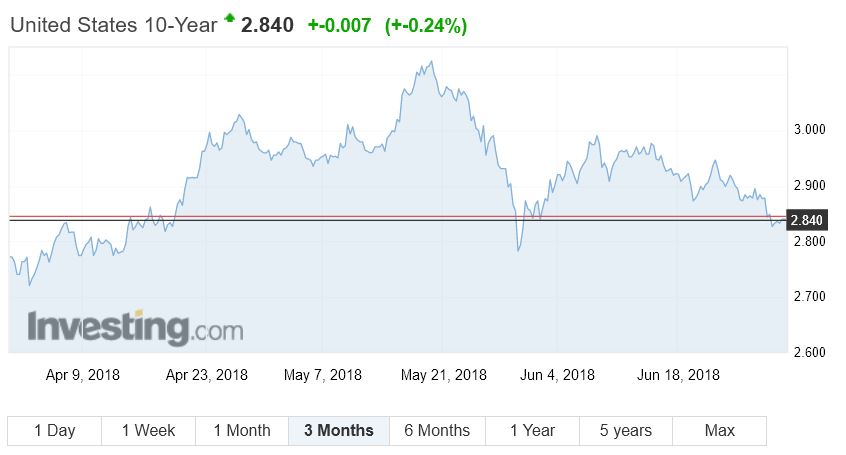
As the spot light turns to the emerging trade wars with the USA, the impact may be to push bond rates lower, according to Moody’s. As a result, this may also mean the FED will not raise interest rates in the US as fast as expected. This might therefore in turn act to dampen rate rises in other countries.
A still-positive outlook for operating profits is now marred by considerable uncertainty. What may degenerate into an extended trade war of attrition could preserve financial market volatility indefinitely.
Given the global complexities of modern supply-chain management, a surprisingly large number of U.S.-based businesses may delay capital spending and staffing plans until trade-related uncertainties are sufficiently resolved. As it now stands, tariff-driven increases in material costs have compelled some companies to rein in employee compensation for the purpose of protecting profit margins. In addition, higher materials costs have been weighing on the credit quality of some manufacturers that use steel intensively.
Tariffs explain why year-to-date advances of 40% for the spot price of steel and 21% for the most actively traded lumber futures contract are so much greater than the accompanying 0.5% dip by Moody’s industrial metals price index (which excludes steel’s price). To the degree tariffs increase the costs of materials and inventories, businesses will tighten their control of other costs, the most prominent being employee compensation.
Relaxation of China’s Monetary Policy May Limit Upside for Fed Funds
Any trade war will require the use of all policy weapons. Recently, the Peoples Bank of China adopted a more accommodative monetary policy ostensibly in response to slower than expected domestic spending and a need to enhance systemic liquidity. The latter brings attention to difficulties arising from troubled loans. Though not specifically mentioned, one of the intentions of the latest relaxation of China’s monetary policy is to allow China to better withstand any loss of economic activity to a trade war.
Not to be overlooked is how the $521 billion of U.S. merchandise imports from China during the 12-months-ended April 2018 far exceeded the comparably measured $133 billion of U.S. merchandise exports to China.
Worth mentioning is how that imbalance includes billions of dollars of goods that are manufactured in China for U.S.-domiciled businesses. China is unrivaled as far as being a manufacturing platform for companies based in advanced economies. Thus, many American businesses and shareholders are vulnerable to tariffs imposed on imports from China.
In quick response to the relaxation of China’s monetary policy, the U.S. dollar rose to 6.604 yuan. Though the latter was the highest yuan price of the dollar since mid-December 2017, it was still -4.7% under December 2016’s average of 6.929 yuan. Of course, Chinese officials worry that expectations of a weaker yuan might prompt unwanted capital outflows from China.
Nevertheless, a wider interest rate gap between the U.S. and China would favor a cheaper Chinese currency versus the dollar. In turn, a depreciation by China’s currency vis-a-vis the dollar would offset part of any tariff-induced increase in the dollar price of U.S. imports from China.
All else the same, a costlier dollar exchange rate diminishes prospects for U.S. corporate earnings. The recent strengthening of the dollar against a broad array of currencies from both advanced economies and emerging market countries will reduce (i) the global price competitiveness of goods and services produced in the U.S. and (ii) the dollar value of foreign-currency denominated earnings from abroad.
On the positive side, a stronger dollar will lessen the risk of faster consumer price inflation. As a result, a stronger dollar can substitute for Fed rate hikes.
Ten-year Treasury Yield Is Less Likely to Have an Extended Stay Above 3%
In view of how recent rate hikes and a nearly 3% 10-year Treasury yield disrupted financial markets outside the U.S., the Federal Open Market Committee’s latest median projection of a 2.375% midpoint for fed funds by the end of 2018 may prove to be too high.
Recognizing the risks implicit to a possible trade war and the disinflationary effect of further dollar exchange rate appreciation, the futures market disputes the FOMC’s median projection for fed funds and recently assigned only a 44.2% probability to a year-end midpoint for fed funds that exceeds 2.125%. If other central banks pursue policies that facilitate dollar appreciation, the Fed may have no choice but to stretch out its planned normalization of U.S. monetary policy.
Just prior to the latest outbreak of trade-related stress, the 10-year Treasury yield closed at June 14’s 2.94%. Since then, the benchmark Treasury yield eased to a recent 2.83%. From the perspective of the accompanying 3.0% drop by the market value of U.S. common stock since June 14, the decline by the 10-year Treasury yield has not been especially deep.Nevertheless, a downwardly revised outlook for Treasury yields has prompted a 5.8% advance by the Dow Jones Utility index since June 14.
However, despite the possibility of lower than earlier expected mortgage yields, an index of housing-sector share prices has sunk by 5.1% since June 14. The latter brings attention to how trade related uncertainties and financial market volatility may force businesses to show restraint when it comes to staffing and employee compensation.
In turn, the upside for home sales may continue to be limited by the subpar financial condition of many lower- and middle-income households. The pitifully low 3.1% personal savings rate of the 12-monthsended April 2018 highlights the well below-average financial flexibility of many Americans. Implicit to such a very low average for the personal savings rate is the likelihood that 33% to 40% of U.S. households save an imperceptible, if any, amount of their after-tax income.
When a financially stronger middle class provided a hospitable breeding ground for the persistently rapid consumer price inflation of 1972-1981, the personal savings rate averaged a much higher 11.4%. Yes, consumer price inflation may spurt higher every now and then, but today’s average American consumer may lack the financial wherewithal necessary for the establishment of stubbornly rapid price inflation.
VIX and Baa Yield Spread Imply High-Yield Bond Spread Is Unsustainably Thin
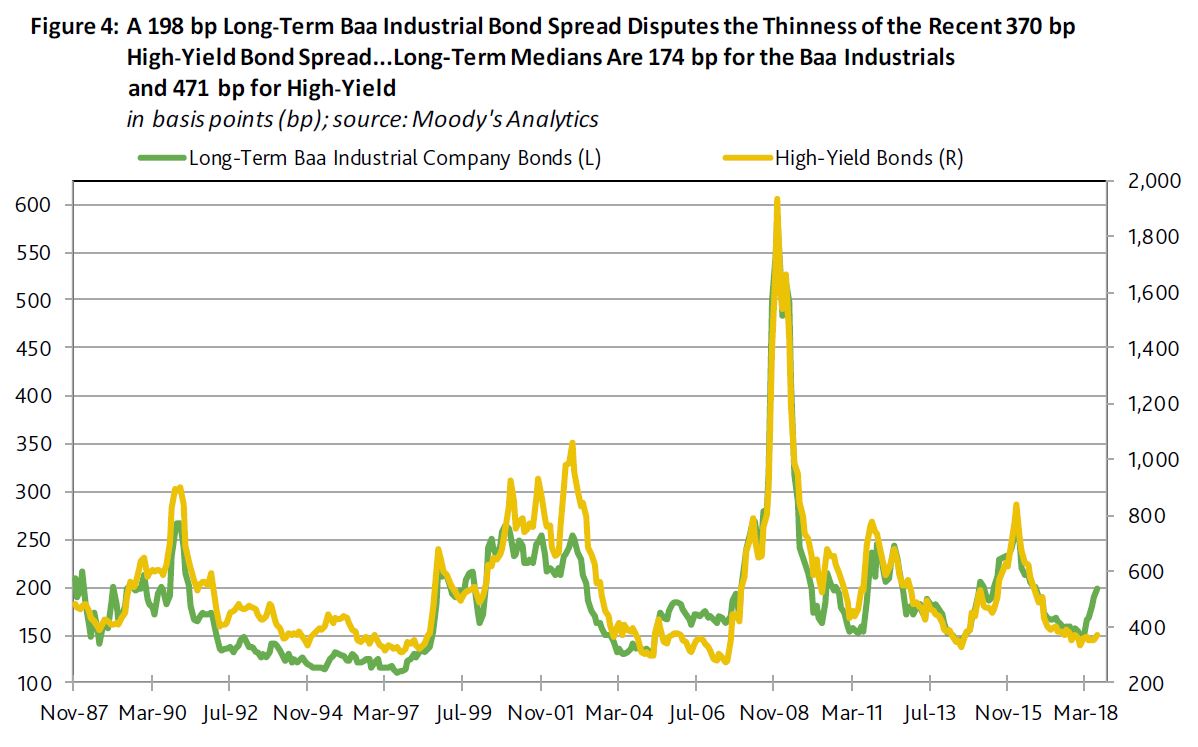
Though a composite high-yield bond spread has widened from June 14’s 345 basis points to the 370 bp of June 27, the latter still remains well under the spread’s post September 2003 median of 460 bp. However, a recent VIX of 18.0 points was noticeably above its accompanying median of 15.9 points. In the event the VIX remains above 16.5 points, the high-yield spread is likely to widen to at least 425 bp.
A recent long-term Baa-grade industrial company bond yield spread of 198 bp that well exceeds its post September 2003 median of 178 bp reinforces the negative outlook for high-yield bonds. As inferred from the historical record, a 198 bp spread for the long-term Baa industrials has typically been associated with a 544 bp midpoint for the high-yield spread, which is much wider than the recent 370 bp. It was in 2007 that a well below trend high-yield spread was joined by a significantly above average Baa yield spread.
Since late 1987, the high-yield bond spread shows a very strong correlation of 0.92 with the long-term Baa industrial company bond yield spread.


