Once again, the 10-year Treasury yield confounds the consensus. As of early April, the consensus had predicted that the benchmark 10-year Treasury would average 2.6% during 2017’s second quarter. To the contrary, the 10-year Treasury yield has averaged a much lower 2.29% thus far in the second quarter, including a recent 2.30%. Moreover, the 10-year Treasury yield has moved in a direction opposite to what otherwise might be inferred from March 14’s hiking of fed funds’ midpoint from 0.625% to 0.875%. For example, April 27’s 10-year Treasury of 2.30% was less than its 2.62% close of March 13, just prior to the latest Fed rate hike.
The latest decline by Treasury bond yields since March 14’s Fed rate hike stems from a slower than anticipated pace for business activity that has helped to rein in inflation expectations. March’s unexpectedly small addition of 98,000 workers to payrolls increases the risk of lower than expected household expenditures that could bring a quick end to the ongoing series of Fed rate hikes.
As inferred from the CME Group’s FedWatch tool, the fed funds futures contract assigns a negligible 4.3% probability to a Fed rate hike at the May 3 meeting of the FOMC. However, the likelihood of a rate hike soars to 70.6% at June 14’s FOMC meeting. Thus, do not be surprised if the policy statement of May 3’s FOMC meeting strongly hints of a June rate hike. Nevertheless, a June rate hike probably requires the return of at least 140,000 new jobs per month, on average, for April and May.
Unlike the Treasury bond market’s more sober view of business prospects since the March 14 rate hike, equities have rallied and the high-yield bond spread has narrowed. Incredibly, the VIX index sank to 10.6 on April 27, which was less than each of its prior month-long averages. The closest was the 10.8 of November 2006, or when the high-yield bond spread averaged 330 bp. Thus, if the VIX index does not climb higher over the next several weeks, the high-yield bond spread is likely to narrow from an already thin 385 bp.
Market value of common stock nears record percent of revenues
As equity market overvaluation heightens the risk of a deep drop by share prices, Treasury bonds become a more attractive insurance policy in case the equity bubble bursts. This is especially true if the next harsh equity-market correction is triggered by a contraction of profits, as opposed to an inflation-inspired jump by interest rates.
Equities are now very richly priced relative to corporate gross-value-added, where the latter aggregates the value of the final goods and services produced by corporations. Basically, gross value added nets out the value of the intermediate materials and services from which final products are produced.
The market value of US common stock now approximates 226% of the estimated gross value added of US corporations, where the latter is a proxy for corporate revenues. During the previous cycle, the ratio peaked at the 185% of Q2-2007 and then bottomed at the 103% of Q1-2009. The ratio is now the highest since the 231% of Q1-2000. Not only was the latter a record high, but it also coincided with a cycle peak for the market value of US common stock.
All else the same, the fair value of equities should decline as bond yields increase. Thus, the overvaluation implicit to Q1-2000’s atypically high ratio of the market value of common stock to corporate gross value added was compounded by Q1-2000’s relatively steep long-term Baa industrial company bond yield of 8.28%. Even if the market value of US common stock now matched Q1-2000’s 231% of corporate gross value added, Q1-2000’s equity market appears to be much more overvalued largely because the April 26, 2017 long-term Baa industrial company bond yield of 4.65% was well under the 8.28% of Q1-2000. (Figure 1.)
Consensus implicitly foresees record-long business upturn
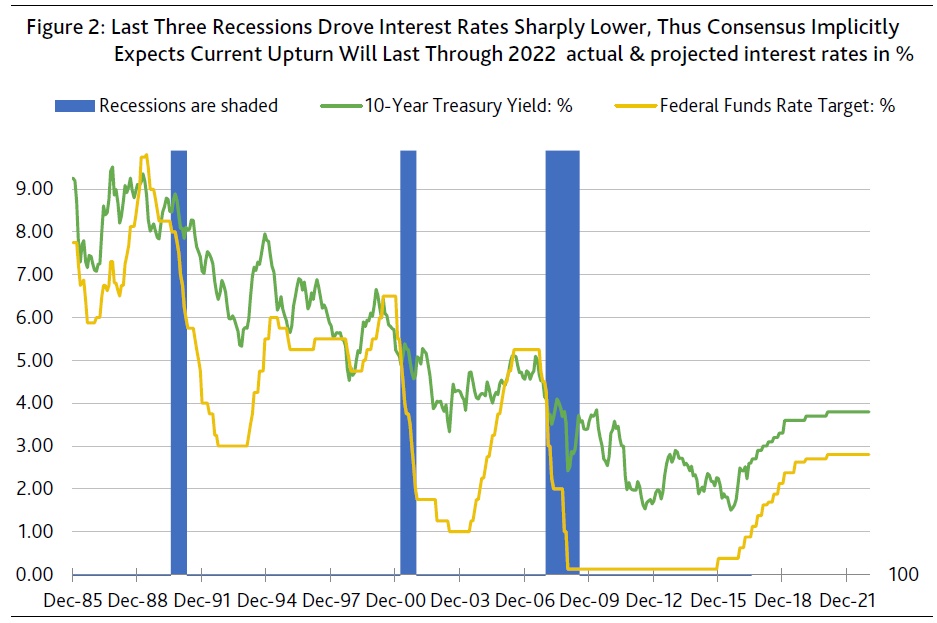
Be it the Blue Chip or the Bloomberg survey, the consensus long-term outlook for interest rates suggests a great deal of confidence in the longevity of the current business cycle upturn. April’s consensus projects a steady climb by fed funds and the 10-year Treasury yield into 2021, by which time the forecast looks for yearlong averages of 2.88% for the fed funds’ midpoint and 3.6% for the 10-year Treasury yield.
Thus, the consensus implicitly expects that the current economic recovery (which is about to finish its eighth year in July 2017) will reach an exceptional 12th year in 2021. The implied expectation of a record long business cycle upturn is derived from the observation that each previous recession since 1979 has prompted significant declines by both fed funds and the 10-year Treasury yield. The absence of any predicted drop by the 10-year Treasury yield’s yearlong average between now and the end of 2022 is tantamount to forecasting an economic recovery of record length. (Figure 2.)
The current record-holder among economic recoveries is the upturn of April 1991 through February 2001 that lasted about 9.75 years. In a distant second place is the upturn of December 1982 through June 1990 that covered roughly 7.5 years. If the consensus proves correct about the duration of the ongoing upturn, a seemingly overvalued equity market is far from exhausting its upside potential.
Long-term outlook on profits requires low long-term bond yields
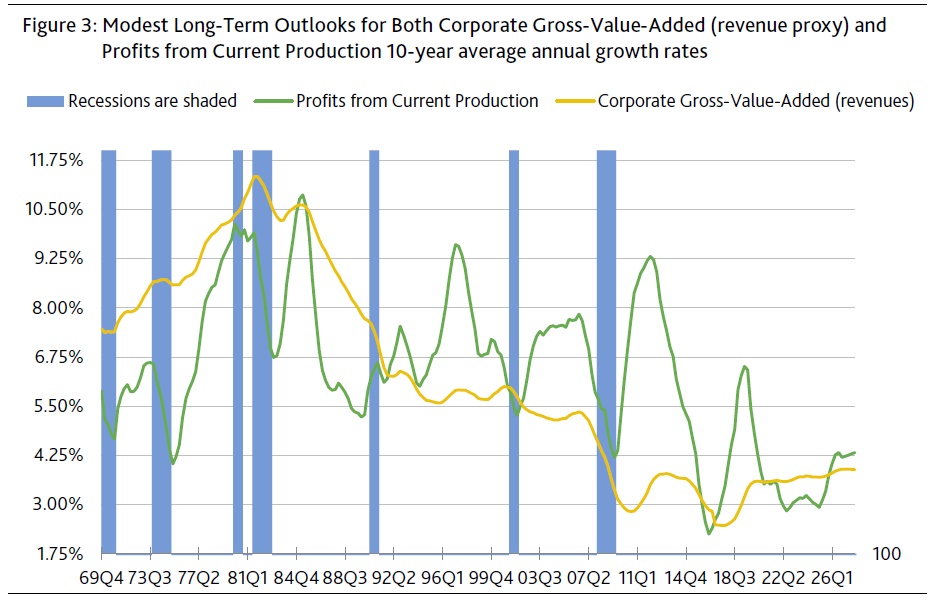
The consensus also maintains positive views on the near- and long-term outlook for pretax profits from current production. April’s Blue Chip consensus not only expects pretax operating profits to grow by 4.9% in 2017 and by 4.2% in 2018, but March’s long-term outlook projected profits growth in each of the five-years-ended 2023 of 4.0% annually, on average. The realization of seven consecutive years of profits growth requires the avoidance of a possibly disruptive climb by interest rates. Thus, the 10-year Treasury might well have difficulty spending much time above 3%, if, as expected, corporate gross value added’s average annual growth rate is less than 4%. (Figure 3.)


