Westpac has released their 2018 full year results. They had already signalled customer remediation costs, and its impact on profitability, but their net interest margin was significantly lower in the second half, and 90+ mortgage delinquency continued to rise in Australia. Total provisions were lower. Capital ratio though are in good shape. The proportion of IO loans is falling, and they expect more home price easing.
CEO Harzter said ““We expect house prices to cool further, and investor demand to remain weak. On the other hand, demand from first home buyers is holding up. These dynamics are likely to lead to housing credit growth easing to 4% next year, with total credit growth of 3.5%. With around 70% of Australian customers ahead on their repayments and delinquencies low, credit risks in the housing market currently remain low”.
However, their disclosed stress tests suggest in a severe downturn cumulative total losses could be $3.9bn over three years.
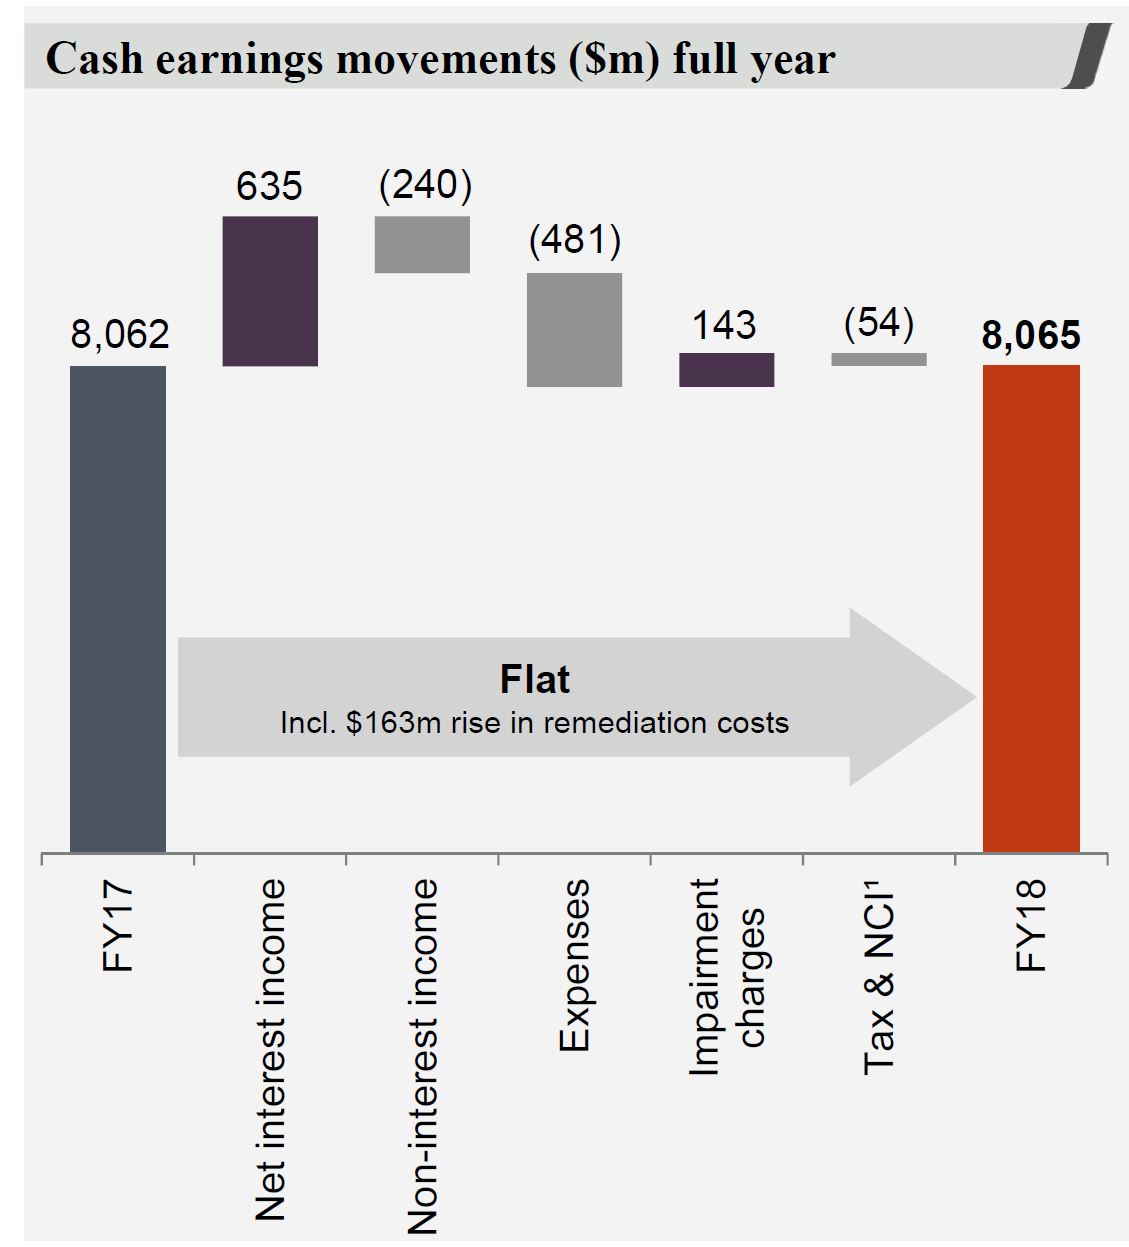
 Cash earnings were $8,065 million, little changed on last year. Cash earnings per share, 236.2 cents, down 1% and the cash return on equity (ROE) was 13.0%, at the lower end of the range Westpac is seeking to achieve. The final, fully franked dividend was unchanged, of 94 cents per share (cps), so the full year, fully franked dividend of 188 cps. Statutory net profit was $8,095 million, up 1%.
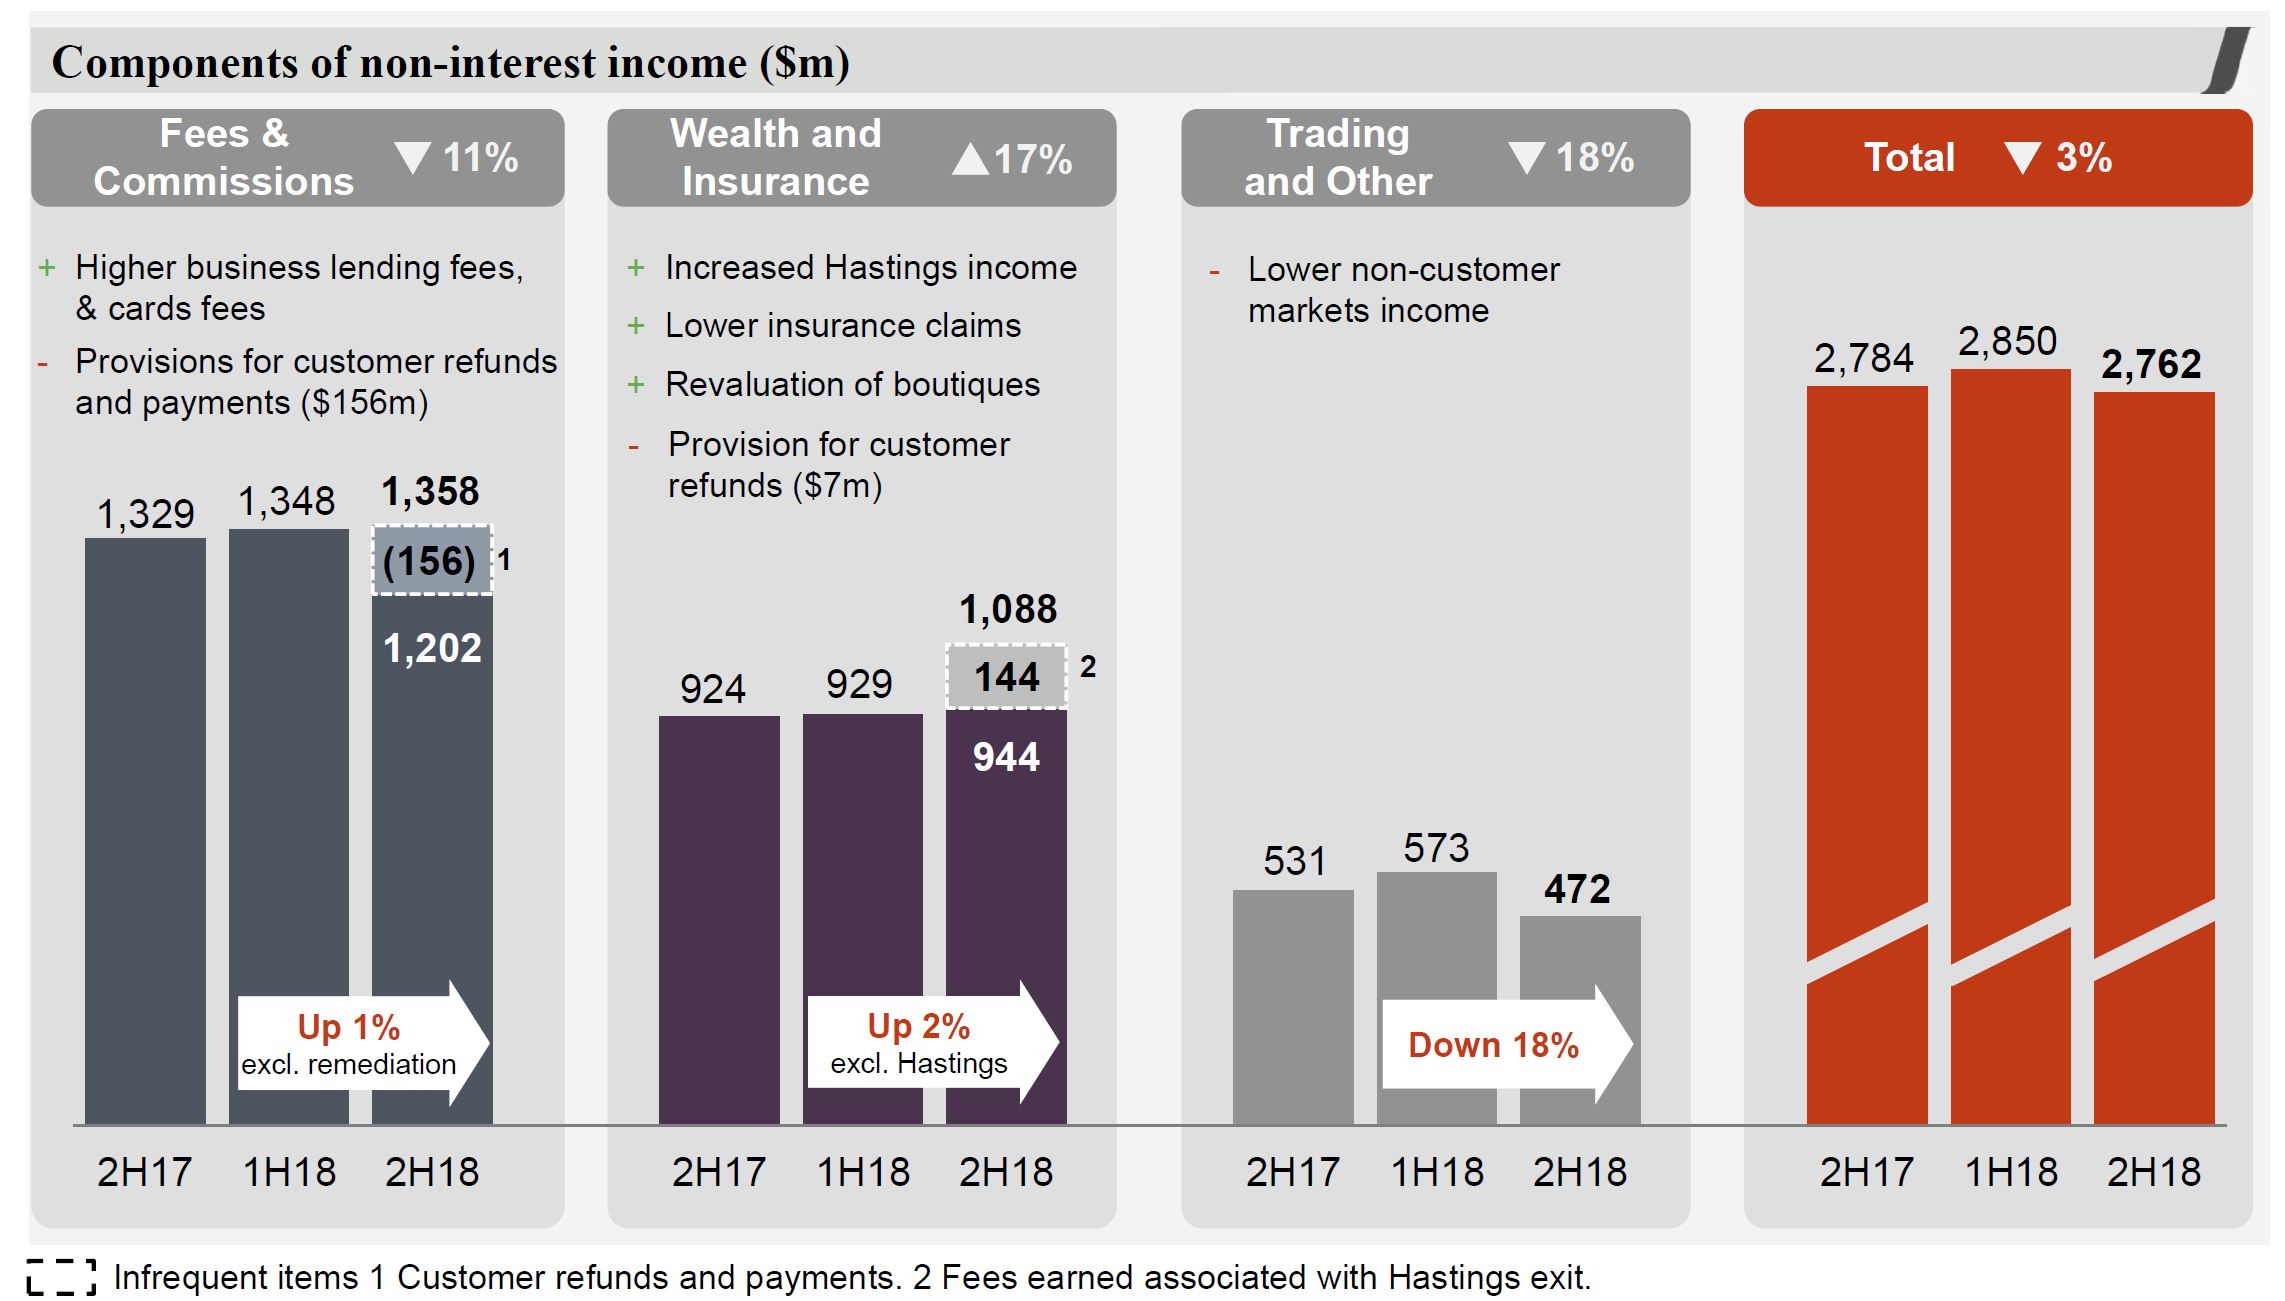
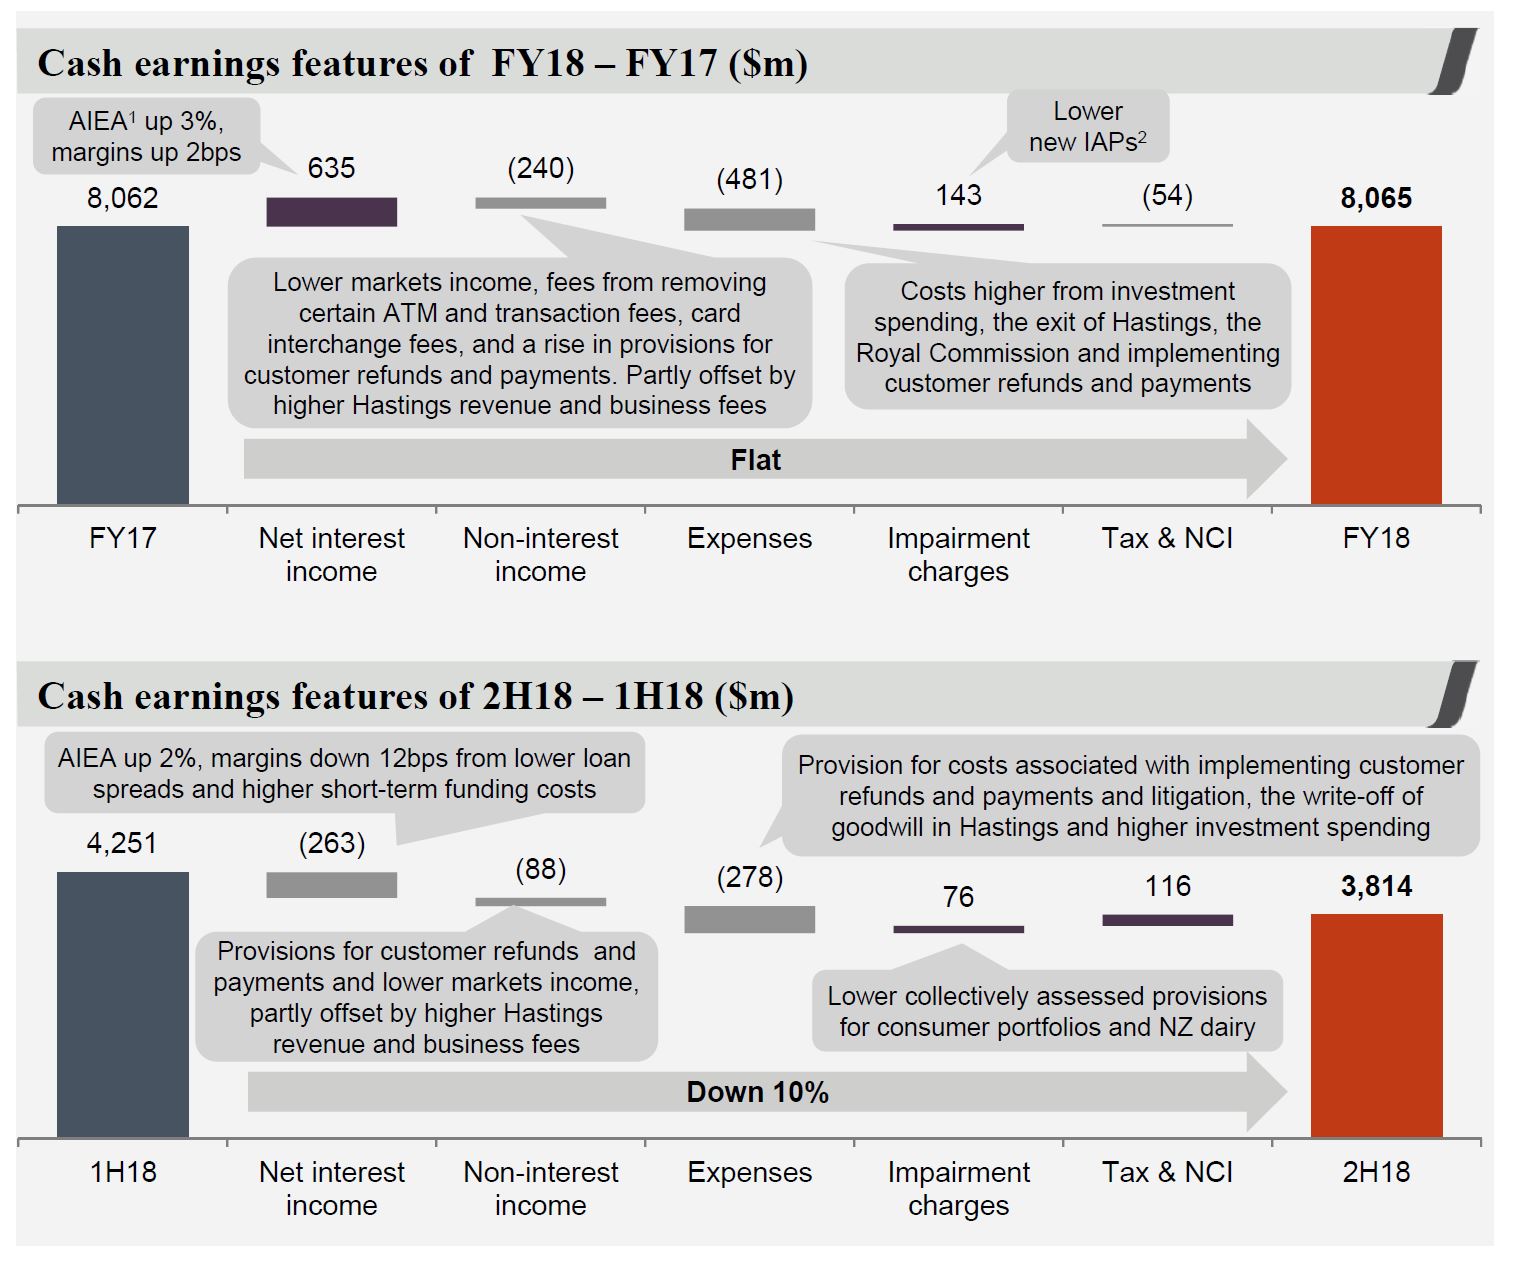 The cash earnings included $163 million in remediation charges, and a fall of $240 million in non-interest income, a a reduction in impairment charges.
 There was a fall of $263 million in the second half in net interest income. and a 10% reduction in earnings, with remediation costs of $430 million.
 Income was down 3% over the half, thanks to margin decline and customer remediation.
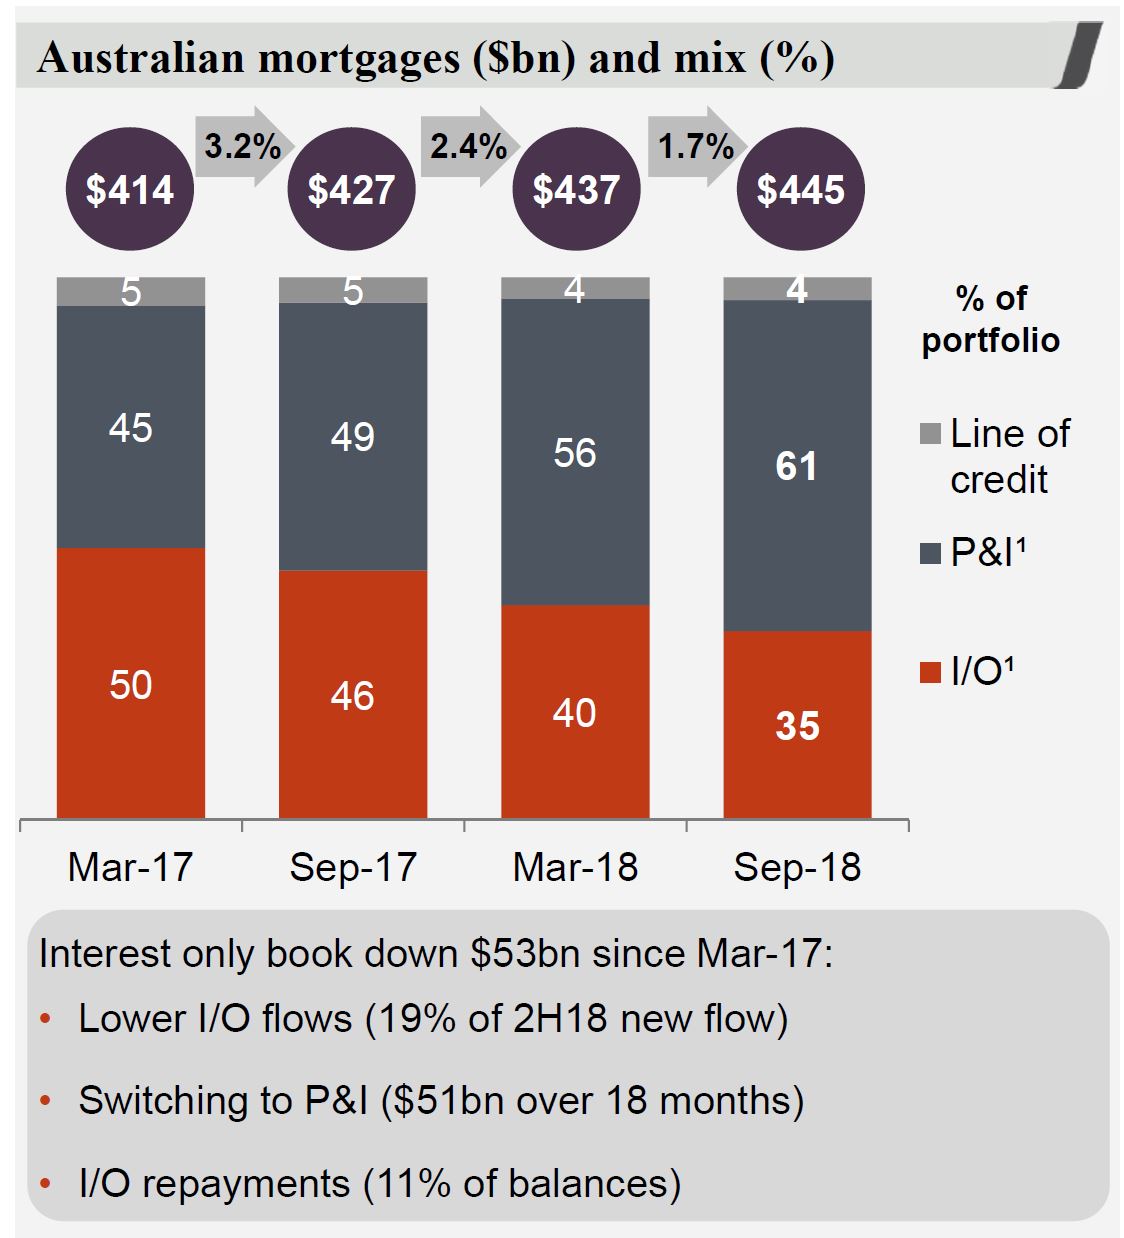
They highlight that Australian mortgage growth is moderating and interest only loans are down $53 billion since March 2017.
 Margins in the second half were down from 2.05 to 1.95, or 10 basis points in the main banks, and from 0.12 to 0.10 in the Treasury and Markets. 5 basis points related to wholesale funding, and 4 basis points loans, offset by 1 basis point from deposits.
 Non interest income fell and included provisions for customer refunds of $156 million and lower trading income, which was down 18% in the second half.
 Expenses were higher thanks to regulation and compliance, remediation and platform investments.
 FTE were down by around 700 from the first half.
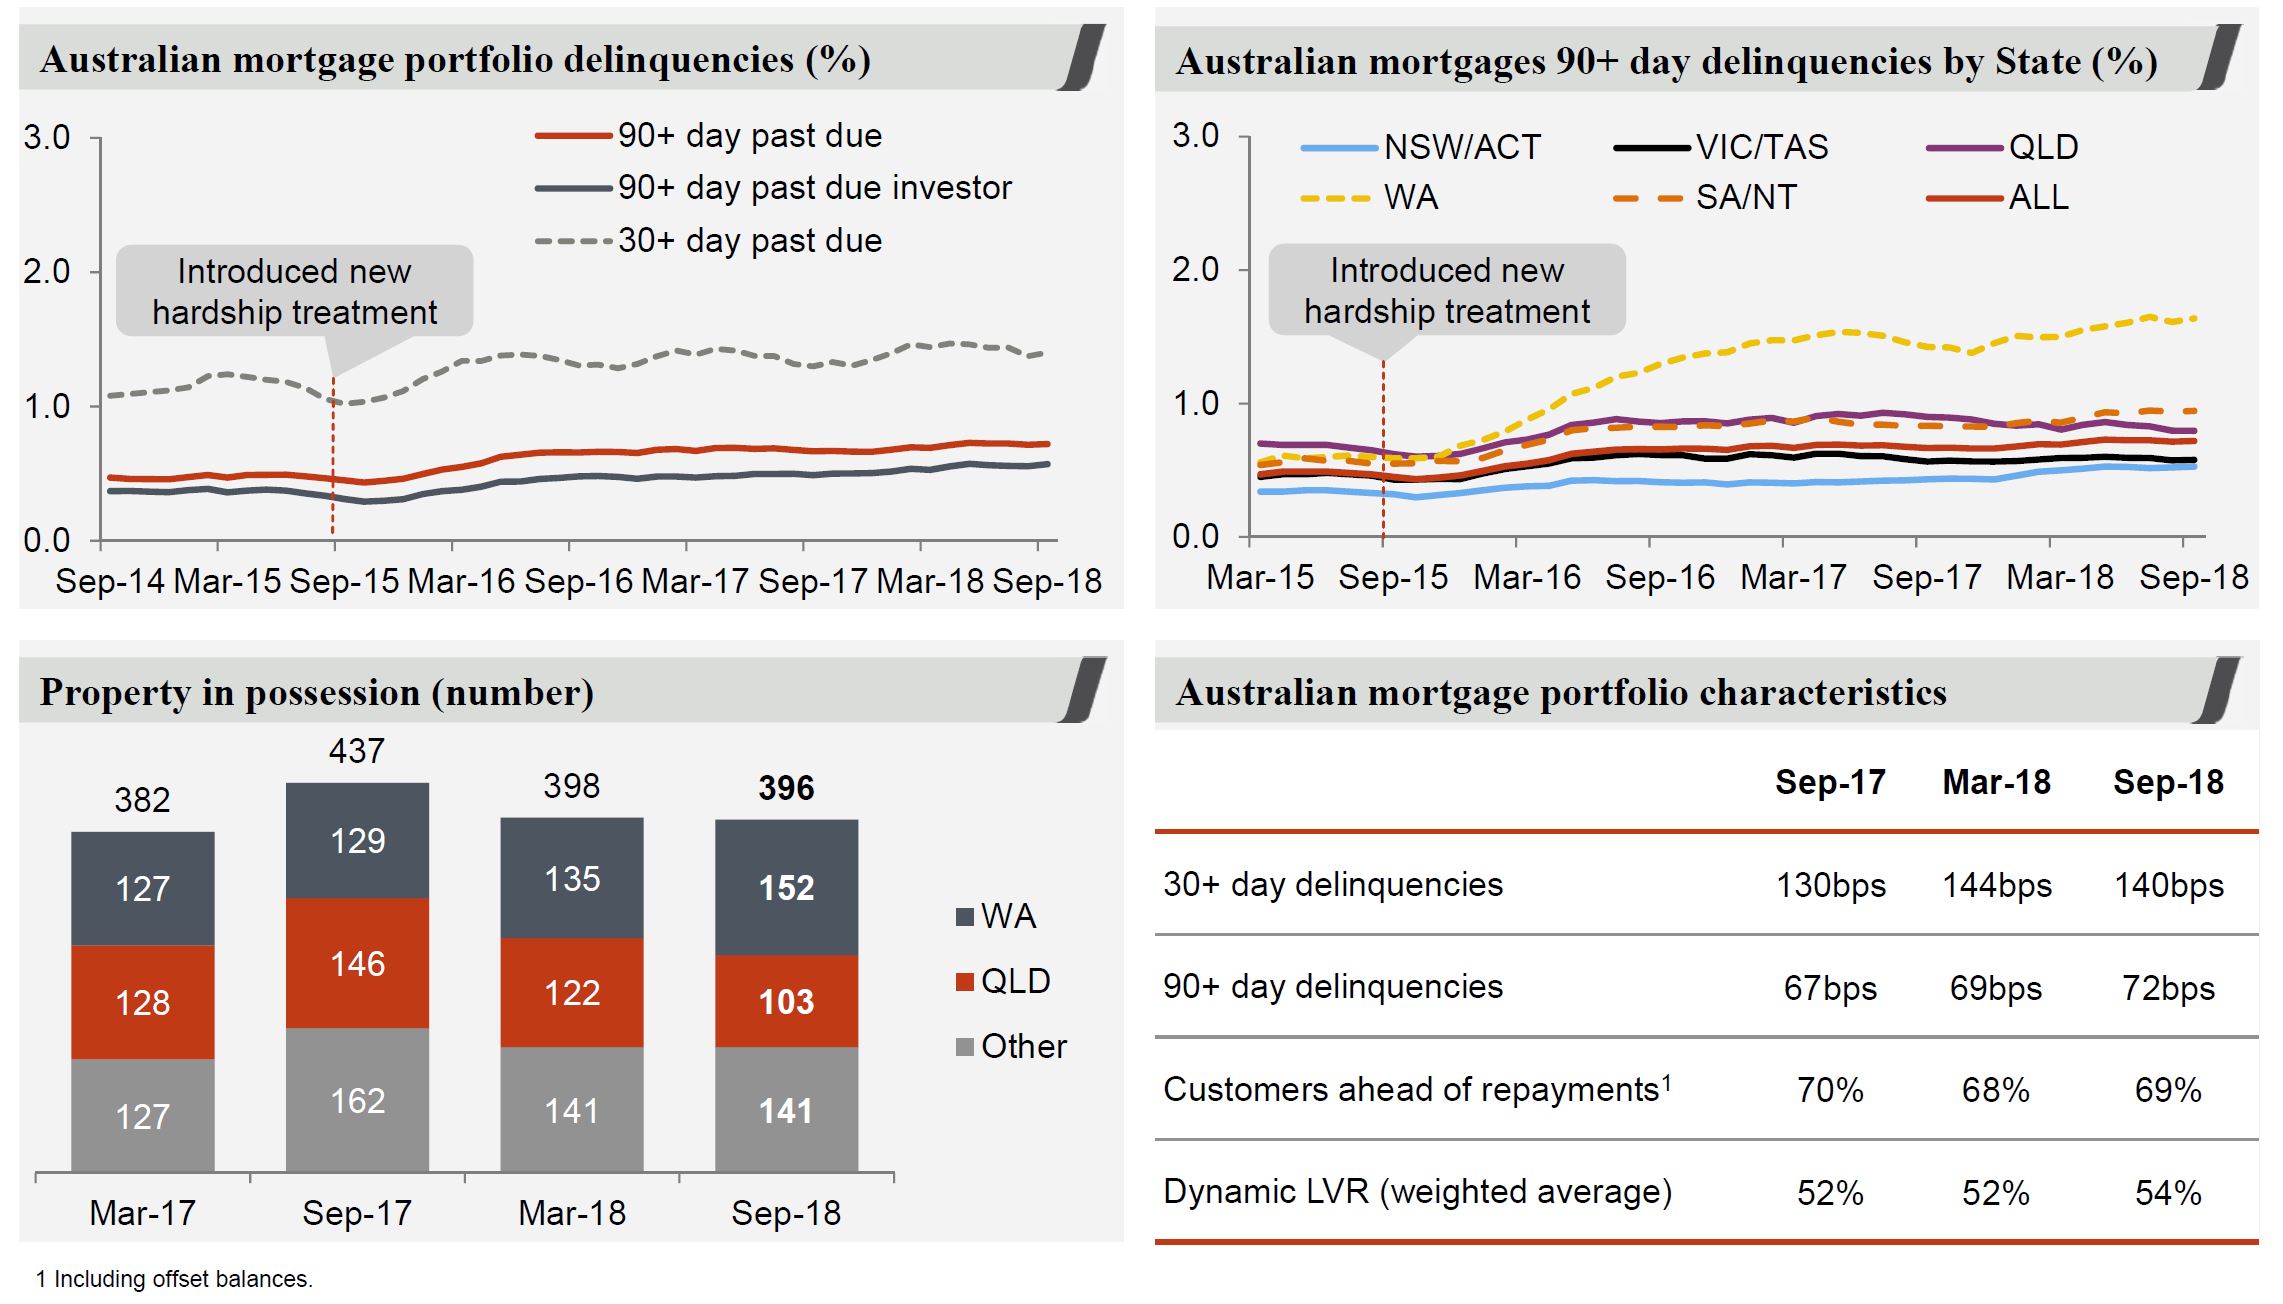
 Stressed assets as proportion of total committed exposure (TCE) was lower, despite a rise in 90 days+ past due. Australian 90 day + mortgage delinquencies rose from 69 to 72 basis points in the second half.
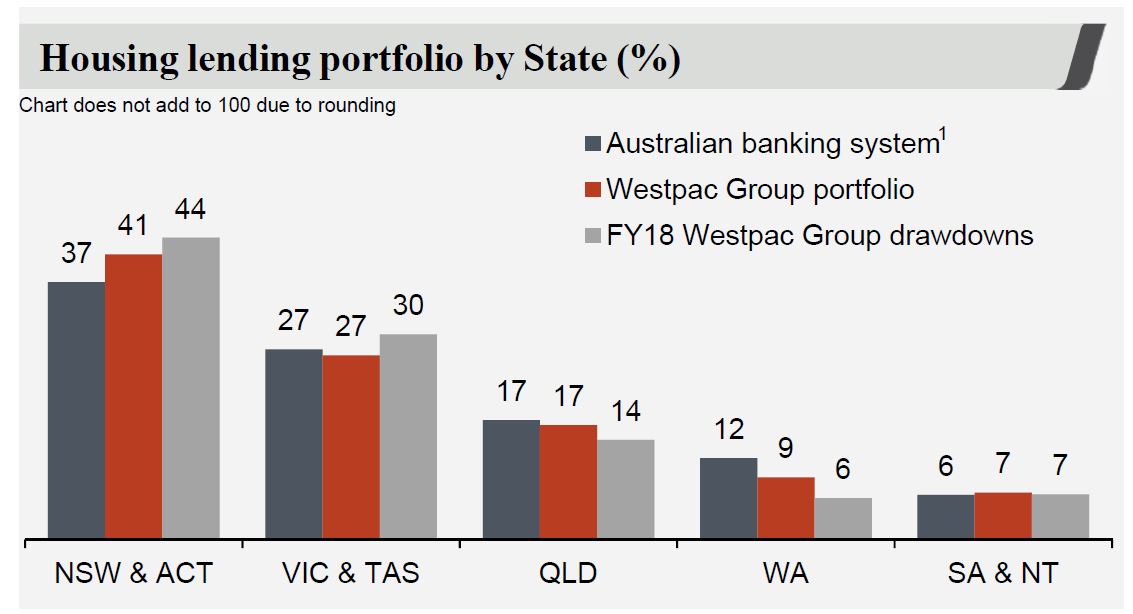
 Westpac is writing more mortgage loans from NSW and VIC, relative to system and 51.6% of new flows came from propitiatory channels. 8.2% of new loans were from first time buyers. Borrowers applying for a mortgage must be able to service the higher of either: 7.25% minimum assessment rate; or product rate plus 2.25% buffer. Actual mortgage losses are 2 basis points.
 The schedule of IO loan expiry reaches out over the next 10 years!
 The Australian mortgage book shows a rise in delinquencies, a small fall in those paying ahead, and a rise in dynamic LVR (in response to falling prices). Dynamic LVR is the loan-to-value ratio taking into account the current loan balance, estimated changes in security value, offset account balances and other loan adjustments. WA and SA/NT are most exposed.
 Westpac reported their mortgage stress tests which assumes a severe
recession in which significant reductions in consumer spending and business investment lead to six consecutive quarters of negative GDP growth. This results in a material increase in unemployment and nationwide falls in property and other asset prices. They say that estimated Australian housing portfolio losses under these stressed conditions are manageable and within the Group’s risk appetite and capital base.
- Cumulative total losses of $3.9bn over three years for the uninsured portfolio (1H18: $3.5bn).
- Cumulative claims on LMI, both WLMI and external insurers, of $911m over the three years (1H18: $911m).
- Peak loss rate in year 2 has increased to 52bps (1H18: 48bps) due to recent
declines in house prices which leads to a higher dynamic LVR starting point for the portfolio. In addition, the unemployment rate for September of 5.0%
creates a bigger peak to trough change compared to 1H18. - WLMI separately conducts stress testing to test the sufficiency of its capital
position to cover mortgage claims arising from a stressed mortgage
environment.
Total impairments were down to $3,053 million (44% of impaired assets).
 The CET1 ratio was 10.63%, up 13 basis points from March 2018.


