Luci Ellis RBA Assistant Governor (Economic) delivered the Stan Kelly Lecture on “Where is the Growth Going to Come From?“. An excellent question given the fading mining boom, and geared up households!
Over time, some industries grow faster than others. For a while, the mining industry was growing faster than the rest. Other industries take the lead at other times. But it doesn’t really get at the underlying drivers of growth. We need to ask: where will the growth really come from, over the longer term?
In answering this question, it is hard to go past the ‘three Ps’ popularised by our colleagues at Treasury: population, participation and productivity. I’ll go through each in turn.
Population
As the Governor noted in a speech a few years ago, Australia’s population is growing faster than in almost any other OECD economy (Lowe 2014). That has remained true over the past couple of years. The rate of natural increase is higher than many other countries, but most of the difference is the large contribution from immigration.
Of course, just adding more people and growing the economy to keep pace wouldn’t boost our living standards.[5] But there are two reasons why we should not assume that this is all that happens. Firstly, recent migrants have a different profile to the incumbent Australian population. They are generally younger, and the youngest age group are significantly more likely to have non-school qualifications (Graph 5). This is possibly because so many recent migrants initially arrive on student visas and then stay. In line with that, service exports in the form of education have grown rapidly over the past few decades.
Older migrants are on average less likely to have such a qualification than existing residents in the same age groups, but they are a small fraction of all migrants. The average education level of newly arrived Australians is actually higher than that of existing residents, precisely because they are younger. So Australia’s migration program is structured in a way that, in principle at least, it can grow the economy while raising average living standards.
Secondly, increasing economic scale is not neutral. There is more to it than just getting bigger. This is the lesson of what is sometimes called New Economic Geography: scale economies arise from product differentiation (Fujita, Krugman and Venables 1999). Bigger, denser cities are more productive. Perhaps more importantly, larger population centres allow more variety in the goods and services produced. Fujita and Thisse (2002) quote Adam Smith making the same point (Smith 1776, p 17).
There are some sorts of industry, even of the lowest kinds, which can be carried on no where but in a great town. A porter, for example, can find employment and subsistence in no other place. A village is by much too narrow a sphere for him; even an ordinary market town is scarce large enough to afford him constant occupation.So it is also with management consultants, medical specialists and a myriad of other occupations that can only be sustained in a large market.
Participation
The second of the three Ps, participation, can and has been increasing average incomes and living standards. It is usually presumed that ageing of the population will reduce participation. In Australia at least, other forces have offset that tendency in recent years.
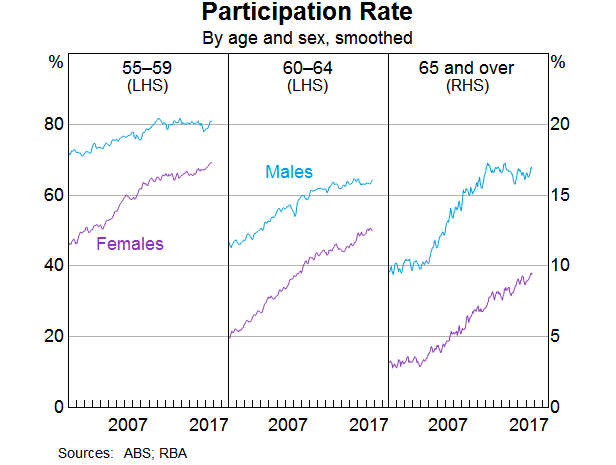
In our Statement on Monetary Policy, released last week, we noted that the participation rate has been rising recently. The increase has been concentrated amongst women and older workers. That is true of the pick-up over recent months. It is also true over a somewhat longer period, as shown in this graph (Graph 6). Older workers have increased their participation in the workforce as the trend to earlier retirement has abated. Mixed in with this is a cohort effect related to the increasing participation of women more generally. Each generation of women participates in the labour force at a greater rate than the previous generation of women did at the same age.
There is a connection here with the increase in health and education employment I mentioned earlier. Better healthcare outcomes means that fewer people retire early because of ill-health, so participation rises. More extensive childcare options make it easier for both parents to be in paid work. Given the usual presumptions in our society about who has primary responsibility for caring for children, this shift affects participation of women more than that of men. So it’s no surprise that the participation rates of women aged 35–44 have also been rising strongly. And more flexible work arrangements tend to encourage participation by both female and older workers.
In the end, though, lifting participation is a once-off adjustment. Once someone enters the workforce, they can’t enter it a second time without leaving first. Greater participation raises the level of living standards but it isn’t an engine of ongoing growth. We must also remember that the objective is not that everyone must be in paid employment. Many people are outside the labour force for good reasons, for example because they are in full-time education, caring for children or other relatives, or doing volunteer work by choice.
Productivity and Innovation
That leaves us with productivity, arguably the most important of three Ps, but unfortunately also the hardest to measure. It is also an area where distributions and firm-specific decisions really matter. Some recent international evidence shows that the firms at the global productivity frontier can be several times more productive than the average firm in their industry (Andrews, Criscuolo and Gal 2015).[6] This research also finds that firms tend to adopt a new technology only after the leading firms in their own country have adopted it. That is, the national productivity frontier first has to catch up to the global frontier, by adapting the new technology to local conditions. So the average productivity of firms in an economy depends on three things.
- How quickly the leading firms in that country adopt the technology and match the productivity levels of the globally leading firms in that industry.
- How large the leading firms are in the national economy.
- How quickly the laggard firms can catch up, once the national leading firms have adopted a particular technology.
The findings of this research suggest that this last factor – the rate of technology adoption – has slowed down since the turn of the century.
The policy implications of these findings are subtle, and depend on whether you want to affect firms near the frontier, or the firms that are lagging far behind. For example, a more flexible labour market might make it easier for the leading firms to grow faster. Average productivity would rise because those leading firms account for a greater share of output. But then you would have an economy dominated by ‘superstar firms’ (Autor et al 2017). The implications of that are not necessarily benign. For a start, inequality could be greater. Median living standards might not rise.
The drivers of innovation, like the drivers of creativity more generally, are hard to pin down. But the literature does provide some pointers to them. First and perhaps most important is simply to grow: growth is more conducive to innovation than recession is. Recessions do not engender ‘creative destruction’; they produce liquidations, which are destructive destruction (Caballero and Hammour 2017). Indeed, when labour is plentiful, there is not much incentive to invest in productivity-boosting technology. And when everyone’s sales are weak, there is not much incentive to invest to try to increase them. There is nothing quite like a tight labour market to make firms think about how to do things more efficiently.
The pressures of strong sales or competition might spur innovation, but many other factors enable it. Infrastructure is a key enabler not only of productivity growth of existing firms, but whole new business opportunities. Often we think of communications infrastructure and the internet in this context. Transport infrastructure is at least as important, I would argue, which makes the current pipeline of public investment even more relevant to future growth outcomes. That’s because online commerce still needs good physical logistics. Unless it’s a purely digital product, something still needs to be delivered. Australia is a highly urbanised country, but it is also a highly suburbanised country. Improving urban transport infrastructure, as well as inter-urban transport infrastructure, could help boost productivity across a range of both traditional and new industries.
Also important is the political and regulatory environment. It would not surprise Stan and Bert Kelly that much of the literature finds that product market regulation and other devices protecting laggard firms tend to retard innovation. More generally, barriers to entry make it harder for new, potentially more innovative firms to break in.
It isn’t all about the start-ups, though. A lot depends on the propensity of existing firms to adopt new technologies and business practices. We think that this is one of the reasons for the slow rate of growth in retail prices in Australia at present. In the face of increased competition, incumbent retailers are having to both compress margins and use technology to become more efficient. Our liaison contacts tell us that they are investing heavily in better inventory management and other cost-saving measures, often by using data analysis more extensively.
Adopting these innovations takes time, because firms have to become familiar with the new technologies and change their business practices to take advantage of them. It wouldn’t be the first time that the computers – or perhaps this time, the machine learning algorithms – were visible everywhere except in the productivity statistics for just this reason.[7]
Adopting new technologies and business models also requires a willingness to change. Just as views to protection can change, so can society’s attitudes to risk, innovation and, thus, entrepreneurship. We saw, after all, that Australia’s economic culture could shift from being inward-looking to outward-looking over the course of a couple of decades.
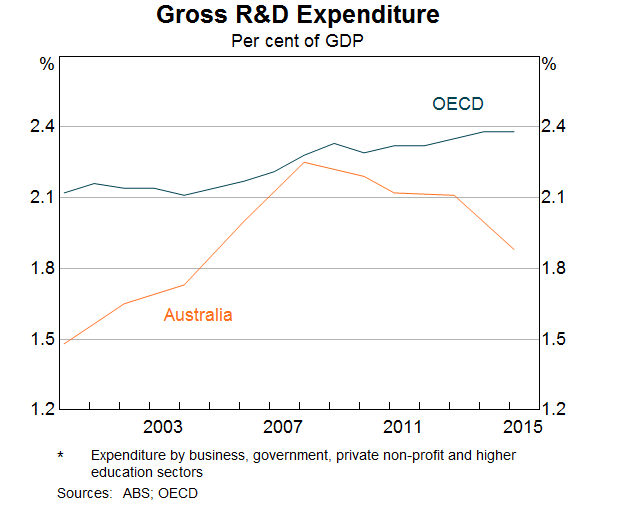
Australia is normally seen as being a relatively fast adopter of technology. But there are some aspects where we seem to lag. One is R&D expenditure (Graph 7). While this isn’t greatly below the average of industrialised countries and many similar countries get by perfectly well doing much less, it has been declining in importance lately. Some other indicators also suggest that Australian firms have in recent years been less likely to adopt innovative technologies than their peers abroad. For example, while small firms are holding their own, large firms in Australia are less likely to use cloud computing services than large firms in many other countries.[8] This wasn’t always the case: a decade and a half ago, Australian firms were towards the front of the curve in adopting the e-commerce technologies that were new at the time (Macfarlane 2000). A lot depends on whether the workforce has the skills to use these new technologies, but at heart, technology adoption is a business decision.


