
ANZ today announced a Statutory Profit after tax for the Full Year ended 30 September 2018 of $6.40 billion, flat on the comparable period and a Cash Profit on a continuing basis of $6.49 billion, down 5%. Their approach to simplify the business and reduce costs have bolstered their capital position, but also left them potentially more exposed to a mortgage and construction sector downturn.
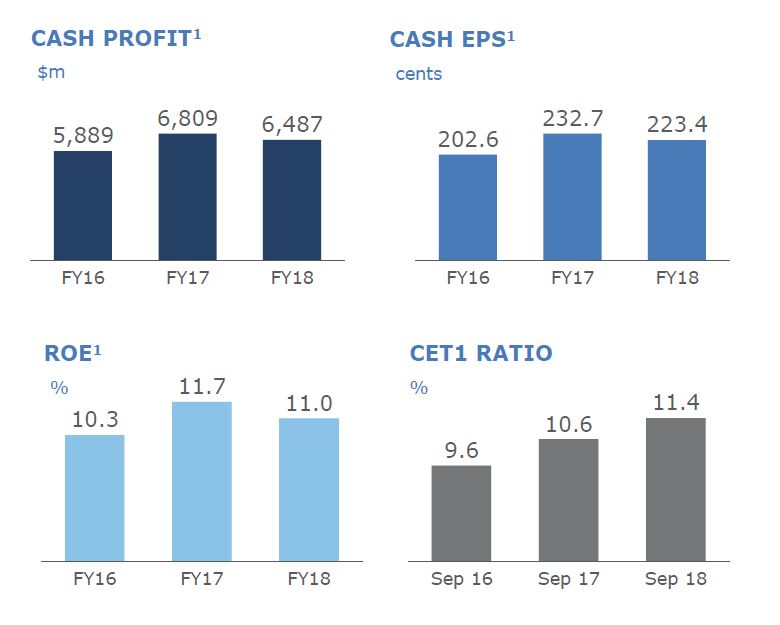 ANZ’s Common Equity Tier 1 Capital Ratio was 11.4% up 87 basis points (bps). Return on Equity decreased 67 bps to 11.0% with Cash Earnings per Share down 4% to 223.4 cents (continuing). The Final Dividend is 80 cents per share, fully franked, bringing the Full Year Dividend to 160 cents.
They called out the headwinds facing Retail banking thanks to housing growth slowing, and borrowing capacity reduced. They said they had sacrificed sort-term revenue growth and high margins in Australia, particularly in the investor and interest-only segments. New Zealand performed well. The risk adjusted performance for Australia FELL in the second half, as the impact of the tighter mortgage sector hit home.
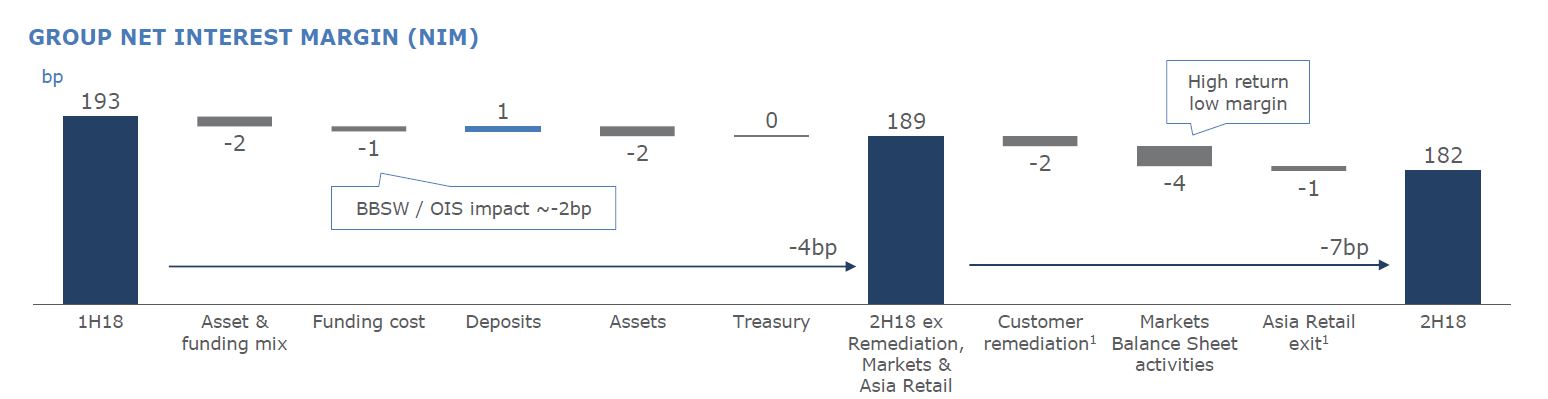
Net Interest Margin was significantly lower, thanks to the change in business mix, funding and customer remediation charges.
 The results were supported by the $3 billion share buy-back and the neutralisation of the full year dividend reinvestment plan. They reduced variable remuneration paid to staff this year across the bank by $124 million and are undertaking the urgent work required to fix the failures that have been highlighted by the Royal Commission.
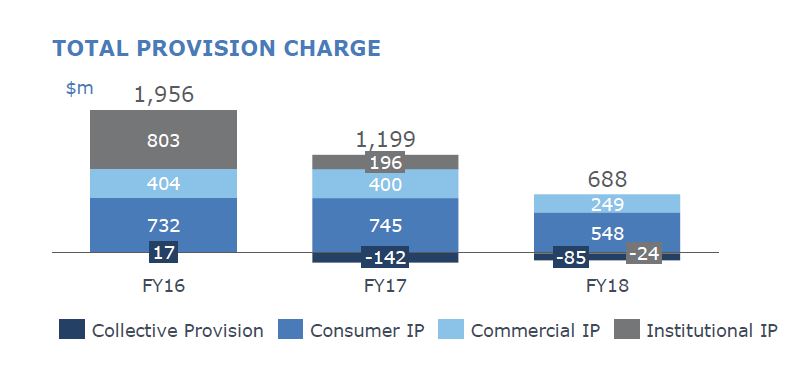
ANZ announced earlier this month charges of $377 million after tax have been recognised in 2H18 for refunds to customers and related remediation costs. ANZ also recorded accelerated amortisation expense of $206 million in 2H18, predominantly relating to its International business. A restructuring charge of $104 million, largely relating to the previously announced move of the Australia and Technology Divisions to agile ways of working, was also recorded in 2H18.
Staff numbers have fallen significantly from 50,152 in 2015 to 37,860 in 2018.
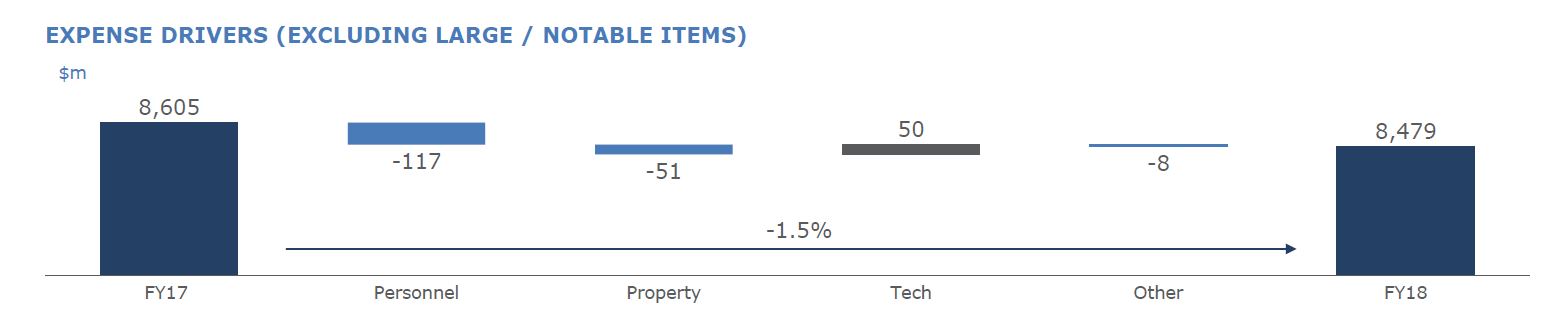
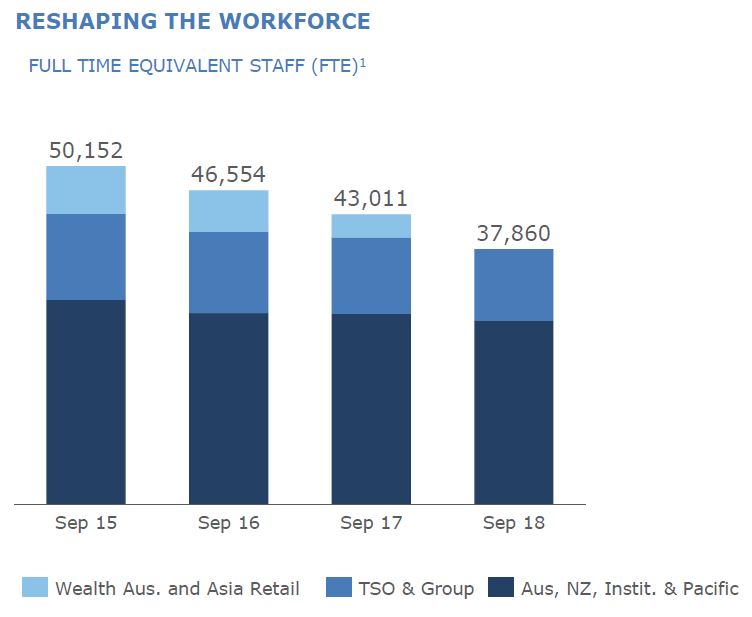 As a result, costs were lower, despite significant technology investments.
 The total provision charge for the year was $688 million down 43%.
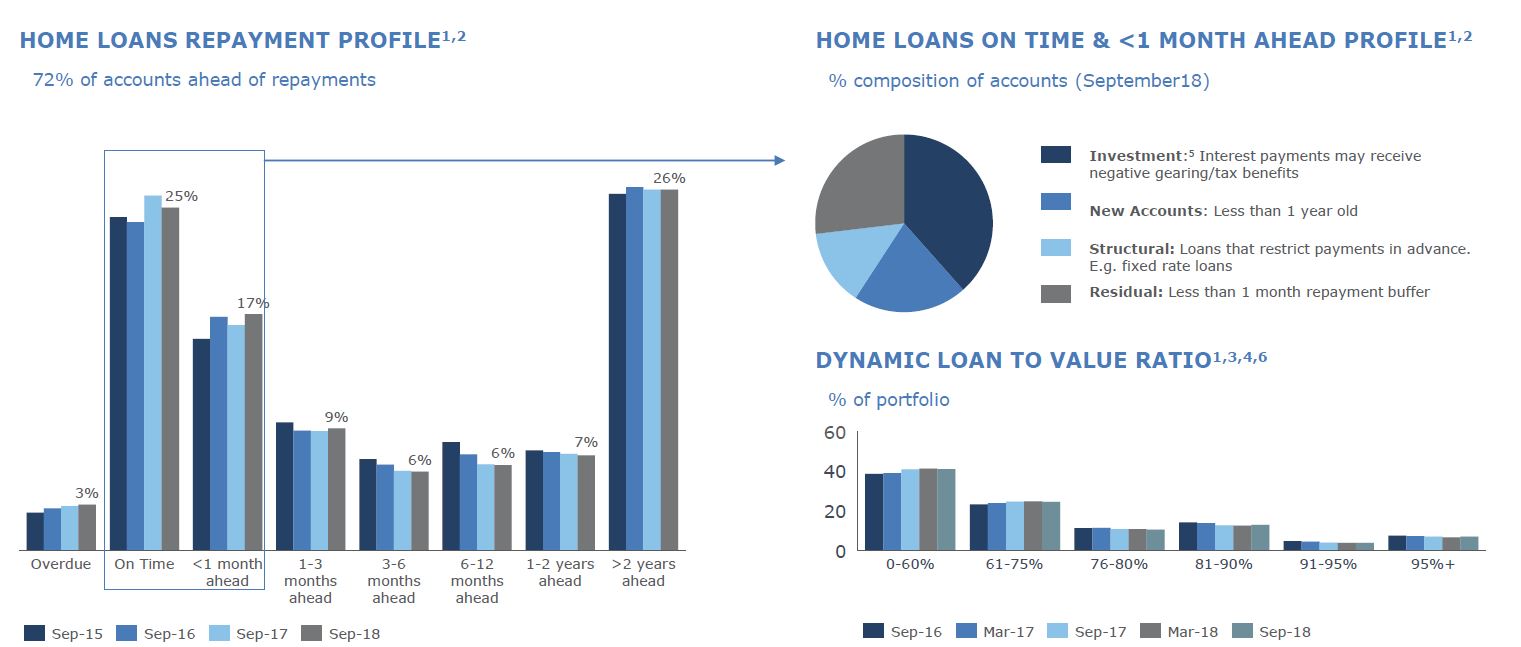
 Looking at the Australian Home Lending portfolio, they say 72% of households are ahead on repayments. They hold more loans above 95% than 90% in their portfolio.
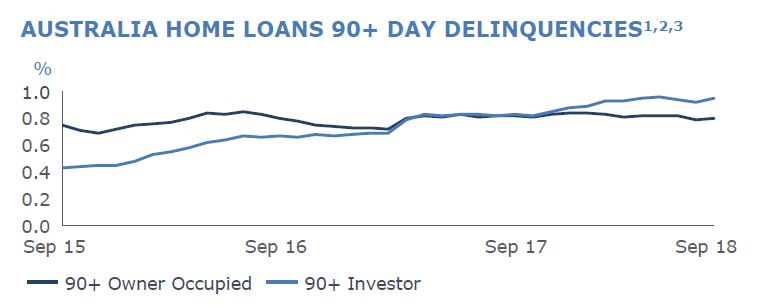
 Australian Home Loan 90+ Delinquencies were higher, especially investor loans, rising from 0.84% in September 2017 to 0.86% in September 2018.
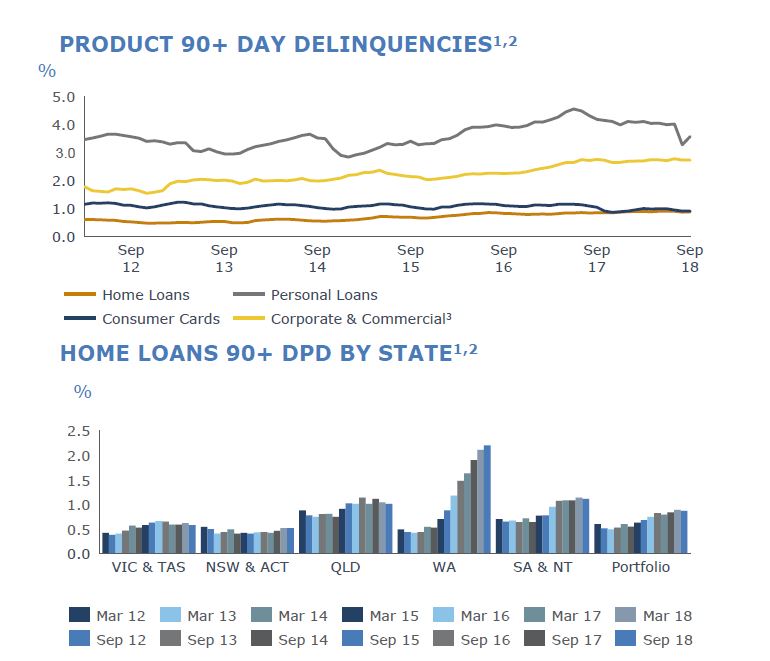
 WA continues to show more 90+ delinquency, and WA is 13% of funds under management, but 33% of 90+ and over half of portfolio losses. This shows the long slow drag on performance from a slowing economy.
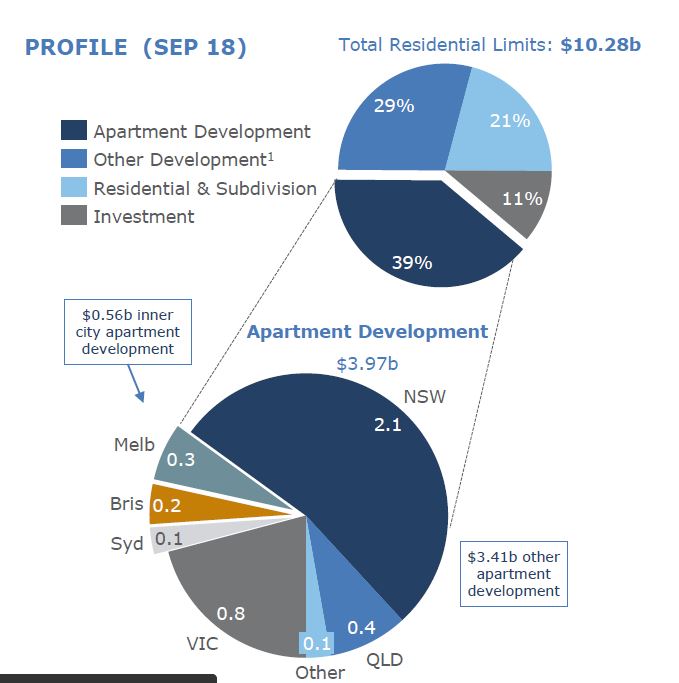
 They also increased their exposure to commercial property, with apartment development limits up 17% to ~$4 billion, which accounts for ~39% of total residential limits. Inner City apartment limits totalled $0.56 billion and was 14% of the total apartment development limit in FY18, down from 20% in the prior year. This was thanks to developments in Sydney and Melbourne being repaid. They have highest exposure in NSW.
 The Group Loss rate reduced to 12 bps with the second half loss rate 9 bps. New Impaired assets declined just over $1.1 billion or 34% with Gross Impaired Assets down 16%. The significant decline in the Group loss rate reflects portfolio credit quality improvement driven by strategic changes to the composition of the asset book, such as the sale of retail and commercial in Asia, together with tighter lending standards and a relatively benign credit environment.
The APRA CET1 capital ratio at 30 September 2018 was 11.4% (16.8% on an Internationally Comparable basis). This places ANZ well above the APRA prescribed ‘unquestionably strong’ threshold, comfortably ahead of the 2020 deadline.
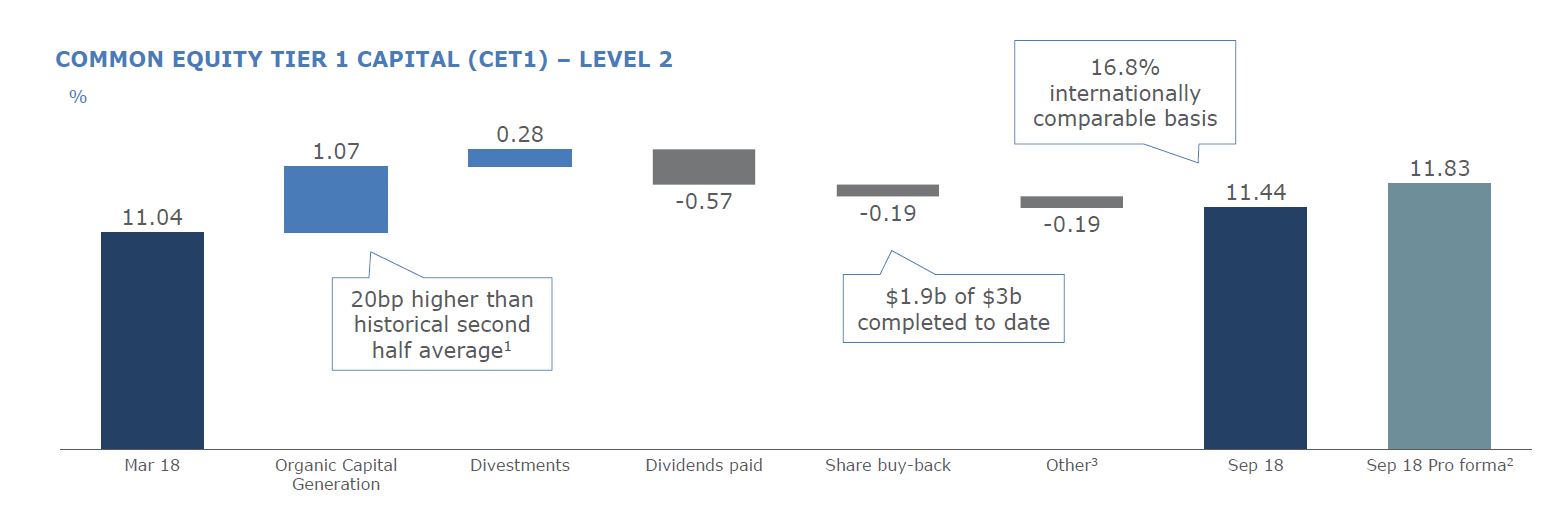 Completed assets sales during the year increased the CET1 position by ~84bps. They commenced an on market share buyback in January 2018 and was increased to $3 billion in June 2018. As at 30 September $1.9bn of this had been completed, representing ~2% of ANZ shares outstanding. They expect the remaining ~$1.1bn to be completed during 1H19.
The Group’s funding and liquidity position remained strong with the Liquidity Coverage Ratio at 138% and Net Stable Funding Ratio at 115%. Other asset sales already announced will provide further flexibility.