
The ABS released their May 2018 employment data today. The Labour force statistics top line story looks pretty good, with an increase in the total number of jobs, and a fall in the seasonally adjusted rate of employment from 5.6% last month to 5.4% in May. But in fact we think this is another soft result, thanks to a slide in the number of hours worked, anemic and falling jobs growth, a further shift to part time employment, and a rise in underemployment.
The monthly trend unemployment rate remained steady at 5.5 per cent in May 2018, according to latest figures released by the Australian Bureau of Statistics (ABS) today.
Actually, it fell just a tad, from 5.48% to 5.46%, but then who’s counting, given the lack of precision in the data set. So lets agree with the ABS, trend, no change.
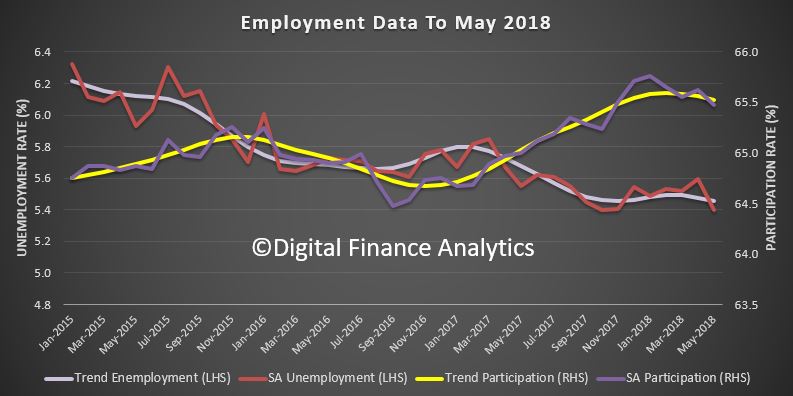
The trend participation rate decreased by less than 0.1 per cent to 65.5 per cent in May 2018, after the April figure was revised down. Over the past year, trend employment increased by 318,000 persons or 2.6 per cent, which was above the average year-on-year growth over the past 20 years (2.0 per cent).
In fact, its the fall in the participation rate which explains the fall in the unemployment rate stats. We are not seeing such strong growth in jobs, as we saw a few months back in fact.
 The underlying trend really shows that underemployment is still very high.
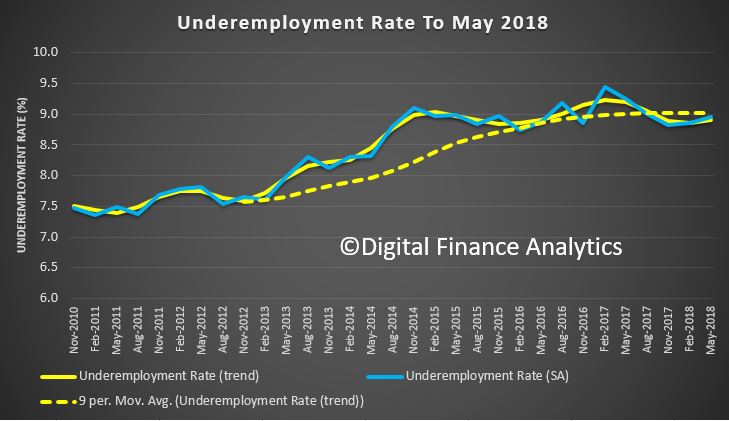
The ABS said that over the year to May, the unemployment rate declined 0.2 per cent, while the underemployment rate also fell by 0.2 per cent over the year to 8.5 per cent. The underemployment rate, which is the proportion of people who are working but would like to work more hours, remains below the peak of 8.7 per cent seen in 2017. “The latest data tells us that over the past year both the trend unemployment rate and underemployment rate declined by 0.2 per cent, resulting in the underutilisation rate declining 0.4 per cent to 13.9 per cent”.
 But the troubling thing is that there continues to be a slide towards more part time jobs, with trend employment increasing by around 16,000 persons in May 2018, with part-time employment increasing by 12,000 persons and full-time employment by 4,000 persons. This continued the recent slowing of employment growth, particularly full-time employment growth.
This is further evidence, as we discussed yesterday from our household survey results, that more and more people are in fractured or casual employment.
The net increase of 16,000 persons comprised of well over 300,000 people entering employment, and more than 300,000 leaving employment in the month. This was below the modest 19,000 increase expected by economists.
The trend monthly hours worked increased by 2.8 million hours or 0.2 per cent in May 2018, and by 2.7 per cent over the past year.
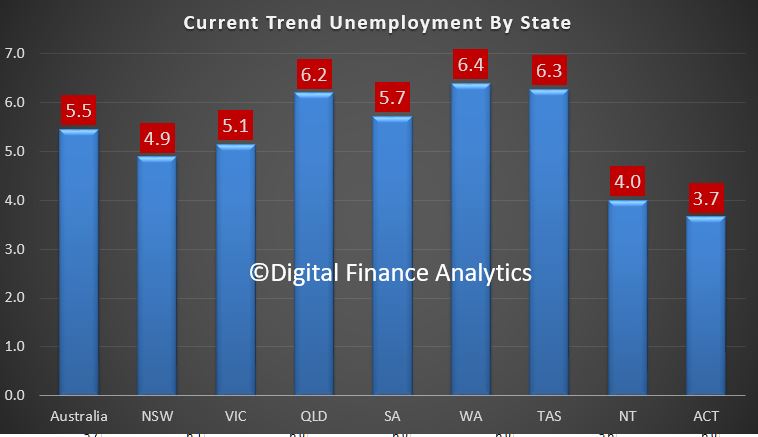
Over the past year, the states and territories with the strongest annual growth in trend employment were New South Wales (3.6 per cent), Queensland (2.9 per cent) and South Australia (2.4 per cent). NSW has led the growth in jobs. We see that NSW has an unemployment rate of 4.9%, in trend terms, just higher than the ACT at 3.7% and the Northern Territory at 4%. Victoria is sitting at 5.1%, South Australia at 5.7%, and Queensland plus Tasmania and Western Australia all well above 6%.
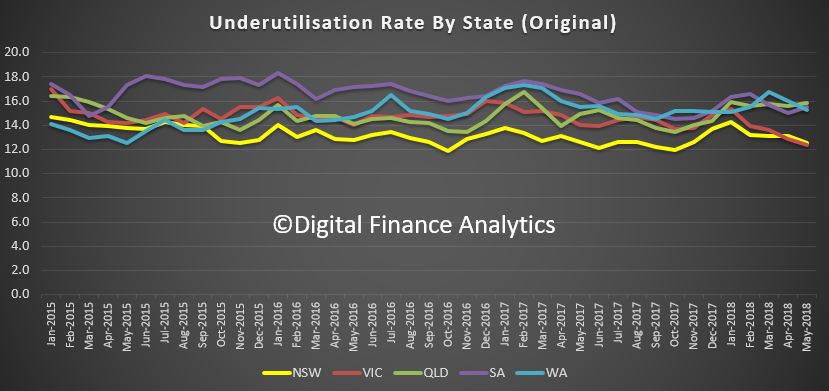
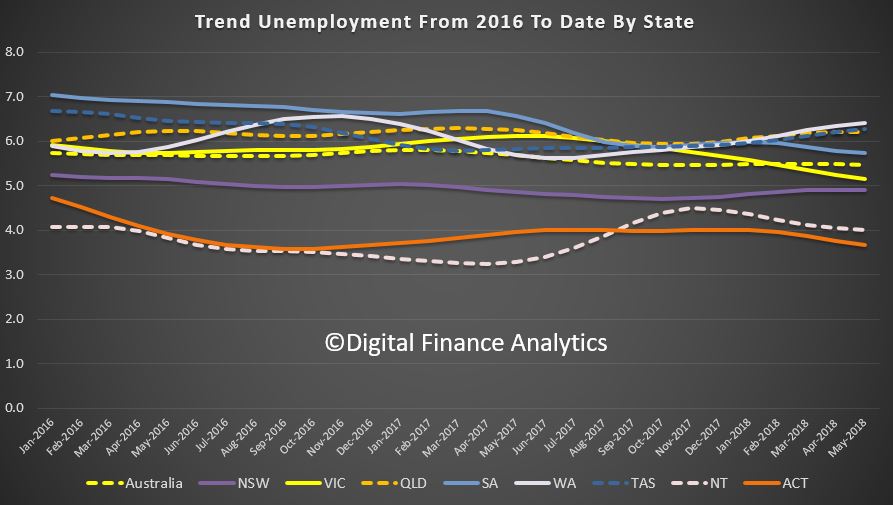
 The longer term trends are also worth looking at, with Western Australia at the top of the list with highest rate, and trending higher, with Victoria and New South Wales in the middle of the pack, and the ACT and Northern Territories with the lowest rates of unemployment.
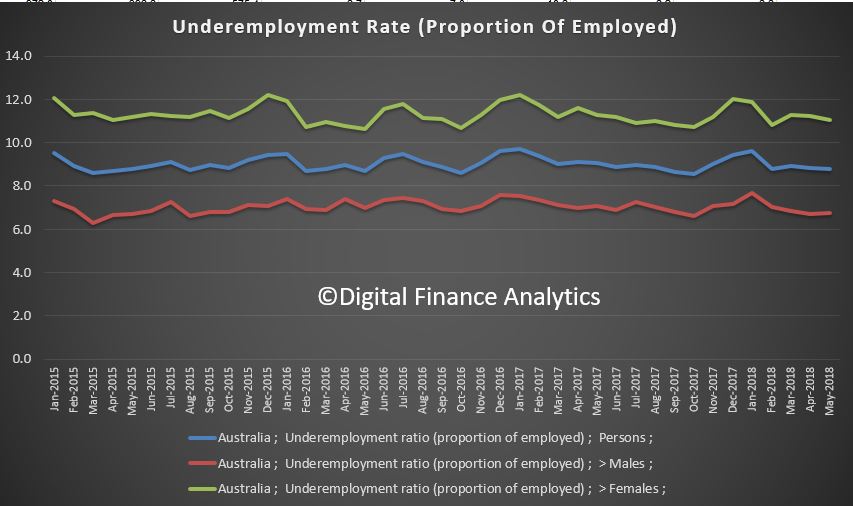
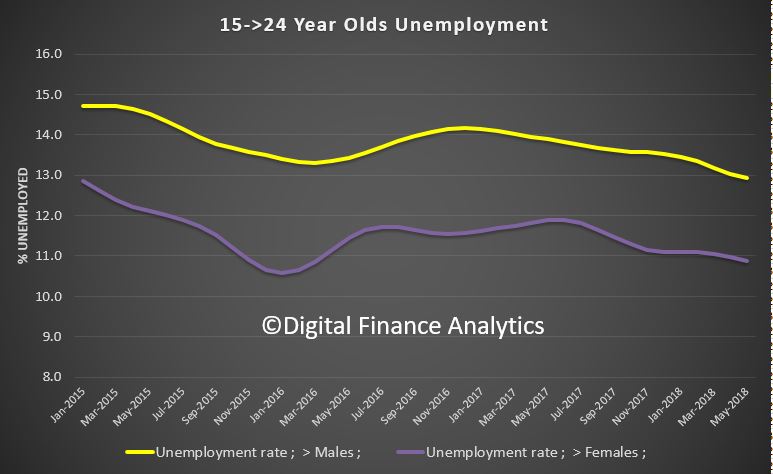
 Also note the higher figures among younger Australians, with those between 15 and 24 sitting at 13% for males and 11% for females.
 So, this suggests there is no reason to expect the employment rate to fall toward the “magic 5%” when the RBA says wages should start to rise. We think if anything unemployment may rise in the months ahead as jobs growth slows further.
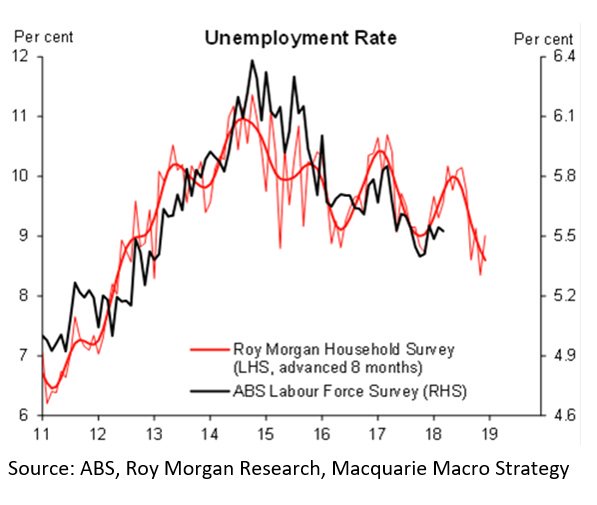
As you know we question the basis of the employment calculations, as even working for an hour or two takes people out of the count. The Roy Morgan alternative basis of calculation shows a much higher, and rising rate. This chart from Macquarie shows that there is a lagged relationship between the official figures and the Roy Morgan trends, and if this is true, then the unemployment rate is set to rise for the next few months.
 Overall, even if the pace of job creation picks up again in the coming months, the excess slack and other structural forces are likely to prevent wage growth from increasing much above its current rate of 2.1% this year. This will continue to weigh on household spending and house prices and hamper the recovery.
This probably puts an RBA inspired rate hike further down the track, but the US rate hike overnight means that there will be more pressure on international capital markets. The bond market moved higher. Specifically, a few of the Fed members who’d been holding out for slightly lower rates in 2018 moved their forecasts up enough to increase the odds of a 4th rate hike by December. This was already a strong possibility, but before today, those in the “3 hike” camp had a stronger case.
The FED said that in May the labor market has continued to strengthen and that economic activity has been rising at a solid rate. Job gains have been strong, on average, in recent months, and the unemployment rate has declined.
In fact the May 2018 figure has a three in front of it, a significantly lower number than our own, even allowing for a different basis of calculation.

The FED says …recent data suggest that growth of household spending has picked up, while business fixed investment has continued to grow strongly. On a 12-month basis, both overall inflation and inflation for items other than food and energy have moved close to 2 percent. Indicators of longer-term inflation expectations are little changed, on balance.
In view of realized and expected labor market conditions and inflation, the Committee decided to raise the target range for the federal funds rate to 1.75 to 2 percent. The stance of monetary policy remains accommodative, thereby supporting strong labor market conditions and a sustained return to 2 percent inflation.
But the kicker is probably another 2 hikes later in the year. US Mortgage Rates were higher again.
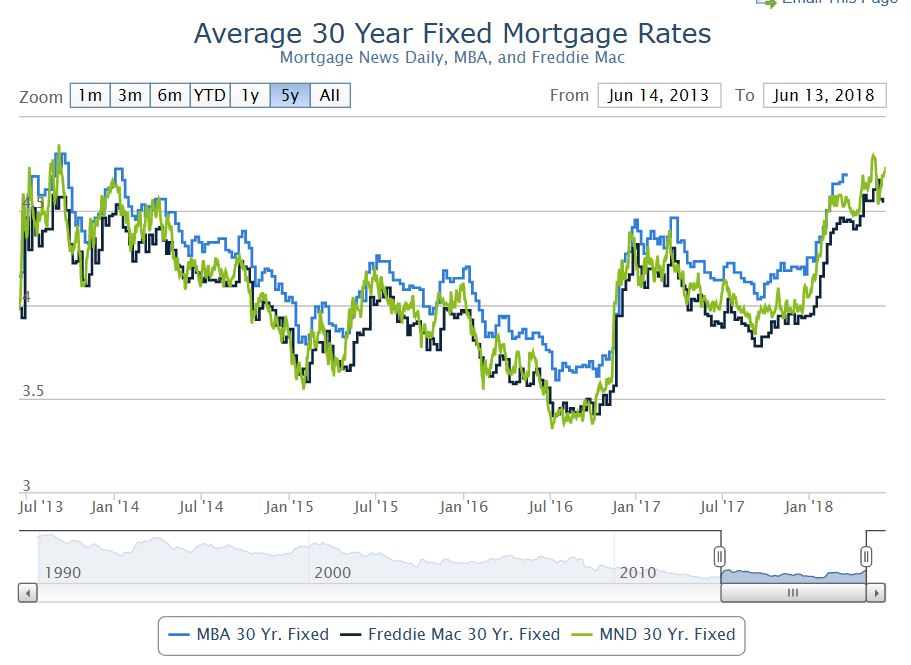 Watch for higher BBSW rates, which will be a harbinger of higher mortgage rates in Australia, despite the Reserve Bank and higher unemployment in the local market.