
Lenders Mortgage Insurance is a tough gig, because they tend to get the higher risk loans, written at higher loan to value ratios. So, perhaps no surprise that in the current environment, of tougher lending conditions, and high debt, we continue to see a drop in new business and a rise in delinquencies. Significantly, there was a rise in NSW delinquencies, the most populous state, with the biggest loans! “In non-mining regions there are indications of a softening in cure rates, in particular in NSW and Western Australia. These are being closely monitored to ascertain any developing adverse trends”.
Genworth Mortgage Insurance Australia Limited has reported statutory net profit after tax (NPAT) of $8.4 million and underlying NPAT of $19.9 million for the quarter ended 31 March 2018 (1Q18). This is down 70.9% on prior corresponding period (though 1Q17 underlying NPAT included a $20.8 million realised gain resulting from a re-balancing their investment portfolio).
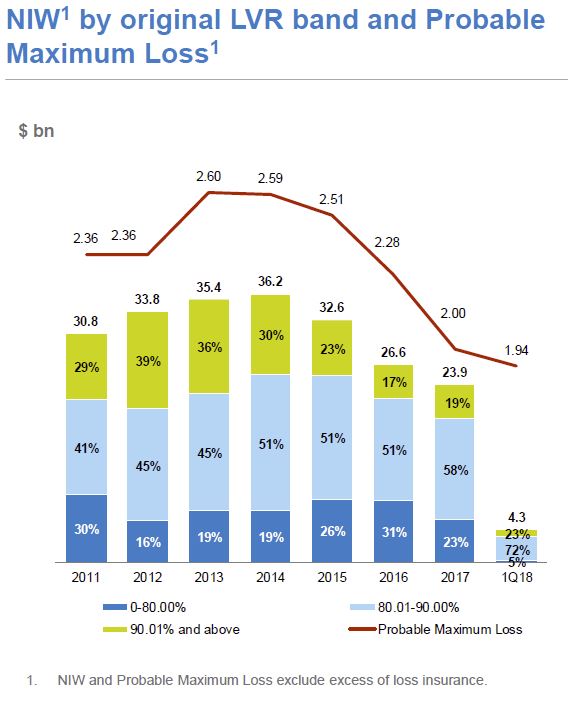
New business volume, as measured by New Insurance Written (NIW), decreased 36.8% to $4.3 billion in 1Q18 compared with $6.8 billion in 1Q17.
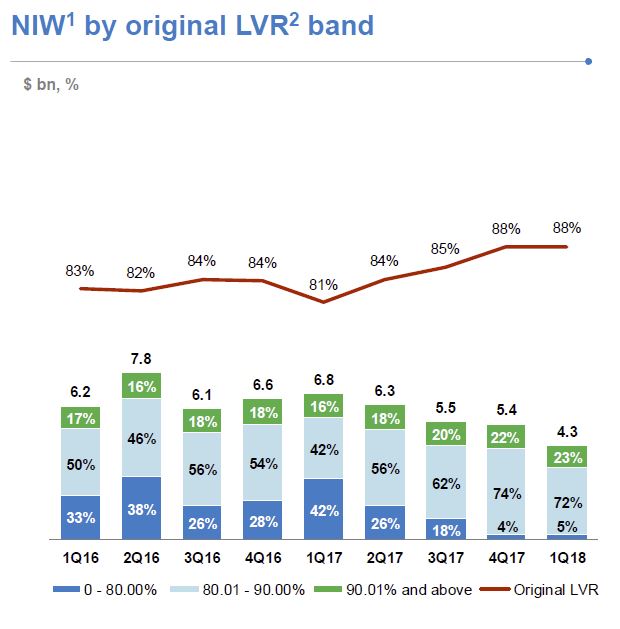 NIW excludes excess of loss insurance and the new business written via Genworth’s Bermudan entity. NIW reflects the fact that: i) there were no bulk portfolio transactions in 1Q18 (1Q17 included $1.3 billion of bulk portfolio business); and ii) 1Q17 included business written pursuant to an agreement with the Company’s then second largest customer. This agreement terminated in April 2017 and represented $1.6 billion of NIW in 1Q17.
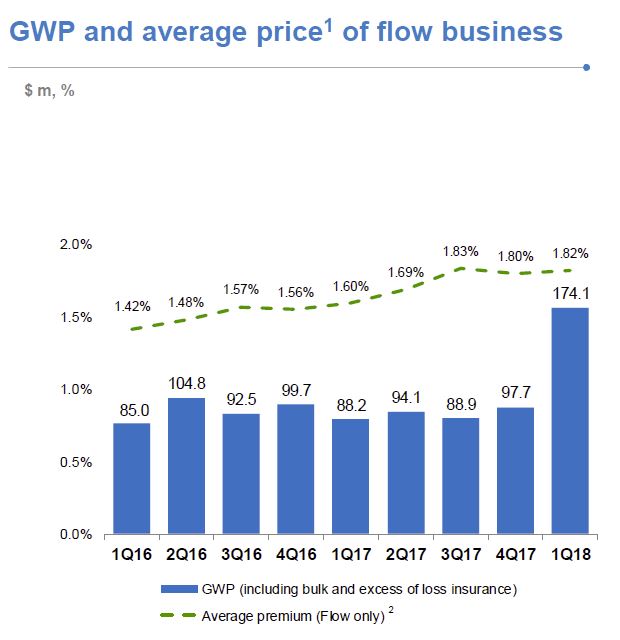
 Gross Written Premium (GWP) increased 97.4% to $174.1 million in 1Q18 (1Q17: $88.2 million). This includes the new business written via Genworth’s Bermudan entity and the new Micro Markets LMI business. Genworth has retained $170.2 million of risk and placed the remainder with a consortium of global reinsurers through its Bermudan entity. Net of the premium to the consortium of global reinsurers, Genworth’s GWP increased 26.5% in 1Q18. For reporting purposes this risk is not reflected in NIW. In terms of the traditional LMI business written during the quarter, the lower volumes were partially offset by the higher LVR mix resulting in a modest increase in the average price of the flow business.
 Net Earned Premium (NEP) decreased 37.5% from $107.9 million in 1Q17 to $67.4 million in 1Q18. This reflects the $32.3 million impact of the 2017 Earnings Curve Review and lower earned premium from current and prior book years. Excluding the 2017 Earnings Curve Review impact, NEP would have declined 7.6%. The 2017 Earnings Curve Review took effect from 1 October 2017 and has the effect of lengthening the period of time over which premium is earned. It does not however affect the quantum of revenue that will be earned over time. The unearned premium reserve as at 31 March 2018 was $1.2 billion.
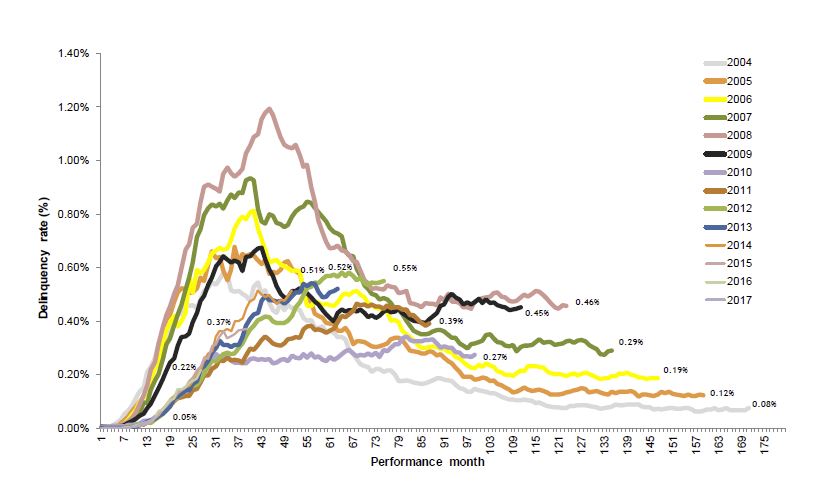
The delinquency rate increased slightly from 0.48% in 1Q17 to 0.49% in 1Q18, driven by Western Australia and New South Wales (NSW).
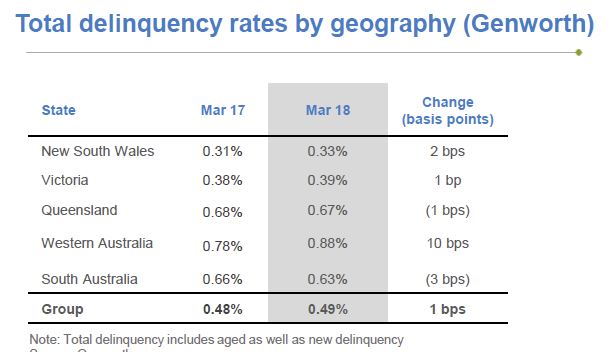 South Australia and Queensland experienced lower delinquency rates, whilst the delinquency rate in Victoria increased marginally. All states experienced a decline in new delinquencies, with the exception, of Western Australia. Delinquencies in mining areas are showing signs of improving. In non-mining regions there are indications of a softening in cure rates, in particular in NSW and Western Australia. These are being closely monitored to ascertain any developing adverse trends.
 Net Claims incurred was stable during the quarter at $37.7 million (1Q17: $37.6 million). The loss ratio in 1Q18 was 55.9%, up from 34.8% in 1Q17, reflecting the impact of lower NEP due to the 2017 Earnings Curve Review. Excluding the impact of the 2017 Earnings Curve Review the 1Q18 loss ratio would have been 37.8%.
 The expense ratio in 1Q18 was 33.5% compared with 25.2% in 1Q17, reflecting the lower NEP and expenditure on the Strategic Program of Work.
Investment income of $7.8 million in 1Q18 included a pre-tax mark-to-market loss of $16.4 million ($11.5 million after-tax). In the first quarter of 2017, the portfolio was restructured to reduce interest rate risk exposure, resulting in pre-tax realised gains of $29.7 million ($20.8 million after tax). This gain was included in the underlying NPAT reported in 1Q17. As at 31 March 2018 the value of Genworth’s investment portfolio was $3,285.4 million, more than 83% of which is held in cash and highly rated fixed interest securities. The Company had $216.9 million invested in Australian equities as at 31 March 2018. Whilst volatility in equity markets contributed to unrealised losses in 1Q18, the equity portfolio has delivered a return of 8.9% p.a. (pre-tax) since inception in 2016.
They continue to be focused on an optimal capital structure to maintain the Board’s targeted Prescribed Capital Amount (PCA) of 1.32 to 1.44 times. So they announced an on-market share buy-back of up to a value of $100 million, subject to shareholder approval at the Annual General Meeting 10 May 2018.