
The ABS released their housing finance data today to March 2018. The trends are pretty clear, lending is slowing, and bearing in mind our thesis that lending and home prices are inextricably linked, this signals further home price falls ahead, which will be exacerbated by even tighter lending standards we think are coming. Debt is still rising faster than inflation or wages.
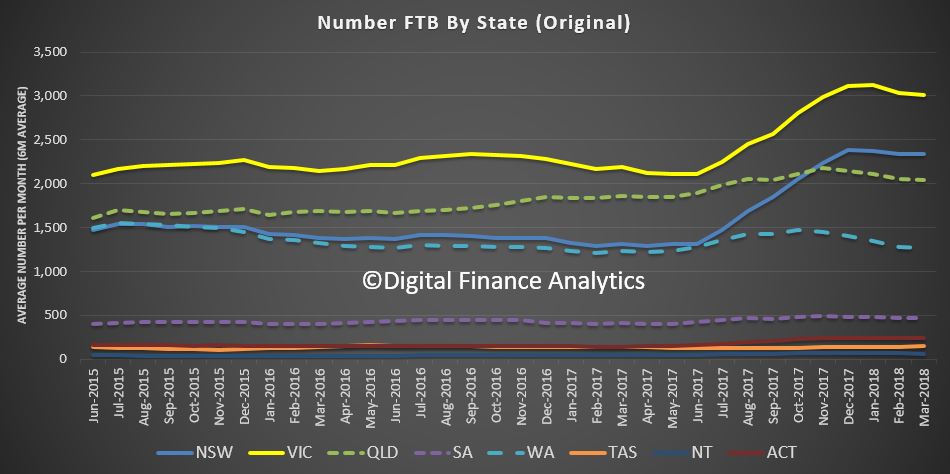
Starting with the original first time buyer data we see a rise in volumes, reflecting the incentives in NSW and VIC. On a rolling average basis, volumes are strongest in VIC.
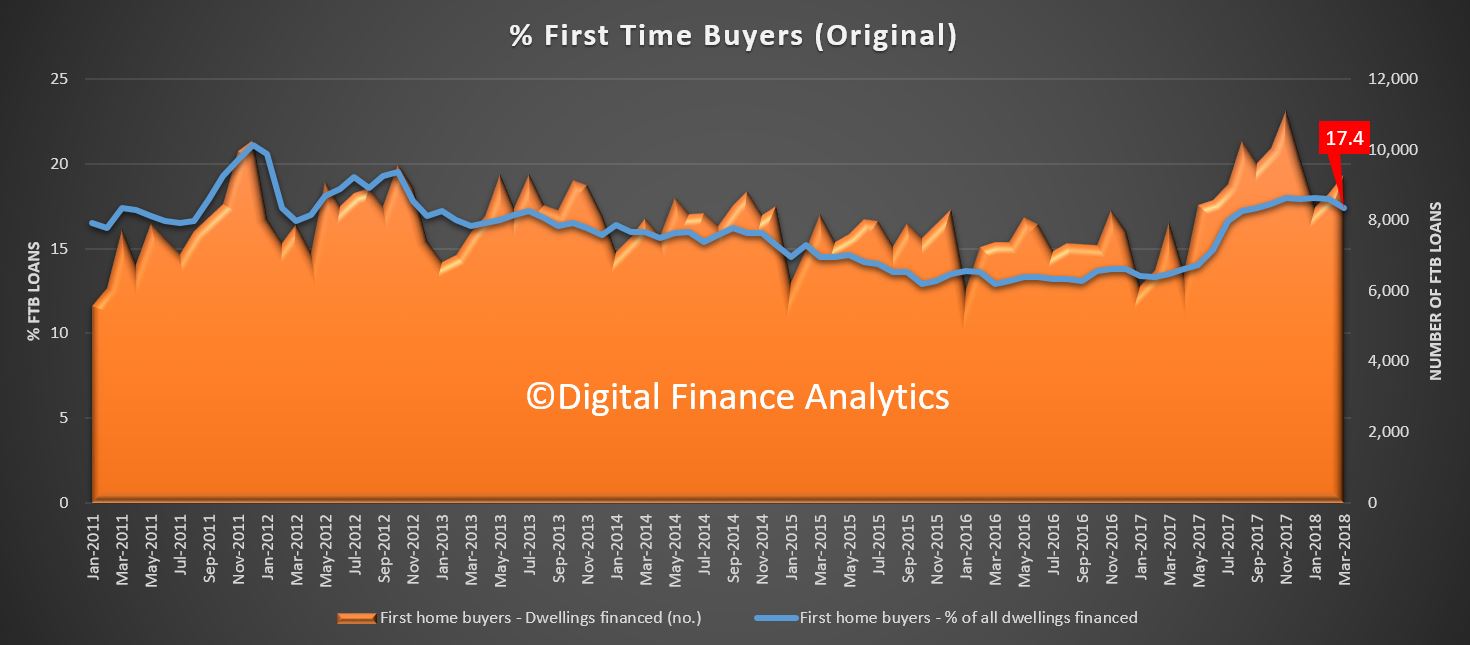
 Overall volumes were 17.4% of new loans written compared with 17.9% in February, which is a little higher than 2016, but is appears to be drifting lower now, suggesting that ahead volumes of new loans may fall a little.
 Looking at the FTB month on month movements, we see a 5.9% uplift in flows which equates to an extra 515 loans last month. The average loan size rose by 2.3% to$335,400.
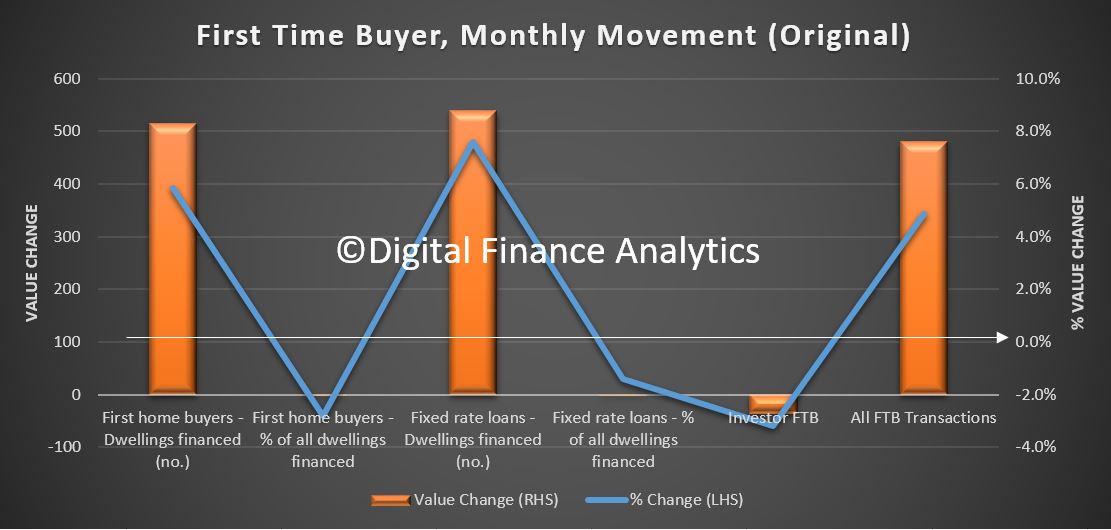 Looking at our overall first time buyer tracker, we see a fall in overall volumes, as the number of first time buyer investors falls away, as captured in our household surveys.
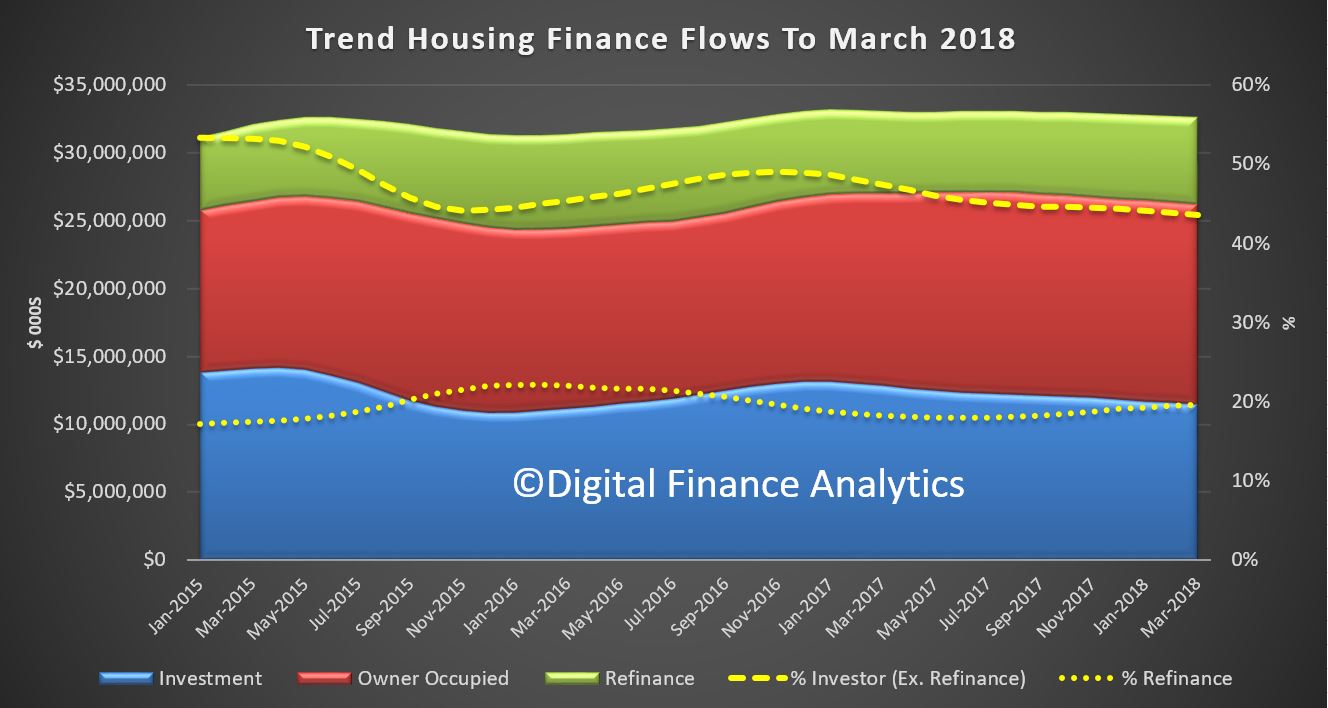
![]() Turning to the 12 month rolling trend, we see that both owner occupied and investor loan flows are slowing, with investor lending shrinking faster.
Turning to the 12 month rolling trend, we see that both owner occupied and investor loan flows are slowing, with investor lending shrinking faster.
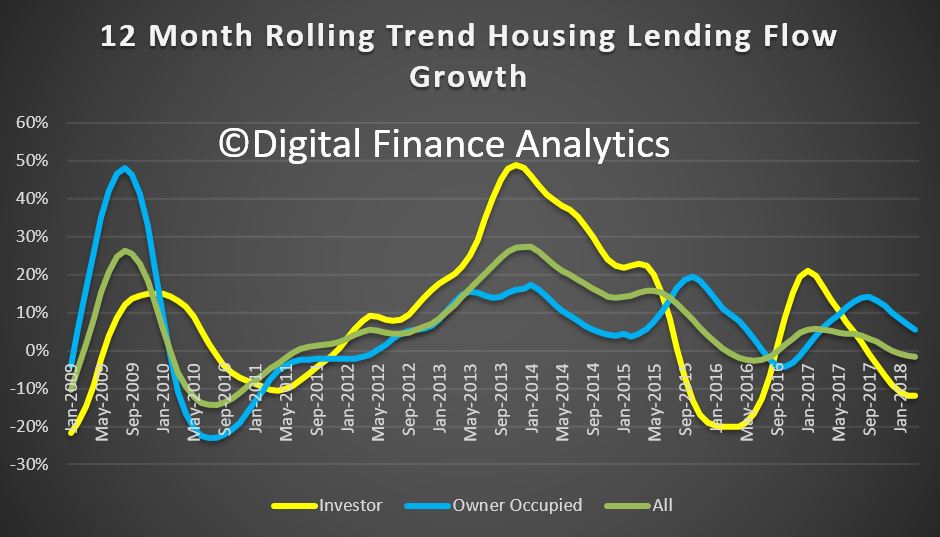 The proportion of investor loan flows slid again (excluding refinance) to 43.6%.
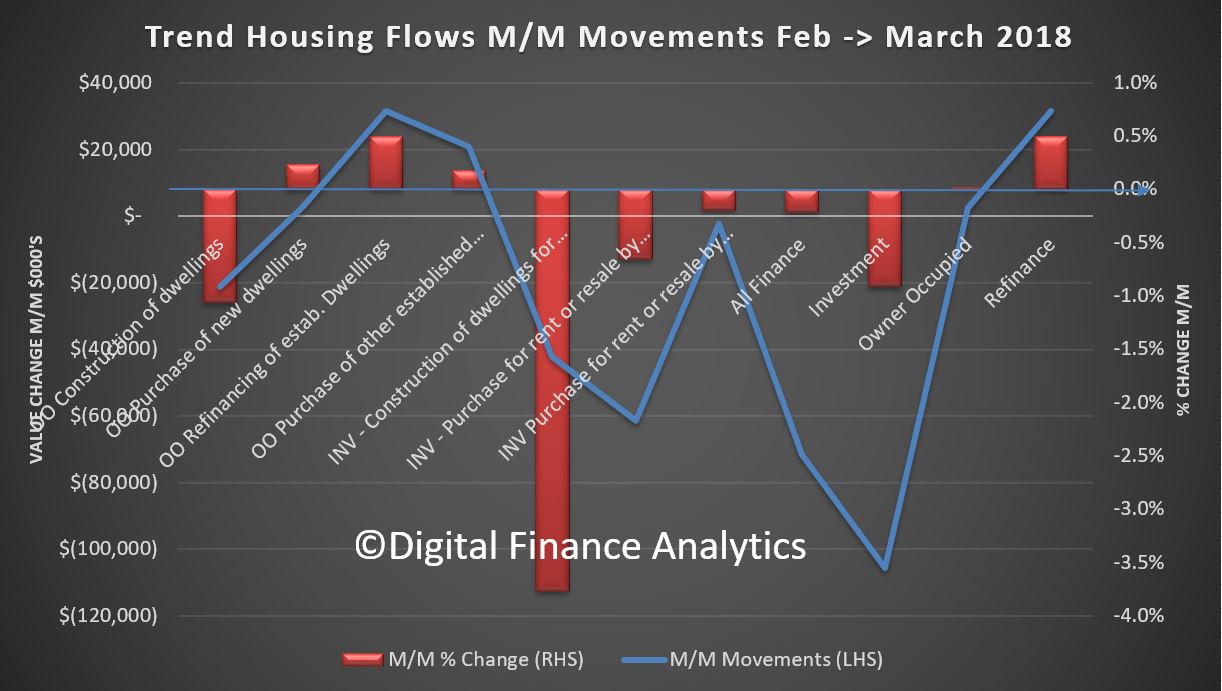
 Looking in more details at the moving parts, in trend terms, lending for owner occupied construction fell 1.1%, owner occupied purchase of new dwellings fell 0.2%, and purchase of other established dwellings rose 0.2%. So overall, owner occupied lending flows, excluding refinance, were flat at $14.8 billion.
Refinance of existing owner occupied loans rose by 0.5% to $6.4 billion, and on the investor side, construction of new property for investment purposes fell 3.8%, purchase of existing property for investment purposes fell 0.7% and purchase of existing property for investment by other entities (e.g. super funds) fell 0.2%. So overall investment flows fell 0.9% to $11.5 billion.
Finally, the total of all finance trend fell overall 0.2% to 32.7 billion.
 And in original terms, the stock of all housing loans rose $6.7 billion, or 0.4% in the month, which equates to 4.9% annualised, still well above inflation or wages growth which is at 2%.
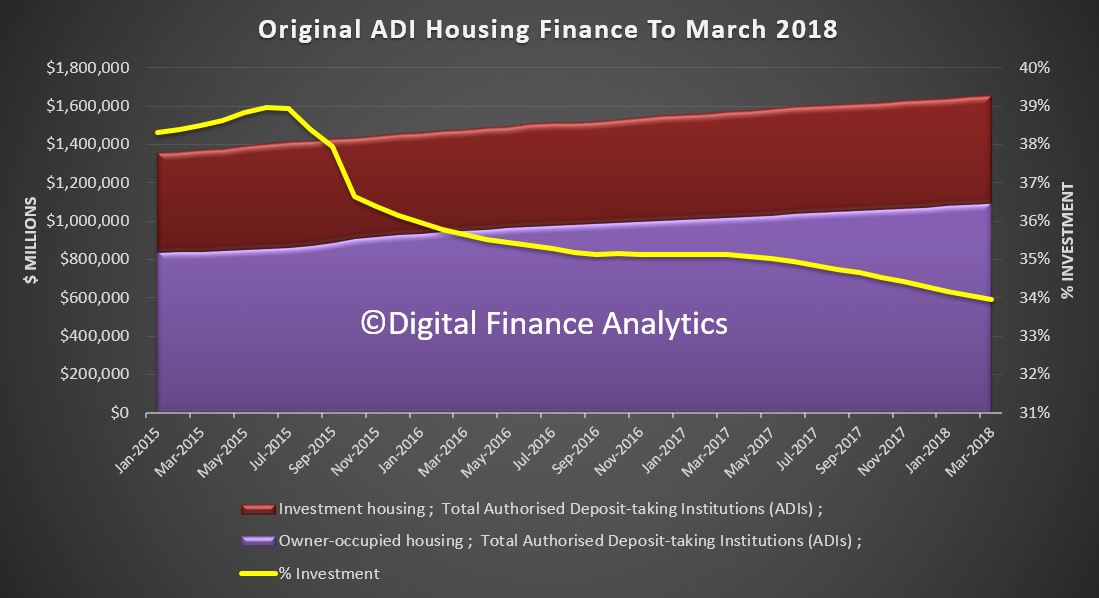 So, the overall growth of lending for housing is still sufficient to lift household debt even higher. So far from losing lending controls, regulators should be seeking to tighten further. There is no justification for growth above inflation or wages, because stronger momentum will only lift the burden on households even further, and inflate the banks’ balance sheets, which flatters their performance.