
The ABS released the latest housing finance statistics to April 2018. They confirm the macro trends we already reported. Lending volume flows are solidly down, and the trends suggest more in the months ahead. We are entering a new phase in the credit cycle, and this will put further pressure on home prices.
The total number of first time buyer loans in the month fell by 8%, from the previous month, down, 740.
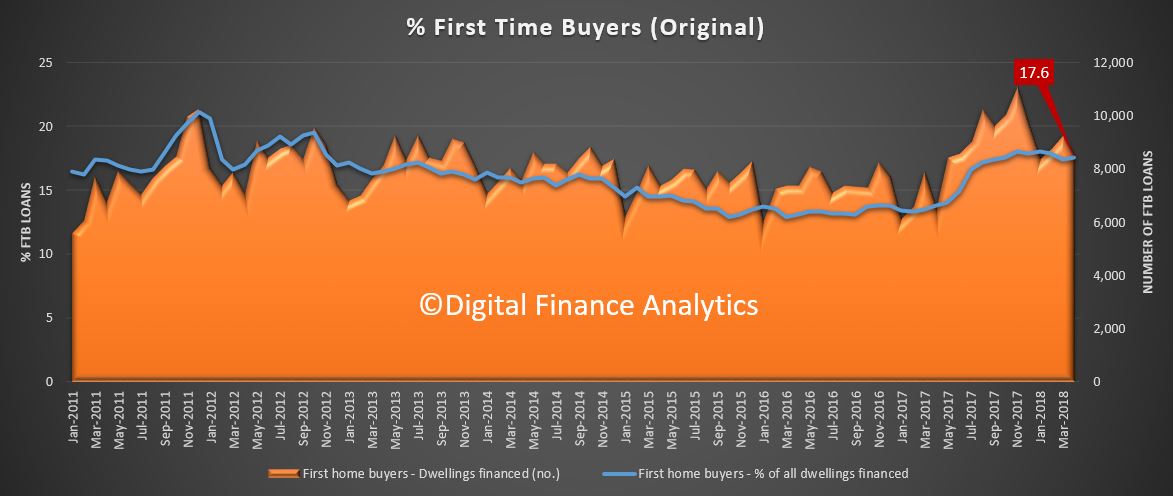 These are original numbers, so they move around, but this is the lowest volume since January. And the volume was equivalent to 17.6% of all buyers, up from 17.4% last month. The number of fixed rate loans also fell.
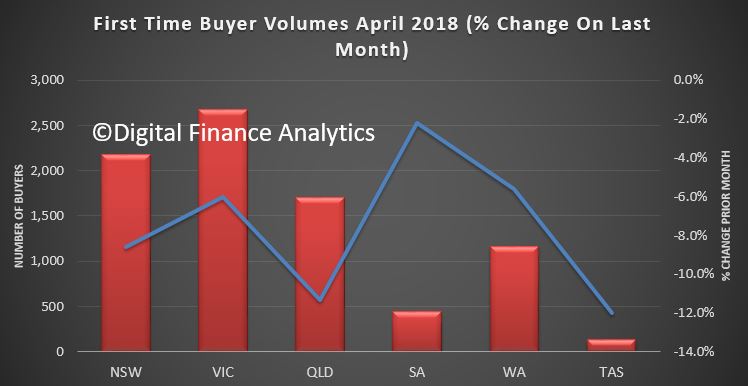
 A fall in number of first time buyers registered across all states, with the largest number in Victoria, at 2,677, down 6% on the prior month, New South Wales was down 8.6% and Queensland was down 11.3%. So this suggests that the first time buyer incentives are running out of puff.
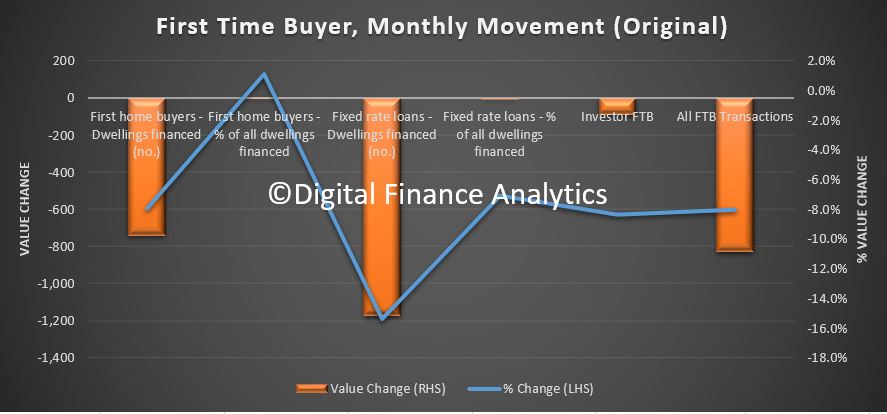
 The number of investor first time buyers also fell and when we overlay this onto the overall first time buyer trends we see a significant drop in flows from a couple of months back. So first time buyers are not going to keep the market up!
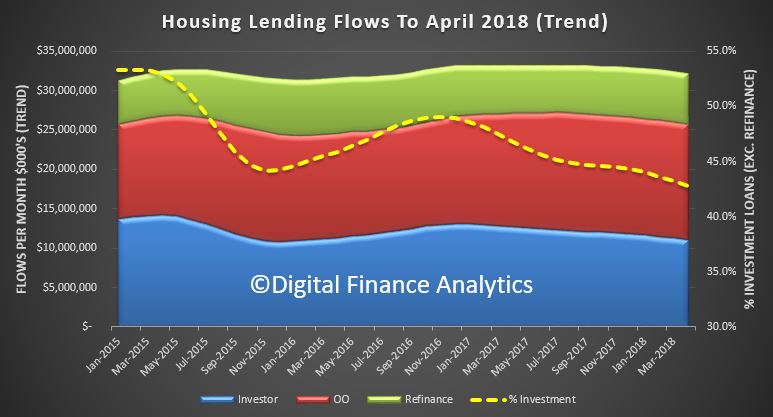
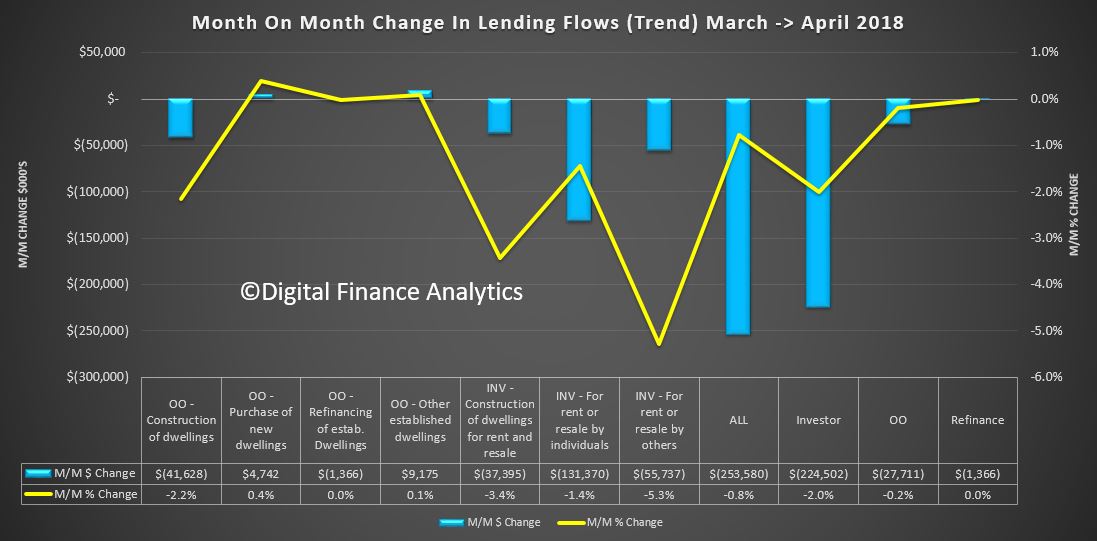
![]() Turning to the overall lending flows, and looking at the trends, we see a fall in pretty much all categories. The proportion of investor loans also fell, down to 42.8 percent of loans approved, excluding refinancing of existing loans, compared with a high of 53% in 2014.
Turning to the overall lending flows, and looking at the trends, we see a fall in pretty much all categories. The proportion of investor loans also fell, down to 42.8 percent of loans approved, excluding refinancing of existing loans, compared with a high of 53% in 2014.
 Across the individual categories, owner occupied lending for construction fell 2.2%, down $41 million, and refinancing of existing dwellings was down just $1 million. However, the purchase of new owner occupied homes rose 0.4% to $4.7 million and the purchase of established dwellings was up 0.1% to $9 million.
On the investment side of the house lending for investment construction fell 3.4% down $37 million while borrowing by individual investors fell 1.4% or $131 million and other investors (such as super funds) fell 5.3%, down $55 million. Overall then investor flows were down 2%, or $224 million and owner occupied lending was down 0.2% or $27 million.
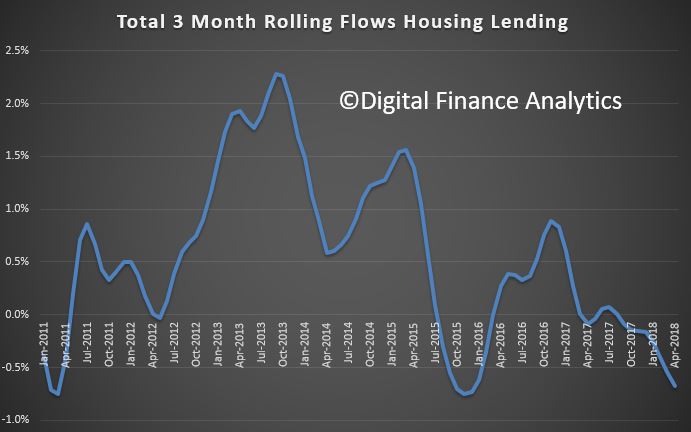
The overall trends are down, as the rolling three month shows, and the trajectory appears lower ahead.
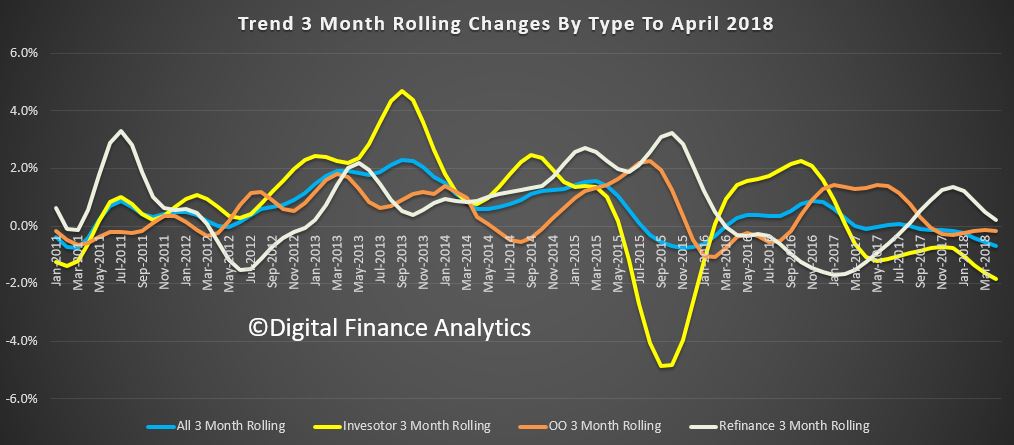
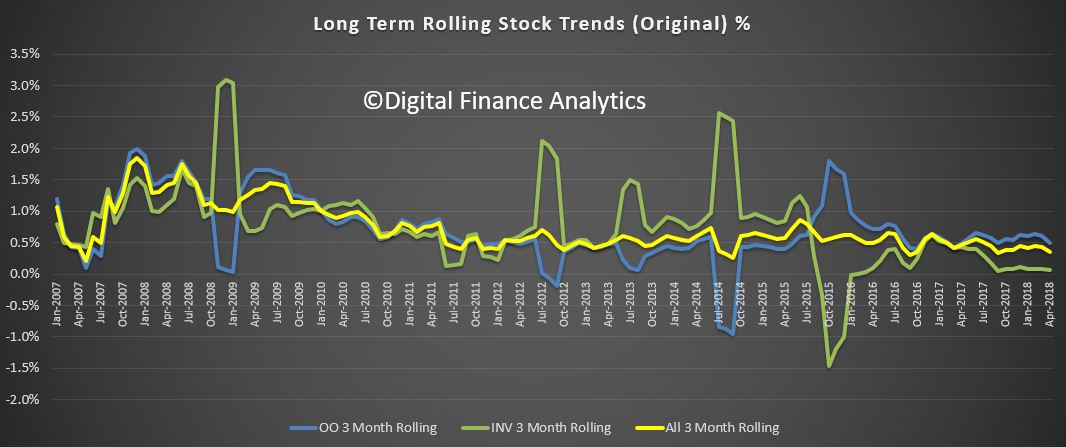
The longer term rolling trend also shows the momentum ebbing, with investor lending flows leading the way down, and refinance also slowing. Note these are based on the trend data which irons out the bumps.
 Finally, the original stock data rose by $2.8 billion, or 0.17%, to $1.66 trillion. Within that owner occupied stock rose by 0.27% or 2.9 billion to 1.09 trillion, and investment lending stock fell by $123 million to $562 billion. Investment lending therefore fell to 33.9% of stock, the lowest since 2012.
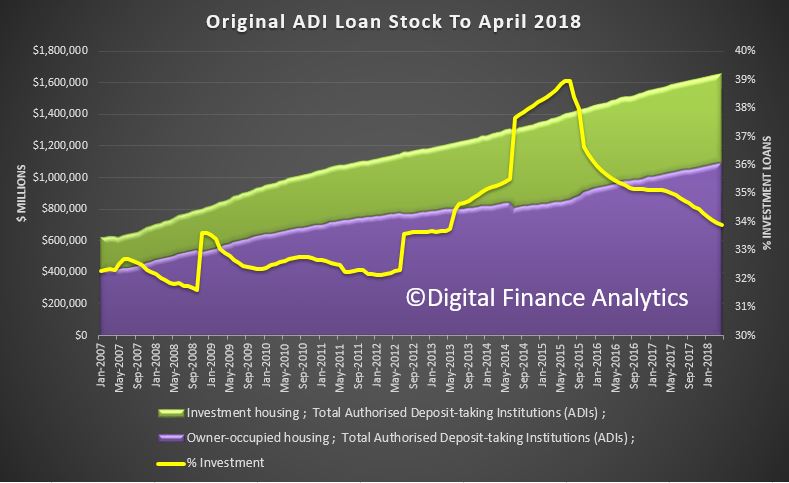
The long term trend tells the story, we are moving into uncharted lending territory, as volumes fall, and this suggests that unlike the large mini clamp-down on mortgage lending in 2016, which lasted just a few months before recovering firmly, the various conditions in the lending market are going to dampen growth further.
 What we do not have is picture of the non-bank sector, which we suspect is picking up some of the slack. Another problem with the myopic data the authorities choose to release.
But the bottom line is there will further contractions in lending in the months ahead, as lending standards get ever tighter, and this will translate into lower home prices ahead.
The real estate boom is firmly over.