The latest Digital Financial Analytics Household Financial Confidence Security Index for May 2018 is released today. The index tests households attitudes to their finances, based on our 52,000 rolling household survey.
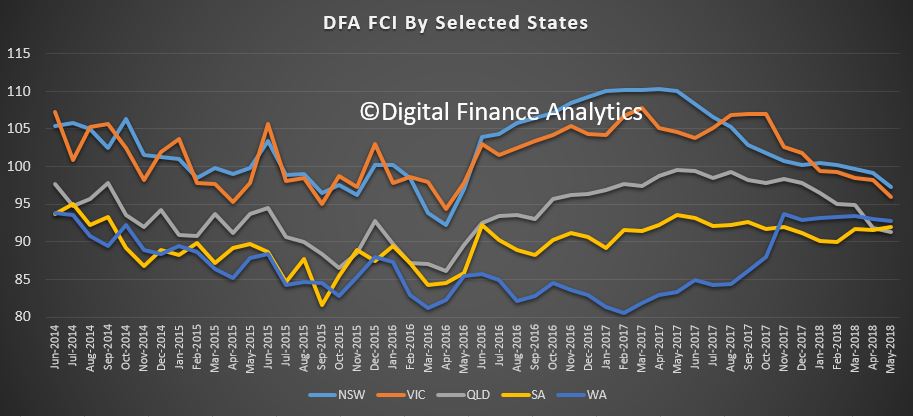
The index dropped to 90.2, down from 91.7 last month. This is below the neutral setting of 100.
 Property-related sentiment is hitting hard, especially in New South Wales and Victoria where price falls are most evident. In Western Australia and South Australia, the index hardly moved compared with last month, and in Queensland it slid just a tad.
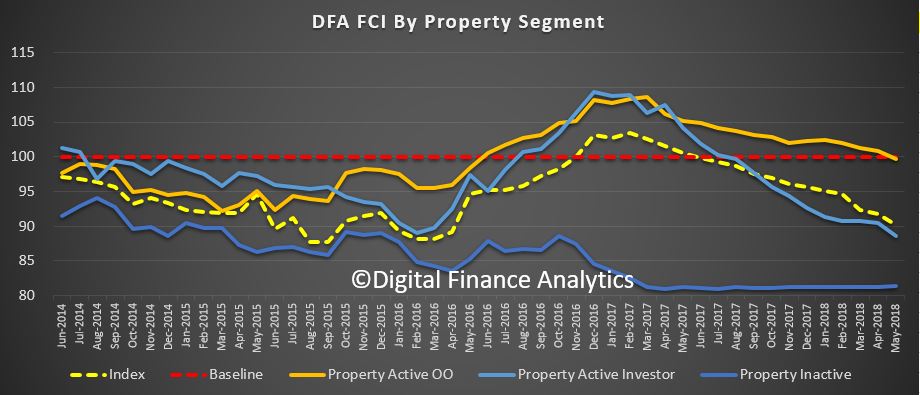
 Looking across our property segments, those not in the property game, and renting or living continue to languish. But we also are tracking falls among property investors, reflecting difficulty in obtain finance, higher interest rates, and falling property prices, and now, also those who are owner occupiers. Both of these property owning segments slid again, mirroring falls in property prices, and the slowing auction clearance rates. That said, those owning property are still relatively more confident about their finances, compared with renters, so the property effect continues.
 Across the age bands, those aged 40-50 were a little more confident, reflecting recent stock market progress, especially among those without mortgages (yes, some have paid down their loans completely), while levels of employment remain pretty good. But for younger households the budget pressure on them remains severe, especially those paying rent, or mortgages. Those entering the retirement phase, 60+ continue to wrestle with outstanding mortgages (many hold these loans into retirement now) and also lower returns from deposits.
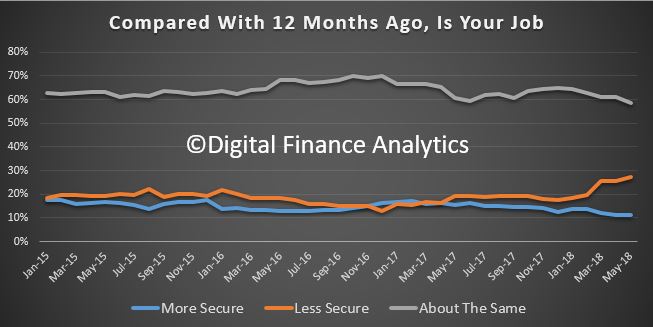
 We can examine the moving parts within the index, to get a sense of what is driving the results. First we look at job security. Something appears to be happening here, as the proportion feeling less secure is rising, up 1.7% compared with last month. There was also a fall by 2.4% of those reporting no change in sentiment compared with last month. Below the hood, it appears that more are involved in multiple part-time jobs, and becoming swept up in the gig economy. Zero-hours contracts appear to be on the rise in some industry sectors. So, while the number of jobs created may be north of one million as the Government often says, we question the quality of these jobs, and their security. Our index reveals another perspective.
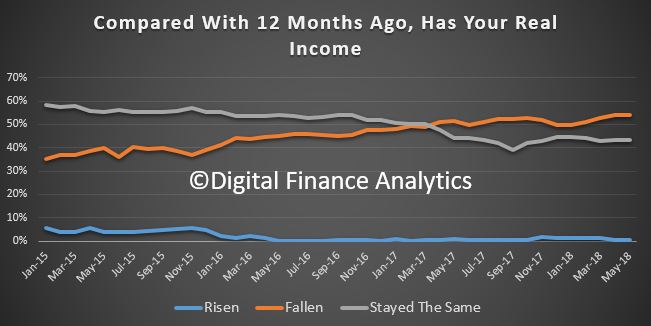
 This may also help to explain the fall in real income (after inflation) many households are experiencing. 54% of households said their incomes had fallen in the past year, and only a small fraction report a rise. 43% say there has been no change since June 2016. There are a number of drivers here, but the main one is simply no, or low pay rises, adjustments to overtime rates, and lower returns from bank deposits. Many older households rely on income from savings and this in under pressure with the current low interest rates, and banks trimming their deposit rates too boot.
 On the other hand, the costs of living continue higher. Nearly 81% of households say their costs are higher than a year ago, up 2% on last month. The litany of rising categories includes electricity, fuel, health care costs, school fees and child care costs. But households are also reporting higher costs at the supermarket, and a tendency to eat in, rather than out, to keep costs under control. More also turning to credit cards, or pulling equity from their properties to keep the household afloat.
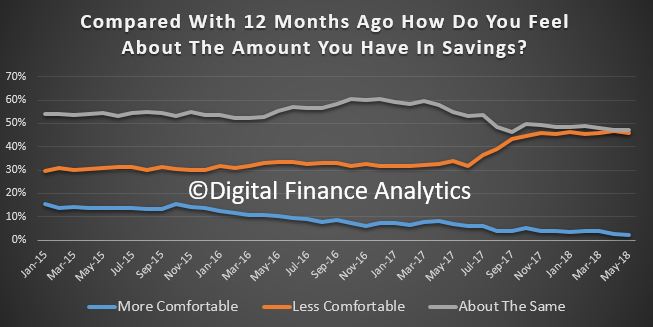
 On the savings front, more are concerned about the amount they have for emergencies. Just 2% are more comfortable compared with last month, while 46% are less comfortable, up 1% on last month. The interest rates offered on bank deposits continue to fall, and this is impacting many who rely on a regular savings generated income. Those who are in the stock market are a little more positive, but the recent crash in bank shares following the revelations from the Royal Commission, and other adverse events, translates to lower confidence. Its worth remembering that nearly half of dividends paid last year came from the financial sector.
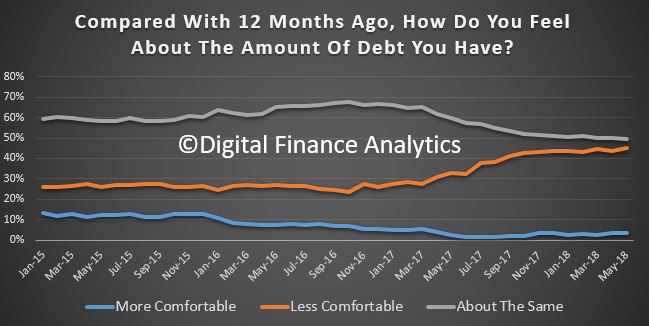
 Households continue to feel the pressure from debt. 45% of households are less comfortable with the debt they owe, up 0.6% from last month. Around 49% remain the same as a year ago, and 3% are more comfortable. The drivers relate to larger mortgages, and higher real mortgage rates (despite some refinancing to gain a lower rate); the inability to get mortgage funding due to tighter lending standards, and a rise in equity withdrawals and some areas of personal credit. While personal credit balances overall are falling, personal debt is concentrated in households with larger mortgages and here it is rising. Payday lending is also on the rise. In addition, households are concerned about the prospect of higher interest rates ahead. Many are stuck in the debt machine.
 Finally, and putting the data together, we look at net worth – defined as assets less loans outstanding. 47% of households say their net worth has improved over the past year, down 4% on last month, as property values slide and household debt rises. 22% reported their net worth was lower, up 2% compared with last month and 28% said there was no change in the past year.
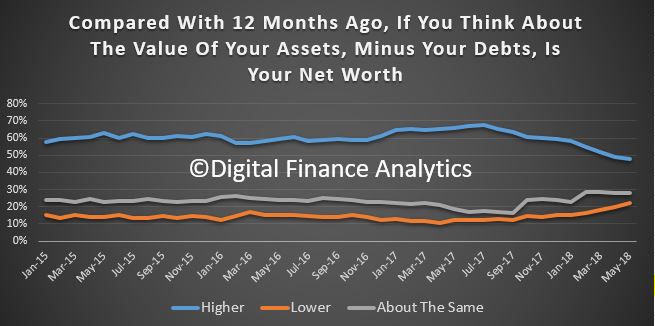 So, the pressures on household finances are clearly visible in these results, and bearing in mind the expected continued fall in home prices, and the prospect of interest rate hike, plus flat incomes, we expect the trend to continue to weaken in the months ahead.
This is certainty a different read compared with the recent headlines of jobs and GDP growth, and it shows the disconnection between the top-line narrative, and the real experiences of households across the country.
Whilst banks have reduced their investor mortgage interest rates to attract new borrowers, we believe there will also be more pressure on mortgage interest rates as funding costs rise, and lower rates on deposits as banks trim these rates to protect their net margins. In the last reporting round, the banks were highlighting pressure on their margins as the back-book pricing benefit from last year ebbs away.
By way of background, these results are derived from our household surveys, averaged across Australia. We have 52,000 households in our sample at any one time. We include detailed questions covering various aspects of a household’s financial footprint. The index measures how households are feeling about their financial health. To calculate the index we ask questions which cover a number of different dimensions. We start by asking households how confident they are feeling about their job security, whether their real income has risen or fallen in the past year, their view on their costs of living over the same period, whether they have increased their loans and other outstanding debts including credit cards and whether they are saving more than last year. Finally we ask about their overall change in net worth over the past 12 months – by net worth we mean net assets less outstanding debts.
We will update the index next month.

