
Macquarie Group released their 1H19 results today, and continues its strong run, benefiting from its international business portfolio. International income accounted for 67 per cent of the Group’s total income. The Capital Markets business performed strongly.
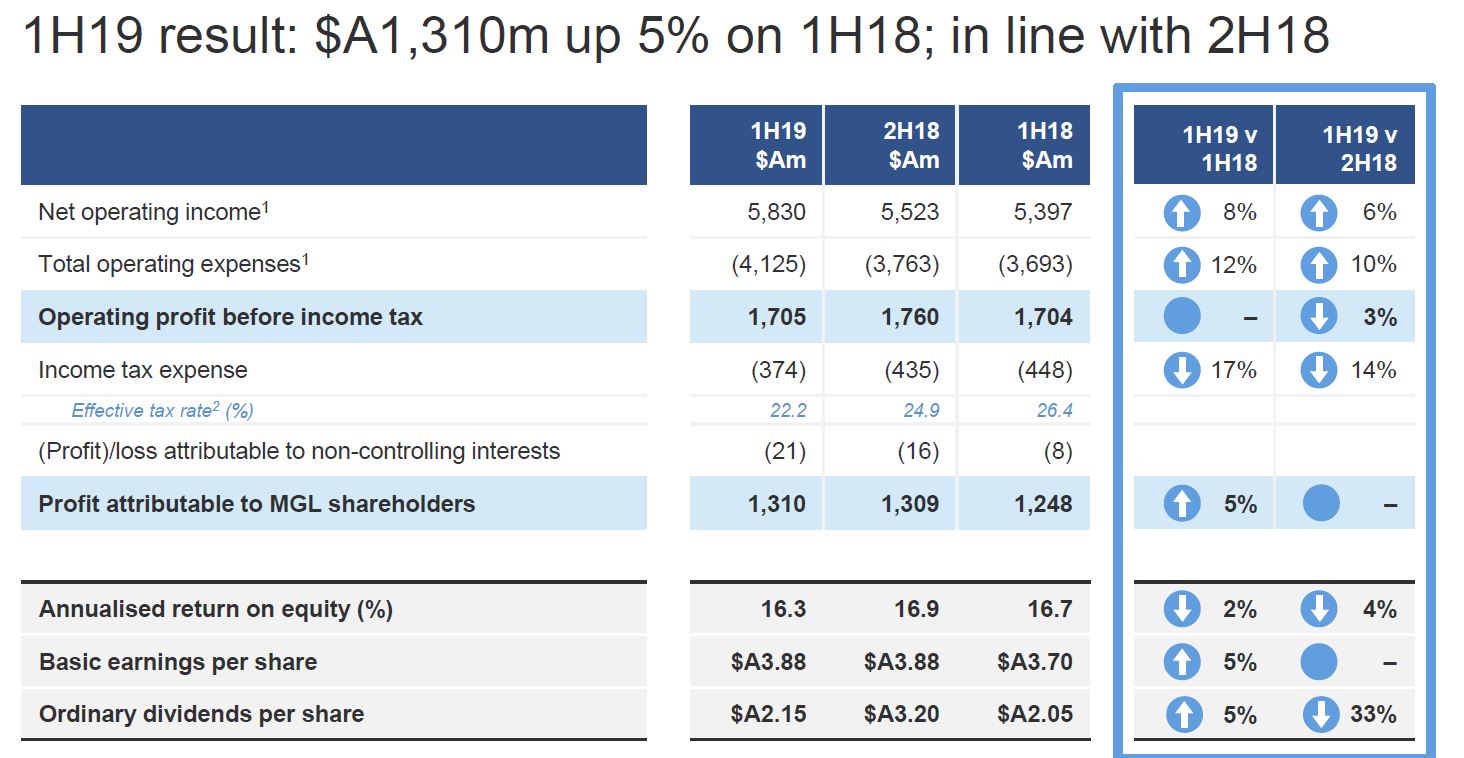
![]() They announced a net profit after tax attributable to ordinary shareholders of $A1,310 million for the half-year ended 30 September 2018 (1H19), up five per cent on the half-year ended 30 September 2017 (1H18) and in line with the half-year ended 31 March 2018 (2H18).
They announced a net profit after tax attributable to ordinary shareholders of $A1,310 million for the half-year ended 30 September 2018 (1H19), up five per cent on the half-year ended 30 September 2017 (1H18) and in line with the half-year ended 31 March 2018 (2H18).
 Macquarie’s annuity-style businesses (Macquarie Asset Management (MAM), Corporate and Asset Finance (CAF) and Banking and Financial Services (BFS)), which represented approximately 60 per cent of the Group’s 1H19 performance, generated a combined net profit contribution of $A1,495 million, down 29 per cent on 1H18 and up 10 per cent on 2H18.
Macquarie’s capital markets facing businesses (Commodities and Global Markets (CGM) and Macquarie Capital) delivered a combined net profit contribution of $A1,106 million, up 95 per cent on 1H18 and up six per cent on 2H18.
Net operating income of $A5,830 million in 1H19 was up eight per cent on 1H18 and up six per cent on 2H18, while operating expenses of $A4,125 million were up 12 per cent on 1H18 and up 10 per cent on 2H18.
Macquarie’s assets under management (AUM) at 30 September 2018 were $A551.0 billion, up 11 per cent from $A496.7 billion at 31 March 2018, primarily due to investments made by Macquarie Infrastructure and Real Assets (MIRA) managed funds, foreign exchange impacts, positive market movements and contributions from businesses acquired during the period, namely GLL Real Estate Partners and ValueInvest Asset Management S.A.
Macquarie also announced today a 1H19 interim ordinary dividend of $A2.15 per share (45 per cent franked), up five per cent on the 1H18 interim ordinary dividend of $A2.05 per share (45 per cent franked) and down 33 per cent on the 2H18 final ordinary dividend of $A3.20 per share (45 per cent franked). This represents a payout ratio of 56 per cent. The record date for the final ordinary dividend is 13 November 2018 and the payment date is 18 December 2018.
Half-year result overview
Net operating income of $A5,830 million for 1H19 was up eight per cent on 1H18, while total operating expenses of $A4,125 million were up 12 per cent on 1H18.
Key drivers of the change from 1H18 were:
- An 18 per cent increase in combined net interest and trading income to $A2,229 million, up from $A1,892 million in 1H18. The movement was mainly due to increased contribution across the commodities platform and growth in deposit and Australian loan portfolios in BFS. This was partially offset by reduced income from early repayments, realisations and the reduction in the size of the CAF Principal Finance portfolio.
- A four per cent increase in fee and commission income to $A2,661 million, up from $A2,568 million in 1H18, due to: an increase in brokerage commission in Futures and Cash equity markets from increased market turnover and client activity in Asia; an increase in CGM equity capital markets fee income in the Asia-Pacific; higher fee income from mergers and acquisitions, debt capital markets and equity capital markets in Macquarie Capital; and a $A141 million increase in income offset in operating expenses following the adoption of AASB 15 Revenue from Contracts with Customers on 1 April 2018. This was partially offset by lower performance fees compared to a strong prior corresponding period in MAM.
- A two per cent decrease in net operating lease income to $A461 million, down from $A469 million in 1H18, due to a reduction in underlying Aviation income partially offset by improved income from the Energy and Technology portfolios and favourable foreign exchange movements in CAF.
- Share of net profits of associates and joint ventures of $A7 million in 1H19 decreased from $A103 million in 1H18, primarily due to losses from associates and joint ventures reflecting expenditure on green energy and other projects in the development phase in Macquarie Capital partially offset by an increase in share of net profits from the sale and revaluation of a number of underlying assets within equity accounted investments in MAM.
- Other operating income and charges of $A472 million in 1H19, up 29 per cent from $A365 million in 1H18. The primary drivers were lower credit and other impairment charges compared to 1H18 which recognised impairments relating to legacy assets in Corporate and underperforming financing facilities in CGM; higher investment income primarily due to gains generated across unlisted investments in the green energy and technology sectors in Macquarie Capital; and an increase in other income predominantly relating to asset sales in CAF. This was partially offset by the non-recurrence of gains on reclassification on certain investments in MAM and a UK toll road investment by CAF as well as expenditure in green energy projects in the development phase in Macquarie Capital.
- Total operating expenses of $A4,125 million in 1H19 increased 12 per cent from $A3,693 million in 1H18, mainly due to higher average headcount across the Group; unfavourable foreign currency movements, higher project activity in BFS; increased investment in technology platforms in CGM; a $A141 million increase in fee expenses offset in fee and commission income following the adoption of AASB 15 on 1 April 2018; and increased business activity in the majority of operating groups.
Staff numbers were 14,869 at 30 September 2018, up from 14,469 at 31 March 2018.
The income tax expense for 1H19 was $A374 million, a 17 per cent decrease from $A448 million in 1H18. The decrease was mainly due to a reduction in US tax rates and the geographic composition and nature of earnings. The effective tax rate for 1H19 was 22.2%, down from 26.4% in the prior corresponding period and 24.9% in the prior period.
Operating group performance
- Macquarie Asset Management delivered a net profit contribution of $A762 million for 1H19, down 36 per cent from $A1,189 million in 1H18. Performance fee income of $A282 million was down from a strong prior corresponding period of $A537 million which included performance fees from MEIF3, Atlas Arteria – ALX (formerly Macquarie Atlas Roads) and other managed funds, Australian managed accounts and co-investors. Base fees of $A884 million were up 11 per cent from $A795 million in 1H18, benefiting from: investments made by MIRA-managed funds; increases in AUM primarily driven by foreign exchange impacts and positive market movements; and contributions from businesses acquired during the period (GLL Real Estate Partners and ValueInvest Asset Management S.A.). This was partially offset by asset realisations by MIRA-managed funds. Investment-related income was lower than the prior corresponding period which included gains on reclassification of certain investments.
- Corporate and Asset Finance delivered a net profit contribution of $A437 million for 1H19, down 29 per cent from $A619 million in 1H18. The decrease was mainly driven by reduced income from early repayments, realisations and investment-related income and lower portfolio volumes in Principal Finance. The Asset Finance contribution was broadly in line with 1H18 driven by improved income from the Energy and Technology portfolios offset by lower underlying net operating lease income in Aviation. The remaining portfolios continued to perform well. CAF’s asset and loan portfolios of $A33.7 billion decreased two per cent from 31 March 2018.
- Banking and Financial Services delivered a net profit contribution of $A296 million for 1H19, up three per cent from $A286 million in 1H18. The improved result reflects increased income from growth in deposits, the Australian loan portfolio and funds on platform partly offset by the entire period effect of the Australian Government Major Bank Levy relative to the prior corresponding period and increased costs associated with investment in technology projects and headcount in key areas to support business growth. 1H19 also includes expenses associated with bringing together the private bank and private wealth businesses. Total BFS deposits5 of $A49.4 billion increased eight per cent on 31 March 2018 and funds on platform6 of $A88.1 billion increased seven per cent on 31 March 2018. The Australian mortgage portfolio of $A36.1 billion increased 10 per cent on 31 March 2018, representing approximately two per cent of the Australian mortgage market.
- Commodities and Global Markets delivered a net profit contribution of $A700 million for 1H19, up 85 per cent from $A378 million in 1H18. The result primarily reflects an increased contribution across the commodities platform driven by: client activity; improved trading opportunities; increased fee and commission income in Asia driven by increased market turnover and client activity; and an increased contribution from equity capital markets fee income in Asia-Pacific. This was partially offset by: reduced opportunities and challenging markets impacting equity trading activities; increased operating expenses reflecting increased client activity; the impact of acquisitions completed in the prior year; and an increase in technology investment.
- Macquarie Capital delivered a net profit contribution of $A406 million for 1H19, up 114 per cent from $A190 million in 1H18. The result reflects: higher investment income; higher fee income from both debt and equity capital markets; and higher mergers and acquisitions fee income. During 1H19, Macquarie advised on 228 transactions valued at $A267 billion7 including as joint financial adviser to the Sydney Transport Partners consortium on its acquisition of a 51 per cent interest in WestConnex from the NSW Government for $A9.3 billion; and joint lead manager, bookrunner and underwriter to Transurban Group on its $A4.2 billion entitlement offer, the largest M&A fund raising by an ASX-listed company in the last decade8. During 1H19, Macquarie Capital completed a number of balance sheet transactions including the acquisition and development of a 235MW onshore wind farm (under construction) in central Sweden and raised €270 million of related construction financing. In addition, Macquarie Capital successfully exited its investment in TriTech Software Systems and subsequently acted as financial adviser on its merger with Superion and Aptean and joint bookrunner on the $US1.0 billion related financing.
Total customer deposits9 increased nine per cent to $A52.3 billion at 30 September 2018 from $A48.1 billion at 31 March 2018. During 1H19, $A5.9 billion of new term funding10 was raised covering a range of tenors, currencies and product types.
Capital management
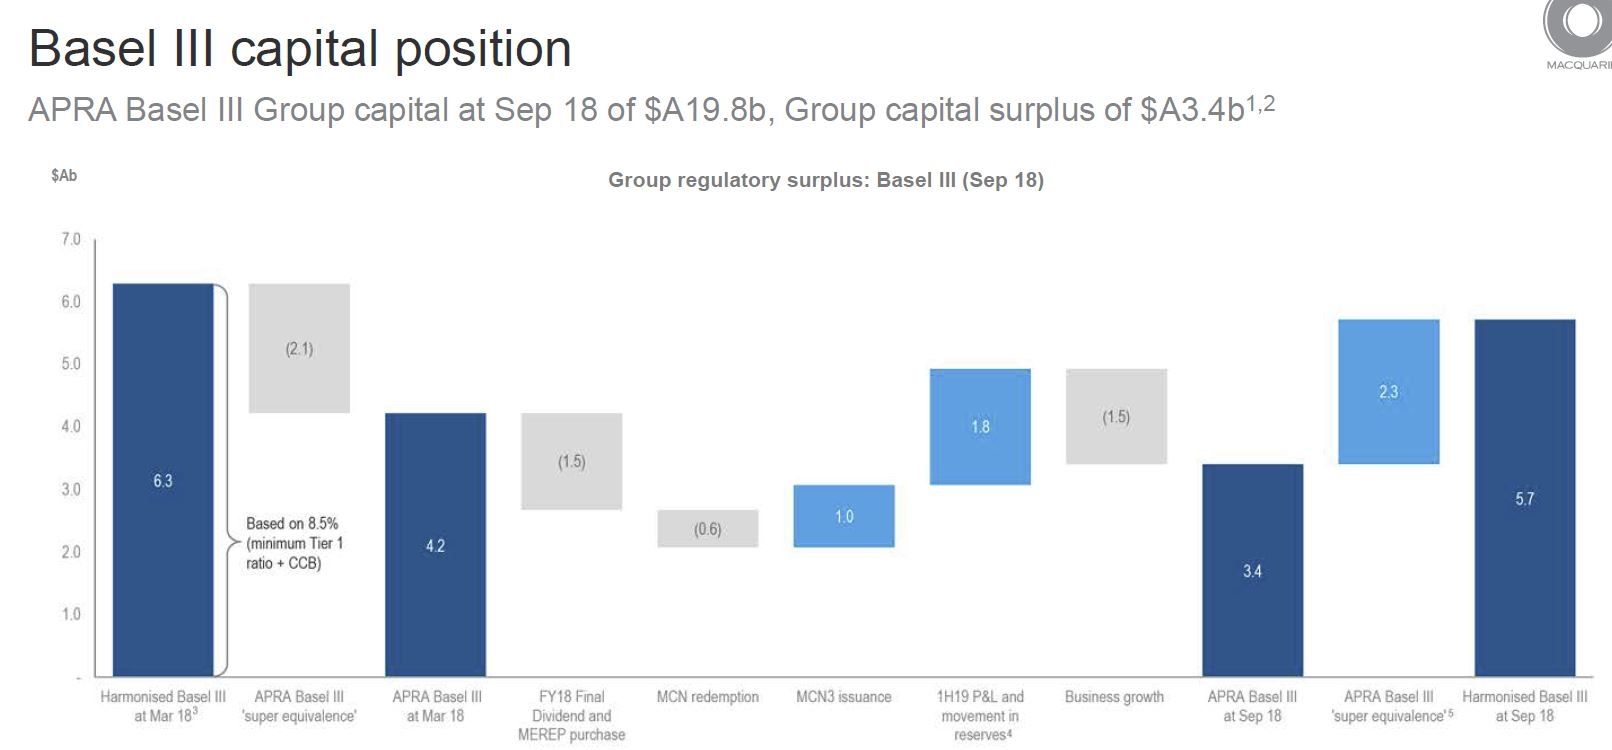
Macquarie’s financial position comfortably exceeds APRA’s Basel III regulatory requirements, with a Group capital surplus of $A3.4 billion at 30 September 2018. This surplus was down from $A4.2 billion at 31 March 2018, following payment of the FY18 final dividend and FY18 Macquarie Group Employee Retained Equity Plan buying requirement, together with strong business growth of $A1.5 billion, partially offset by 1H19 profit and movement in reserves. The Bank Group APRA Basel III Common Equity Tier 1 capital ratio was 10.4 per cent (Harmonised: 13.0 per cent) at 30 September 2018, down from 11.0 per cent (Harmonised: 13.5 per cent) at 31 March 2018. The Bank Group’s APRA leverage ratio was 5.6 per cent (Harmonised: 6.4 per cent), LCR was 159 per cent and NSFR was 110 per cent at 30 September 2018. No discount will apply for the 1H19 Dividend Reinvestment Plan (DRP) and the shares are to be acquired on-market11.
Regulatory update
APRA is yet to release final standards for Australian banks to ensure that their capital levels can be considered ‘unquestionably strong’.
 Based on existing guidance, Macquarie’s surplus capital position remains sufficient to accommodate likely additional requirements. In August 2018, APRA released a discussion paper setting out potential options to improve the transparency, international comparability and flexibility of the capital framework. The proposals are not intended to change the amount of capital that ADIs are required to hold13. In addition, APRA released a discussion paper on their implementation of a minimum requirement for the leverage ratio of four per cent from July 201914. MBL’s leverage ratio is 5.6 per cent as at September 2018.
Share buyback
Given significant business growth in 1H19, Macquarie did not purchase any shares under the share buyback program announced at the 1H18 result announcement. There is currently no prospect of buying any shares under the share buyback program and so the program has ended.
While the impact of future market conditions makes forecasting difficult, the Group currently expects the FY19 result to be up approximately 10 per cent on FY18.