Today we walk through the worst postcodes for mortgage stress and add movement and colour with supporting demographic and financial data.
Yesterday we released the May 2018 mortgage stress and default analysis update. Across Australia, more than 966,000 households are estimated to be now in mortgage stress (last month 963,000). This equates to 30.2% of owner occupied borrowing households.
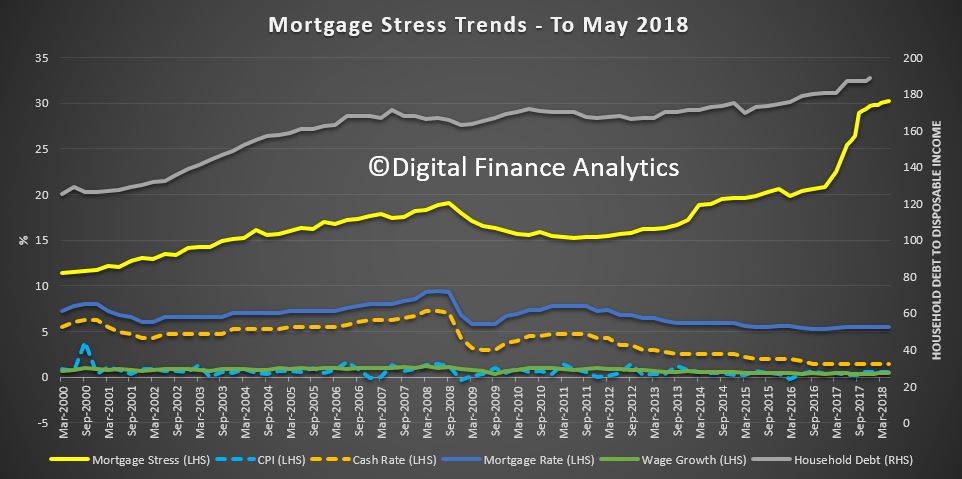 Our analysis uses the DFA core market model which combines information from our 52,000 household surveys, public data from the RBA, ABS and APRA; and private data from lenders and aggregators. Households are defined as “stressed” when net income (or cash flow) does not cover ongoing costs. Probability of default extends our mortgage stress analysis by overlaying economic indicators such as employment, future wage growth and cpi changes. Our Core Market Model also examines the potential of portfolio risk of loss in basis point and value terms.
So now we are going to look in more detail, at the most stressed post codes across the country, by counting down to the most stressed area in the country. In each case we will dive into the vital statistics for each location, including population, income mortgage and loan to income ratios, as well as the number of households in stress.
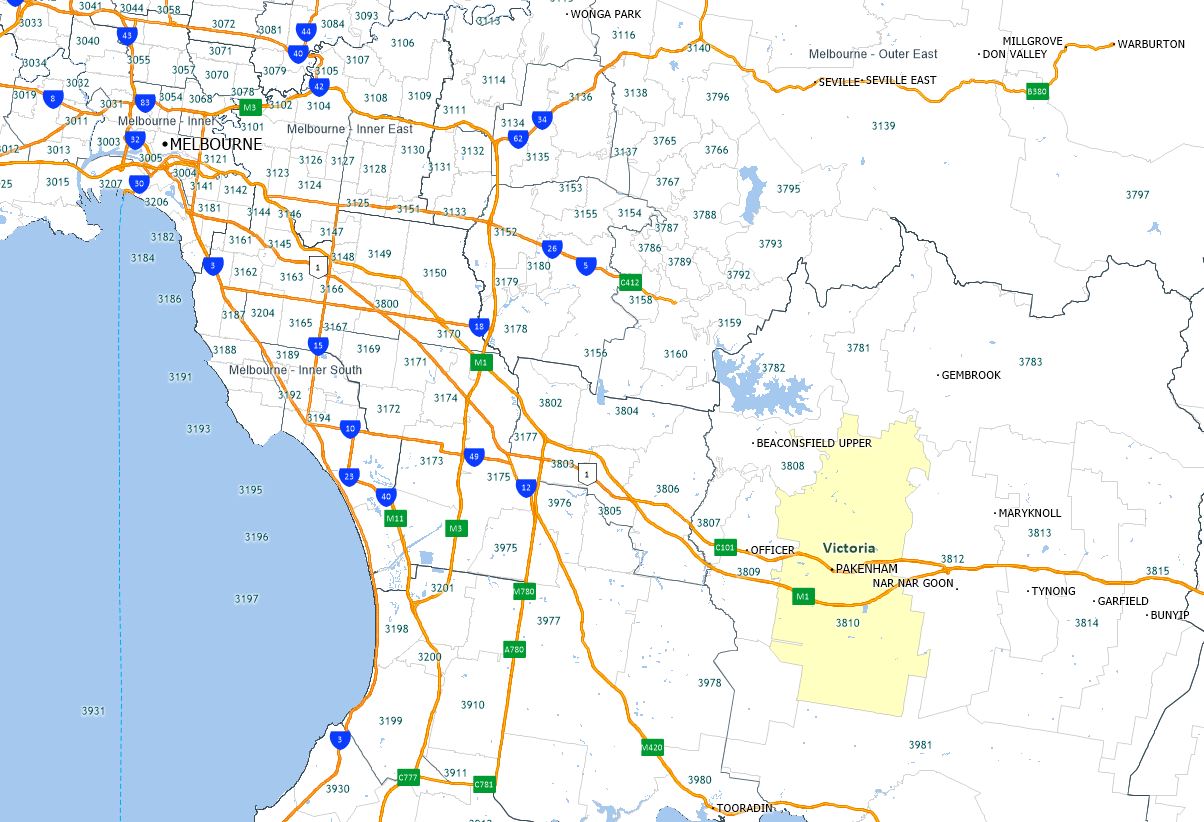
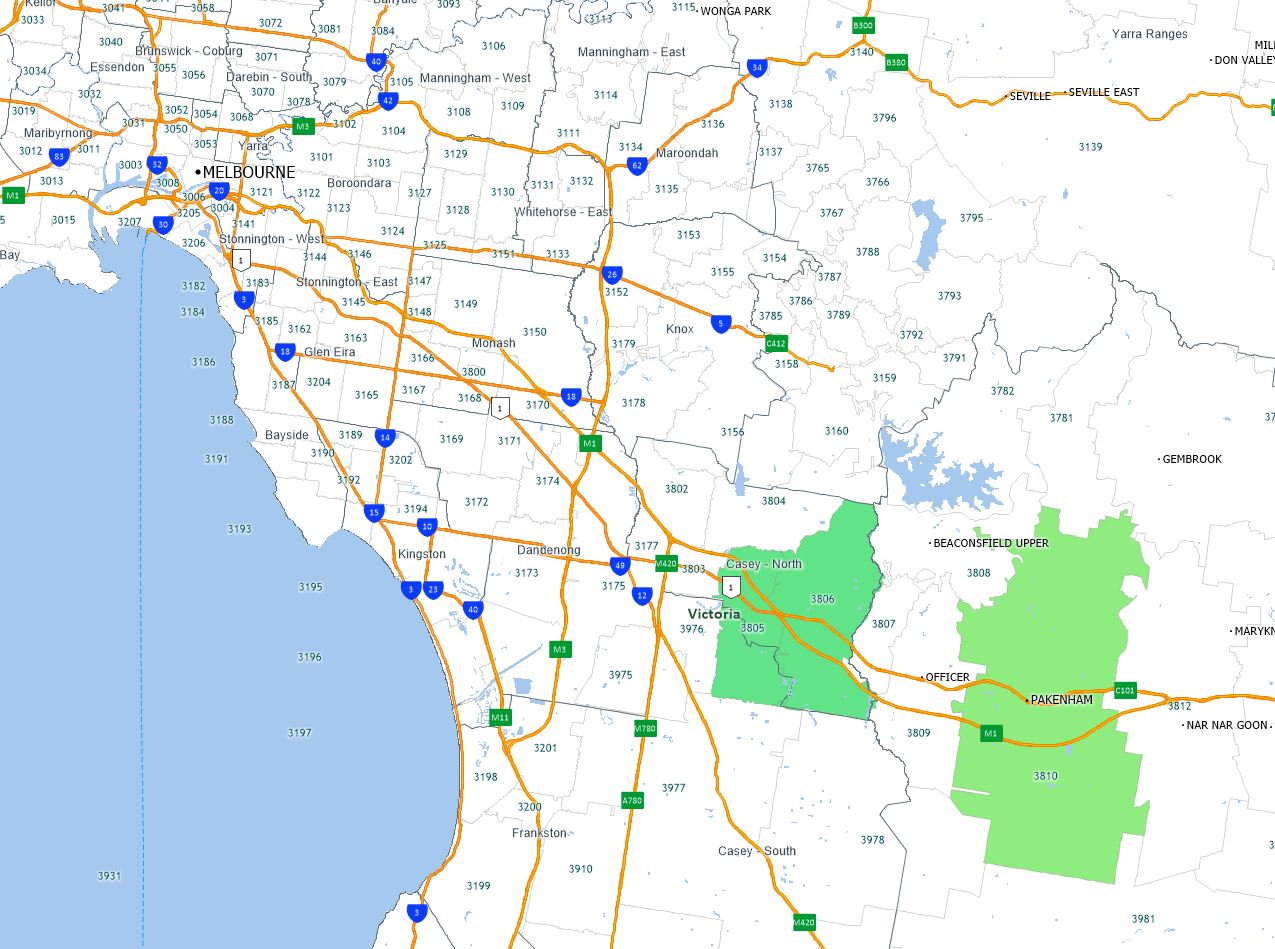
Just outside the top 10 is Victorian post code, 3810, Packenham, with around 4,310 households now in mortgage stress. It is some 54 kms south east of Melbourne. The average home price is around $502,000 compared with $290,000 in 2010. According to the latest census the average age is 32 years and there are more than 12,600 families in the district. The average monthly household income is $5,900, which is below the average in the state as well as nationally. 46% of homes have a mortgage, compared with the Victorian average of 35%. The average monthly mortgage repayment is $1,700, or more than 28% of their average incomes. But 11% are paying more than 30% of their income each month to service their mortgages.
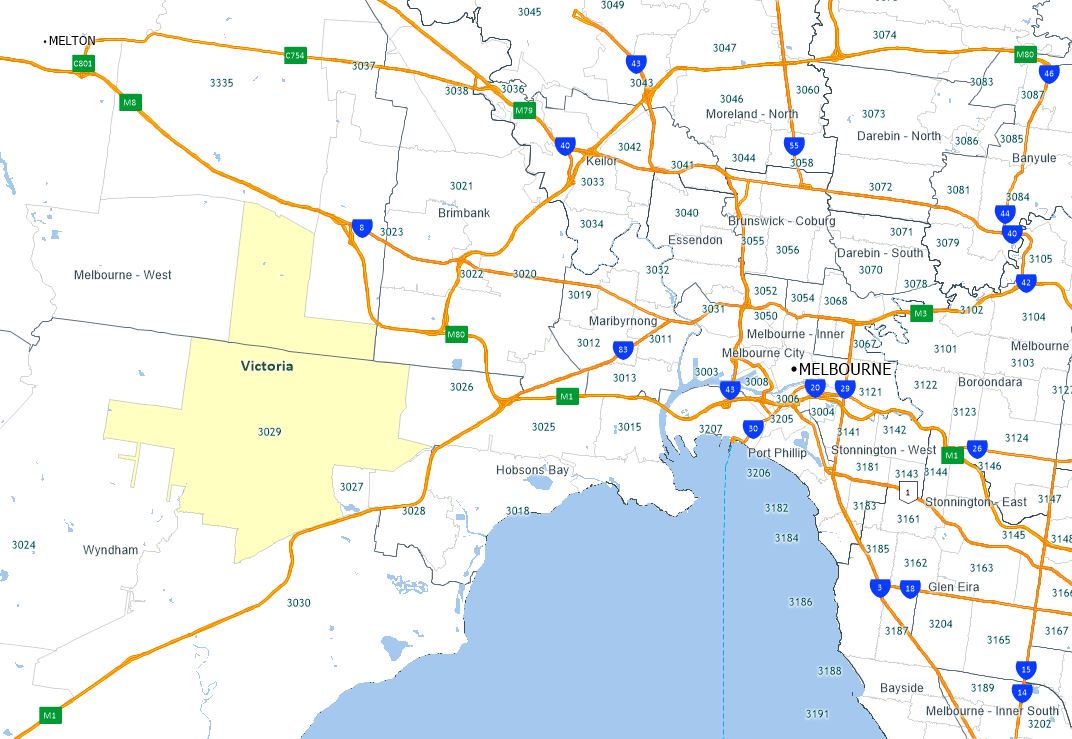
 In tenth place is 3029, another Victorian postcode which includes Hoopers Crossing and Tarneit, around 25 kms from Melbourne CBD. There are about 24,600 households in the district, and the average household income is $6,840 a month. The average mortgage repayment is $1,730 or around 26% of the monthly budget although 12.5% are paying more than 30% of their income on repayments. More than 80% of the dwellings are separate houses and a further 15% are townhouses. Nearly 51% of all properties in the area are mortgaged compared with the VIC average of 35%. The average home price is currently around $545,000 for a house and $378,500 for a unit, compared with $462,000 and $330,000 a year ago.
 Next we go to WA, 6030 which includes Clarkson, Merriawa and Tamala Park, 34 kms north of Perth. There are 4,597 households in mortgage stress in the area, which is home for around 11,000 households. The average age is 34 years. 86% of the properties here are separate houses, and 14% town houses. 51% of the properties are mortgaged, well above the WA average of 40%. The average income each month is and the average mortgage repayment is 2,000. The average proportion of income going on the mortgage is more than 28% but more than 12% have repayments requiring more than 30% of income.
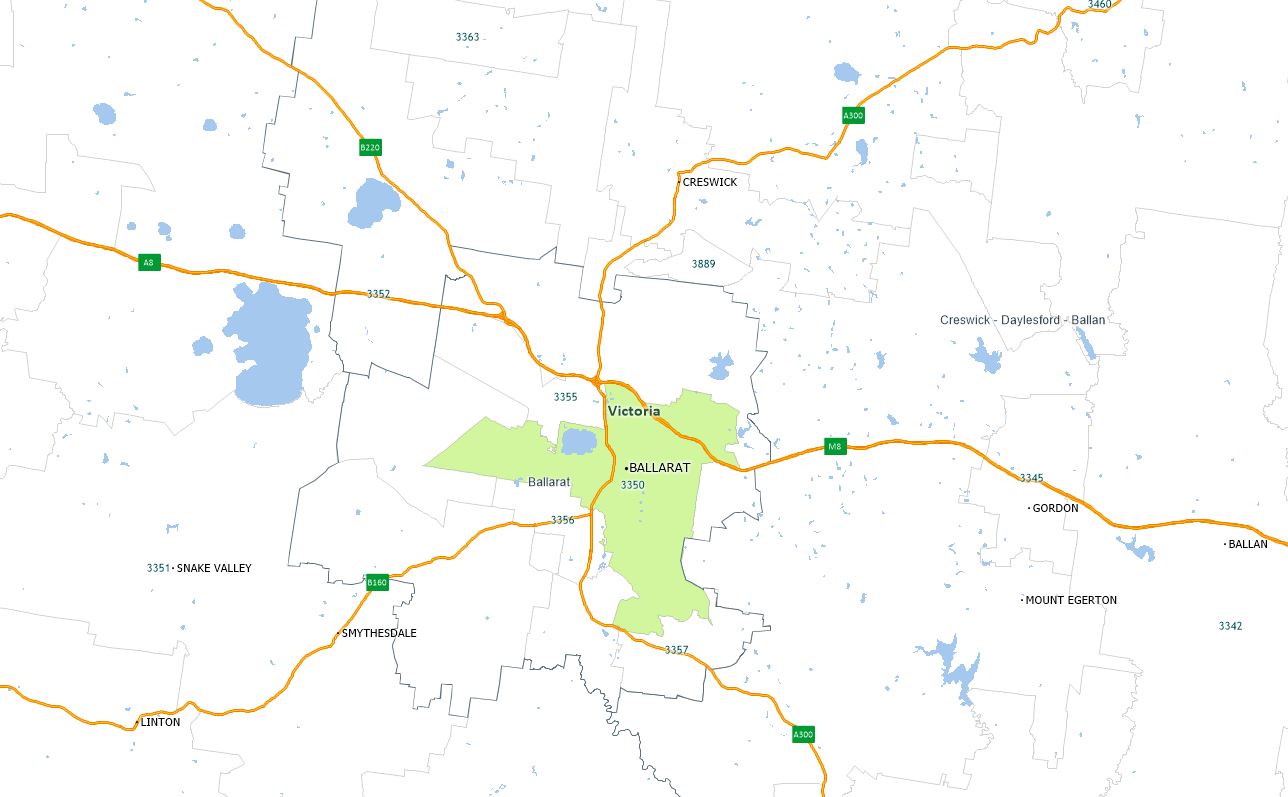
 Next in eighth place is yet another Victorian post code 3350, which includes Ballarat and the surrounding area, It’s about 100 kilometres from Melbourne. In this region there are 4,746 households in mortgage stress. The average property value is $315,000, compared with $281,000 in 2010. There are more than 14,500 families in the area and the average age is 37, line ball with the average across the state. The average monthly income is $5,300, well below the national and state averages. Around 33% of households have a mortgage and the average repayment is $1,408 a month, with an average loan to income ratio of 26.5%, though 5% are above 30%.
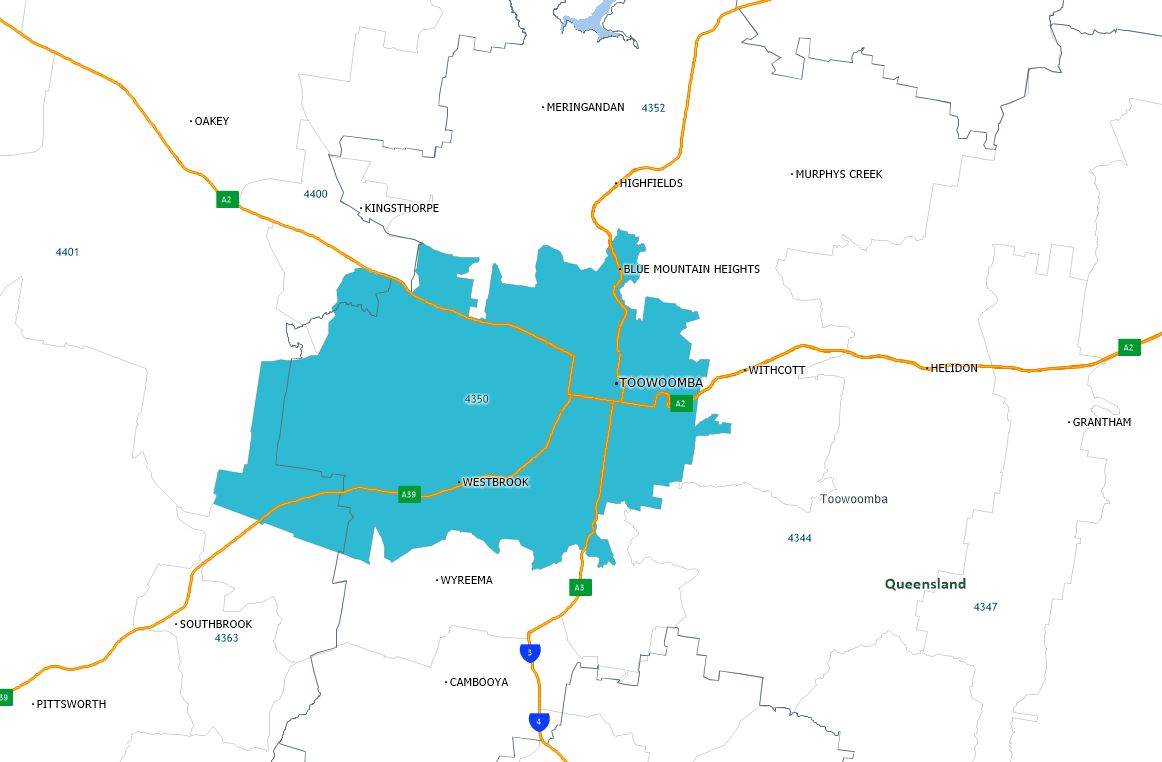
 In Seventh place we go to Queensland 4350, around Drayton and Toowoomba, about 100 kilometres from Brisbane. There are about 27,000 households in the region and the average age is 37. 77% of the properties here are standalone houses, and a further 15% are townhouses. We estimate 5,054 households are in mortgage stress. The average home price is $470,000, compared with $382,000 in 2010. The average income is $5,300 a month. Around 30% have a mortgage and the average mortgage repayment is $1,510 giving an average loan to income of 25%. Just 4% have mortgage commitment above 30% of income.
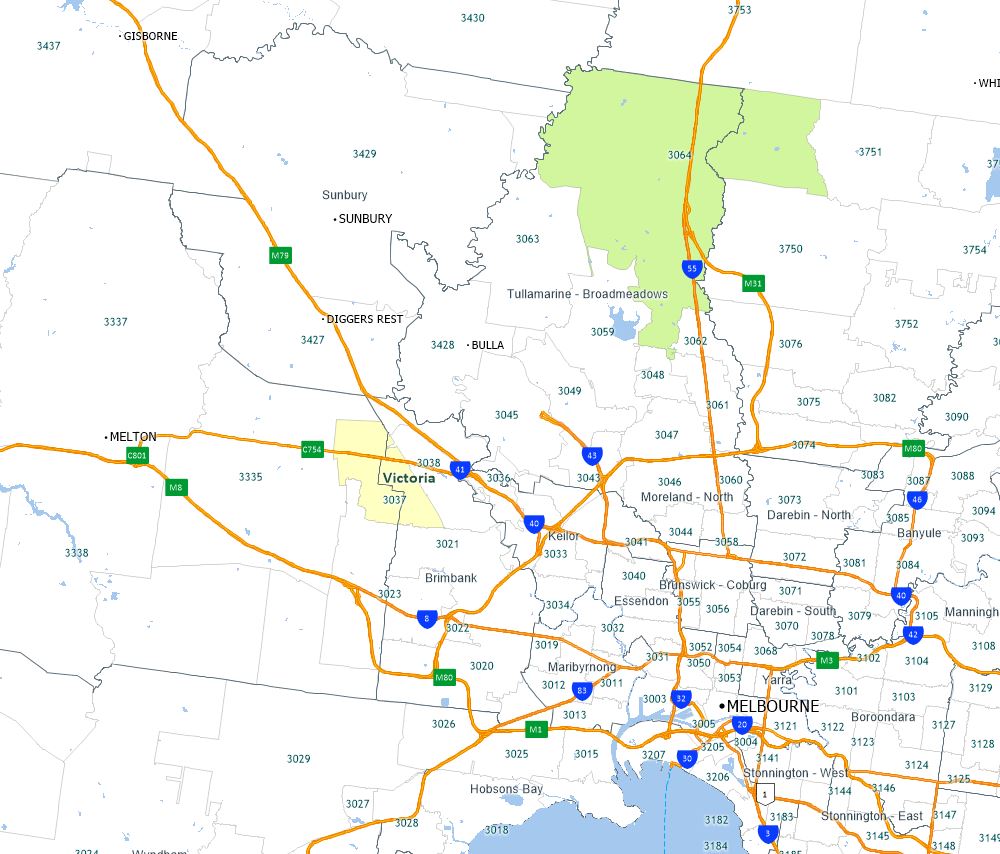
 Next, sixth is 3037, which includes areas around Delahey, Hillside and Sydenham; around 20 kms north west of Melbourne. Here around 5,317 households are in mortgage stress. Of the 13,000 households in the district, more than half have a mortgage and the average age is 33. The average home price is around $570,000, up from $365,000 in 2010. 80% of properties are standalone houses and a further 18% are townhouses. The average monthly income is around $7,200 and the average mortgage repayment is $1,730, with an average loan to income of 24%. But 13% require more than 30% of their income to service their mortgage.
 In fifth place is another Victorian suburb, 3806, Berwick and Harkaway which is around 40 kilometres south east of Melbourne, with 5,461 households in mortgage stress. The average home price is $700,000 compared with $451,000 in 2010. There are around 13,000 families in the area, with an average age of 36. 88% of the properties in the area are standalone houses. More than 47% of households here have a mortgage and the average repayment is $1,850 compared with the average income of $7,600 making the average loan to income about 24%. However, more than 9% are committed to pay more than 30% of their income each month.
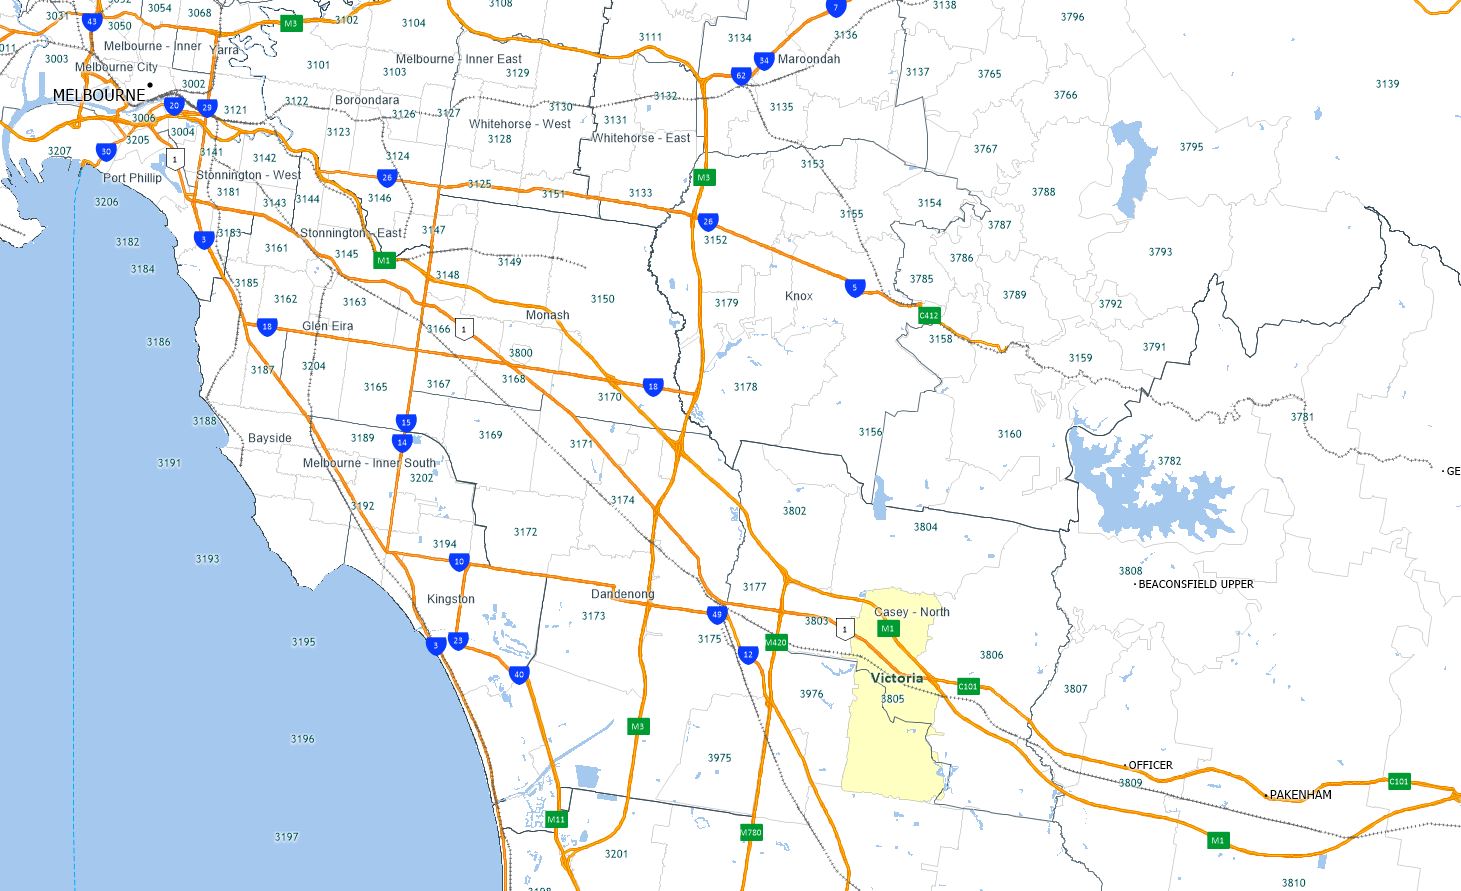
 In fourth place we go back to VIC again, to 3805, which includes Narre Warren and Fountain Gate, This area is around 38 kilometres south east of Melbourne. Here 5,900 households are in mortgage stress. The average home price is $620,000 compared with $366,000 in 2010. There are more than 15,000 families in the area, and the average age is 34 years. The average household income is just over $7,000 a month, which is higher than the national average. 54% of homes are mortgaged and the average monthly repayment is $1,700 slightly below the national average of $1,755. The average loan to income ratio is around 25%, but 12% are paying more than 30% of their income on the mortgage each month.
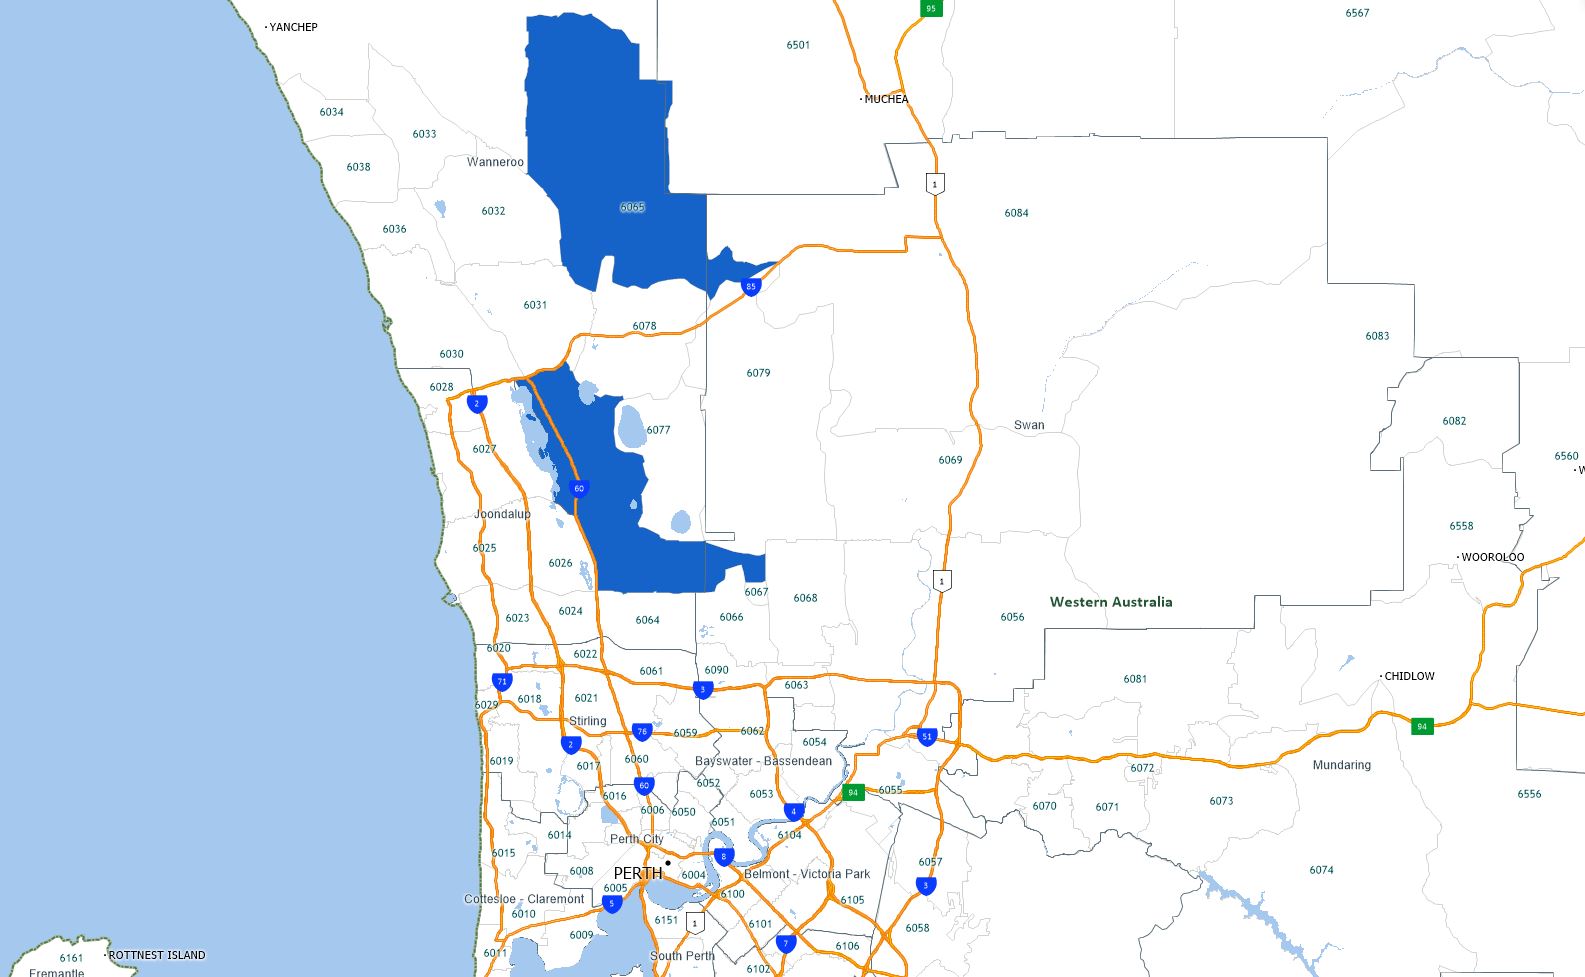
 Coming third we cross the Nullarbor to WA to 6065. This is the area around Wanneroo, including Tapping, Hocking and Landsdale and is located about 25 kilometres north of Perth. It is an area of high population growth and residential construction mainly on smallish lots. There are more than 6,340 households in mortgage stress in the region. The average home price is $420,000 compared with $529,000 in 2010, and down from a peak of $813,000 in 2014. There are about 17,000 households in the district, with an average age of 33. The average income is $8,300 a month, and 58% have a mortgage with average repayments of $2,170, well above the WA and national averages. The average loan to income ratio is around 26%, but more than 13% are paying over 30% of their incomes on the mortgage each month.
 In second spot is the area around Campbelltown in NSW, 2560, which is around 43 kilometres inland from Sydney. Here 6,381 households are in mortgage stress. The average home price is $640,000, up from $320,000 in 2010. Around 20,000 households live in the area with an average age of 34 years. 80% of properties are standalone houses. The average income is $6,100 a month. 37% have a mortgage and the average repayment is higher than the national average at $1,800, or 29% of income. But 13% are paying more than 30% of their income on the mortgage.
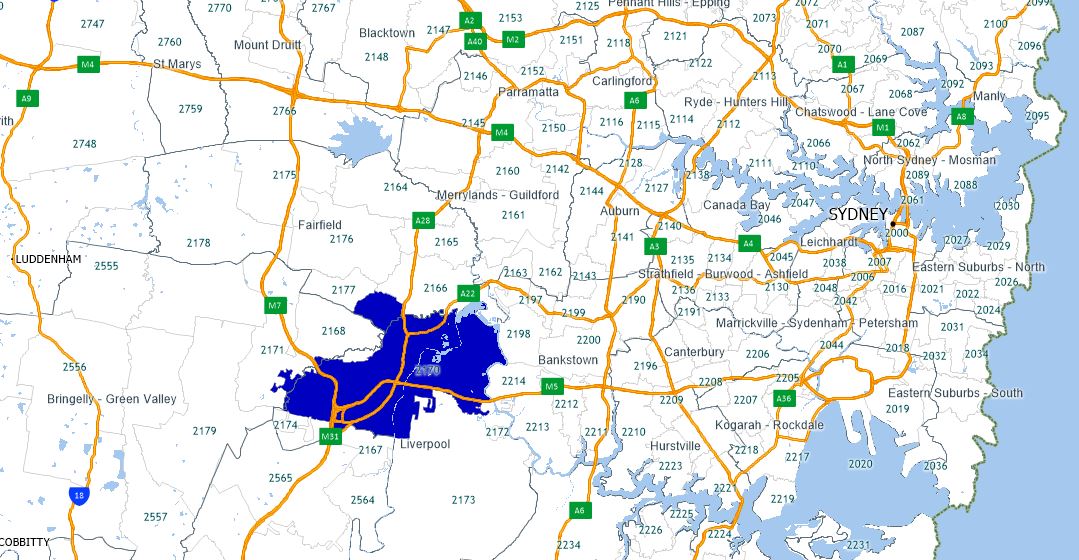
 So to the post code with the highest count of stressed households, is NSW post code 2170, the area around Liverpool, Warwick Farm and Chipping Norton, which is around 27 kilometres west of Sydney. There are around 27,000 families in the area, with an average age of 34. There are 6,974 households in mortgage stress here. The average home price is $805,000 compared with $385,000 in 2010. 64% of properties are standalone houses, while 22% are flats or apartments. The average income here is $5,950. 36% have a mortgage, which is above the NSW average of 32% and the average repayment is about $2,000 each month, so the average proportion of income paid on the mortgage is more than 33%.
 So it’s clear from this analysis that stress is residing among households who are relatively affluent, but highly leveraged, and include a number of newly built high-growth suburbs on the edges of our larger cities. Many are typified by high density standalone houses, or townhouses crammed into small plots. We are seeing a rotation of stress towards some of the Victorian post codes in recent months, but there are concerning rises in both NSW and VIC. However, WA remains the more immediate trouble spot, as can be demonstrated by the higher levels of default there – perhaps close to double the national average.
We will continue to monitor mortgage stress, and will update our core market model next at the end of the year.
As before, I think it is worth repeating that many households in stress do not have a robust household budget, and creating this is an important first step to getting to grips with stress. Whilst putting more on credit cards and refinancing may seem superficially attractive mitigation steps, our analysis shows that these are often only temporary fixes. Getting to grips with where the money is going is an important first step to tackling the problem. Remember too that banks have an obligation to assist in cases of hardship, so if households are in difficulty, they should talk to their lenders, rather than hoping things will work out. Given flat incomes and rising prices, this is unlikely.


As always, great information.
It’s scary to think of the number of households increasing each month to higher stress levels.
Money is always considered to be the stress level indicator when outflows exceed inflows. Of even greater concern is the stress it must be placing on those involved and their relationships.
With property values falling the ability to just sell and wipe out debt is not so easy when rental properties are not easily available.
Most people have built their lifestyles in the areas they live with friends, schools and social hubs.
To sell and give up all their dreams, security and invested lives is not always the answer. But then one needs to consider the alternative of broken lives and shattered dreams.