
National Australia have released their 1H18 results. They were soft, but of most interest is the pressure on net interest margin, from both heightened competition in the mortgage lending segment, on lower growth, and higher funding costs. This was offset by deposit repricing. But Markets NIM was also down. Plus results were muddied by more restructuring costs and lower provisions, despite higher consumer arrears. Capital is lower than was expected. They also plan to sell, or float MLC, the bulk of their wealth management arm, which should provide some capital upside after 2019.
CEO Andrew Thorburn said “We continue to learn from our mistakes and respond by making changes to be better for customers. The commitment of our people to do the right thing is unwavering and together we are working to restore trust and respect in our industry, during and after the Royal Commission”.
The cash earnings was down 16% on the prior corresponding period (pcp) to $2,759m, which was below consensus. This included $755m restructuring charges, so cash earnings, exceeding these were $3,289m, down 0.2% on 1H17 or down 1.8% on last half. The statutory profit was $2,583m up 1.5% on pcp, but down 5.7% on the previous half.
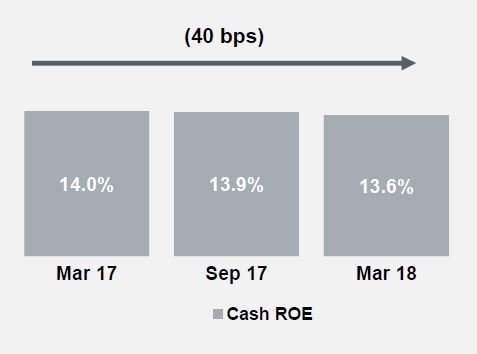
The diluted earnings per share were $0.988 per share, down 17% and the cash RPE was 11.4%, down 260 basis points, or excluding restructuring costs down 40 basis points to 13.6%.
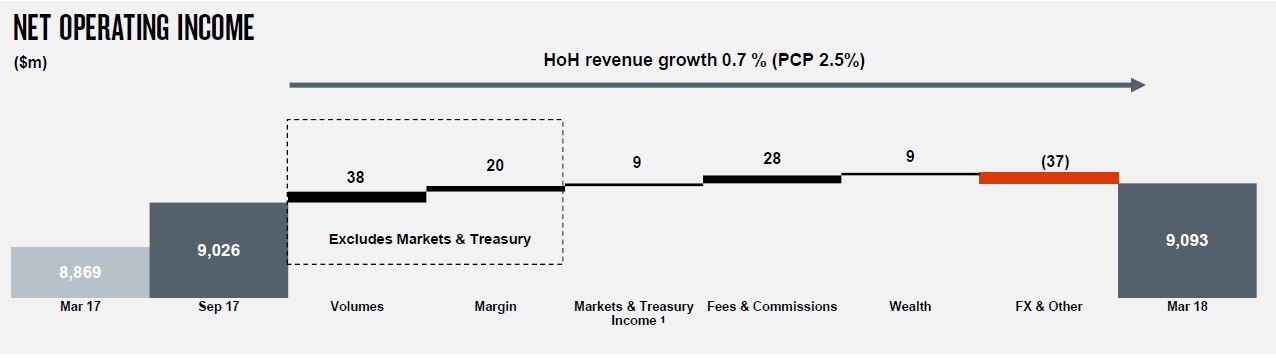
 Revenue was up 2.5% on pcp to $9,093m with growth in housing and business lending lifting margins, but offset by lower Markets and Treasury income.
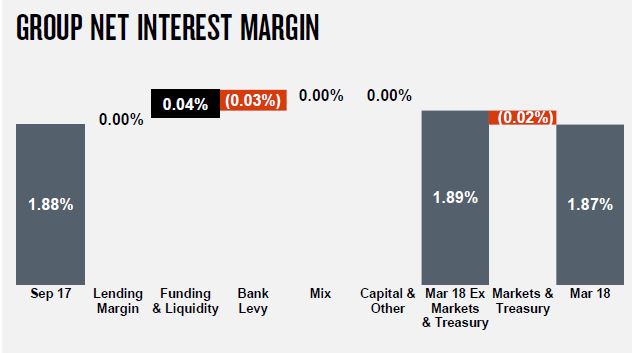
 Overall Net interest margin was down 1 basis point. A rise of 5 basis points, reflecting repricing and lower funding costs was offset by the impact of the bank levy and housing competition and product mix changes.
 They said if current short term funding costs continue to rise..
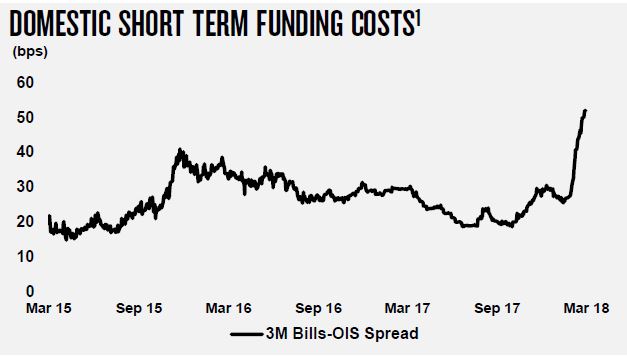 .. 2H18 NIM would be reduced by 2-3 basis points.
Expenses were up 25.3% of 5.4% excluding restructuring-related expenses. Net FTE were up from 33,422 to 33,944, which is interesting bearing in mind its plan to reduce 6,000 from existing FTE and add back 2,000 digital specialists by 2020.
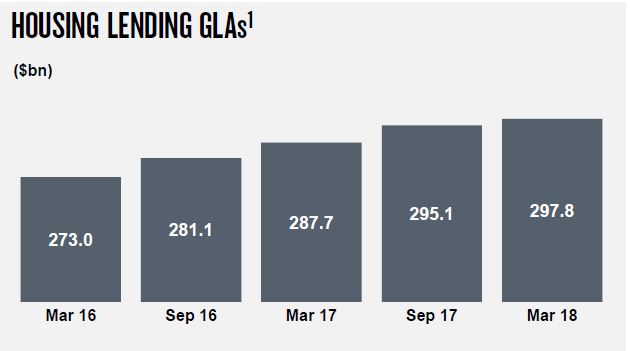
Looking at the home lending portfolio, total loans rose from $295.1 billion in Sept 17 to $297.8 billion in March 18, the smallest rise for some time.
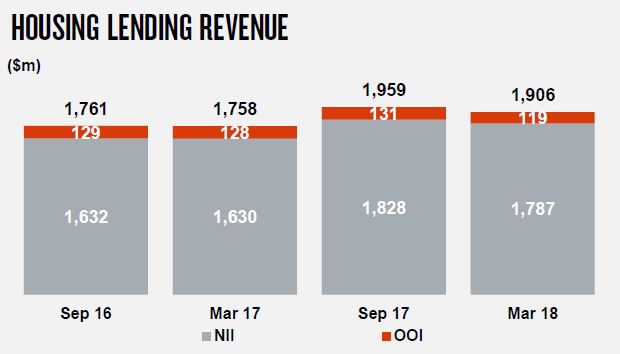
 Housing revenue fell in 1H18, despite maintaining a 15.7% market share.
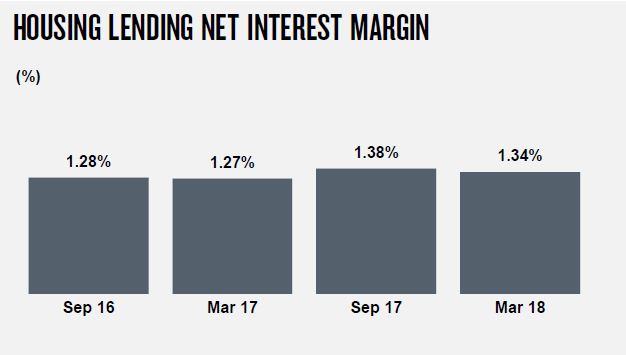
 Housing NIM fell by four basis points in 1H18, as the effect of earlier repricing faded, and competition of loans increased.
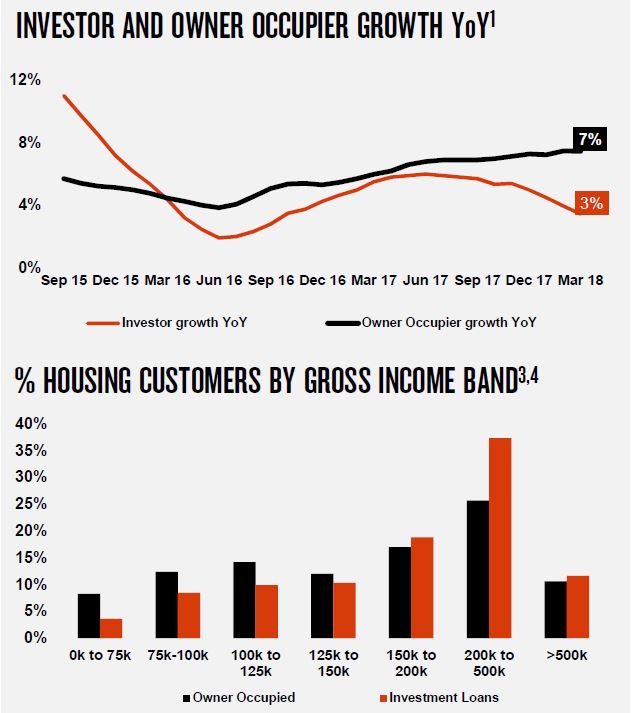
 Data on the portfolio shows that growth is stronger in owner occupied loans. However, the gross incomes appear to us to be significantly higher than the “average income” from households. 41.6% of draw-downs are via brokers compared with 34.6% in the portfolio.
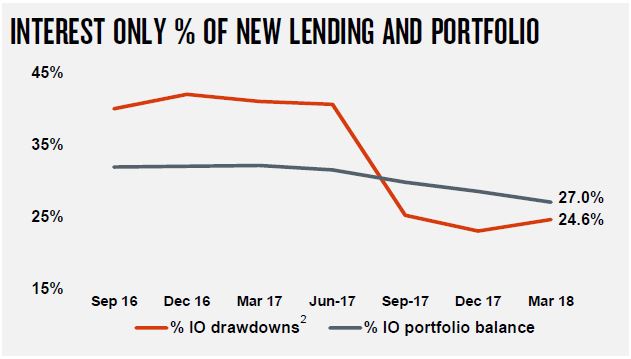
 They also said 54.1% of investment loans are interest only. Interest Only loans are below the 30% Interest Only flow cap includes all new IO loans and net limit increases on existing IO loans. The cap excludes line of credit and internal refinances unless the internal refinance results in an increased credit limit (only the increase is included in the cap).
 They said that the banks is using granular customer expense conversation and capture since late 2016 – across 12 expense criteria. They use the greater of customer expense capture or income scaled Household Expenditure Measure (HEM). Around 60% of mortgage applications have declared expenses above HEM since October 2014.
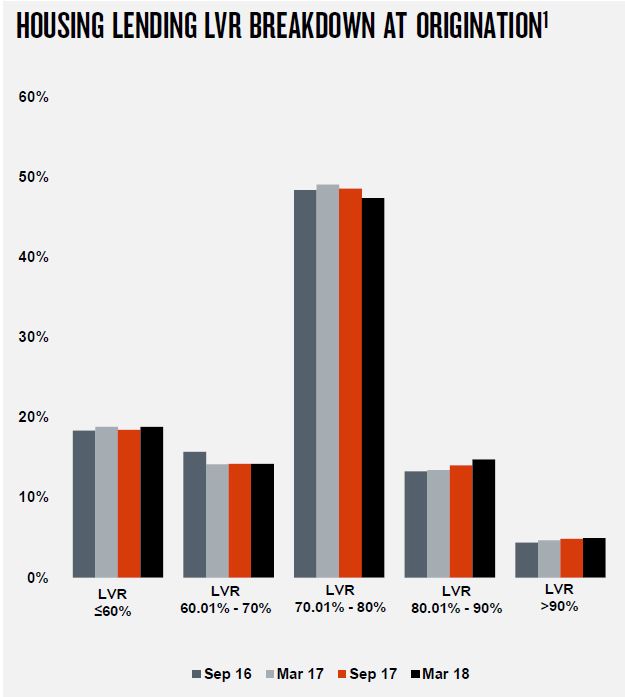
In 1H18 home loans drawn with Loan-to-Income (LTI) >6x was 9%, >7x was 3%. The average LVR at origination is 69%. The dynamic LVR 43% (2% have >90% dynamic LVR).
 They said 465 home loan files were reviewed by Ernst & Young as part of
APRA review of all major bank home loan policies, processes and controls. They found issues with verification of serviceability found in 23 files (5%), but on further review serviceability was proven for all but 1 file. None of the 23 files are in arrears.
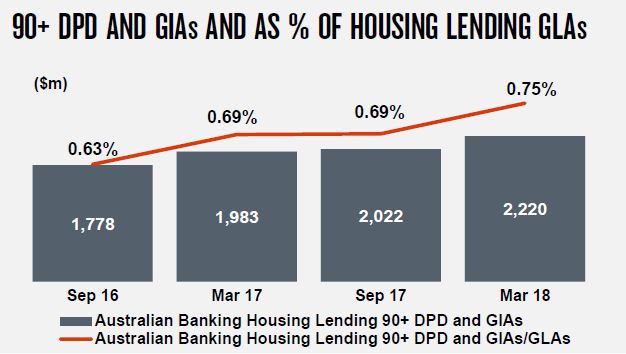
Portfolio arrears are rising with 90 day+ past due now at 0.75%, up from 0.69% in September. This is worth $2.2 billion, up from $2.02 billion in September.
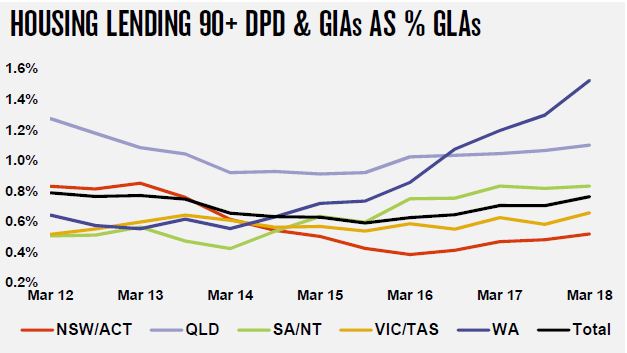
 The rises are most noticeable in WA and QLD, but small hikes in other states too.
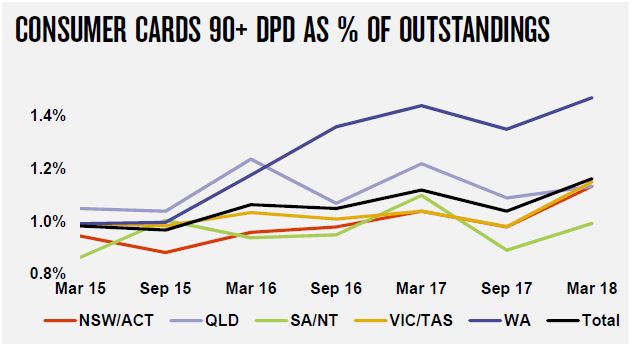
 Arrears in the consumer credit portfolio are also rising.
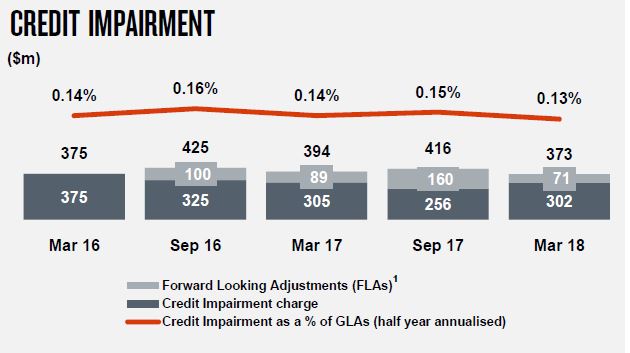
 Yet overall Group credit impairment charges declined 5.3% to $373 million, and declined 1 basis point to 13 basis points as a percentage of gross loans and acceptances.
 Overall asset quality improved with the ratio of 90+ days past due and gross impaired assets to gross loans and acceptances down 14 basis points to 0.71%, thanks to improved conditions for New Zealand dairy customers and work-out strategies across Australian business lending.
The Group CET1 ratio was 10.21%, up 15 basis points from September 2017.
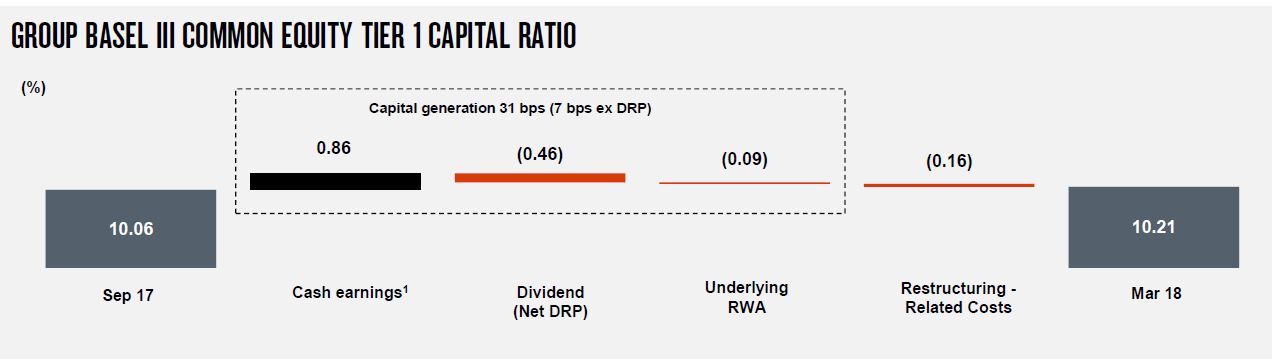 They still expect to meet APRA’s unquestionably strong target of 10.5% by 2020. Their leverage ratio was 5.6%. The liquidity coverage ratio was 127% and the net stable funding ratio was 115%.
The announced the sale of MLC and other wealth management businesses with a view to evolving a simpler wealth offering through JBWere and nabtrade. They are targetting a separation by the end of 2019 via public market options including demerger and IPO whilst maintaining flexibility to consider trade sale options. Subject to board and regulatory approval.