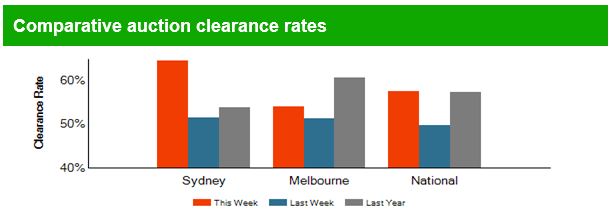
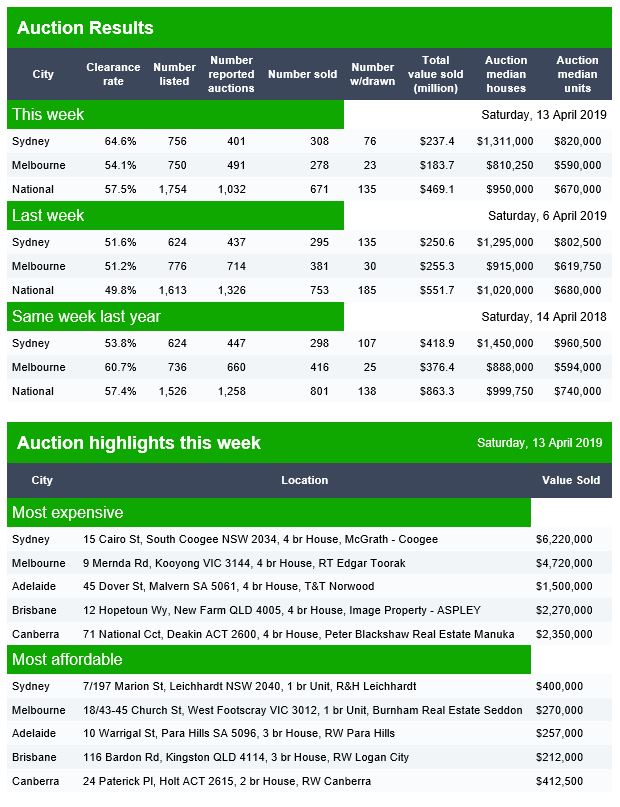
The final results continue the trend of lowish total clearances on low volumes. National final clearance was 49.8% with 753 sales. Holidays of course get in the way at this time of year.
Canberra listed 61, reported 44 and sold 27, with 12 withdrawn, giving a Domain clearance of 48%.
Adelaide listed 83, reported 43 and sold 31, with 12 withdrawn, giving a Domain clearance of 56%.
Brisbane listed 104, reported 53 and sold 27 with 12 withdrawn, giving a Domain clearance of 42%.
The RBA released their Financial Stability report today, and even with the rose tinted RBA glasses there are a number of worrying issues touched on. Though none new. But their analysis of negative equity is over optimistic. So we will look at what they say, and highlight some additional considerations.
The RBA said:
Domestic economic conditions remain broadly supportive of financial stability. The unemployment rate has remained around 5 per cent since the previous Review and corporate profit growth has also been strong.
However, GDP growth in Australia also slowed in the second half of 2018. In particular, consumption growth eased and the outlook for consumption is uncertain.
Conditions in the housing market remain weak. Nationally, housing prices are 7 per cent below their late 2017 peak, although they are still almost 30 per cent higher since the start of 2013.
Growth in housing credit was slightly lower over the six months to February than the preceding half year, with investor credit hardly growing at all.
Nationally, falling housing prices have been driven by weaker demand and increased housing supply. The tightening in the supply of housing credit from improved lending standards has played a smaller part. Importantly, these more rigorous lending standards have seen the quality of new loans improve in recent years.
Measures of financial stress among households are generally low and households remain well placed to service their debt given low unemployment, low interest rates and improvements to lending standards. However, there has been an increase in housing loan arrears rates. The increase in arrears has been largest in Western Australia, where the decline in mining related activity has seen housing prices fall for nearly five years and unemployment increase.
They did in “deep dive” on negative equity using their securitised loan data.
Large housing price falls in parts of Australia mean some borrowers are facing negative equity – where the outstanding balance on the loan exceeds the value of the property it is secured against. Negative equity creates vulnerabilities both for borrowers and lenders. A borrower having difficulty making loan repayments who has negative equity cannot fully repay their debt by selling the property. Negative equity also implies that banks are likely to bear losses in the event that a borrower defaults. Evidence from Australia and abroad suggests that borrowers who experience an unexpected fall in income are more likely to default if their loan is in negative equity.
At present, the incidence of negative equity remains low. Given the large increases in housing prices that preceded recent falls and the decline in the share of mortgages issued with high loan to- valuation ratios (LVRs), housing prices would need to fall significantly further for negative equity to become widespread. However, even if this did occur, increased defaults would be unlikely if the unemployment rate remains low, particularly given the improvements in loan serviceability standards over recent years.
Estimating the share of borrowers with negative equity requires data on current loan balances and property values. The RBA’s Securitisation Dataset contains the most extensive and timely data on loan balances and purchase prices.
The Securitisation Dataset includes about one-quarter of the value of
all residential mortgages, or around 1.7 million mortgages.
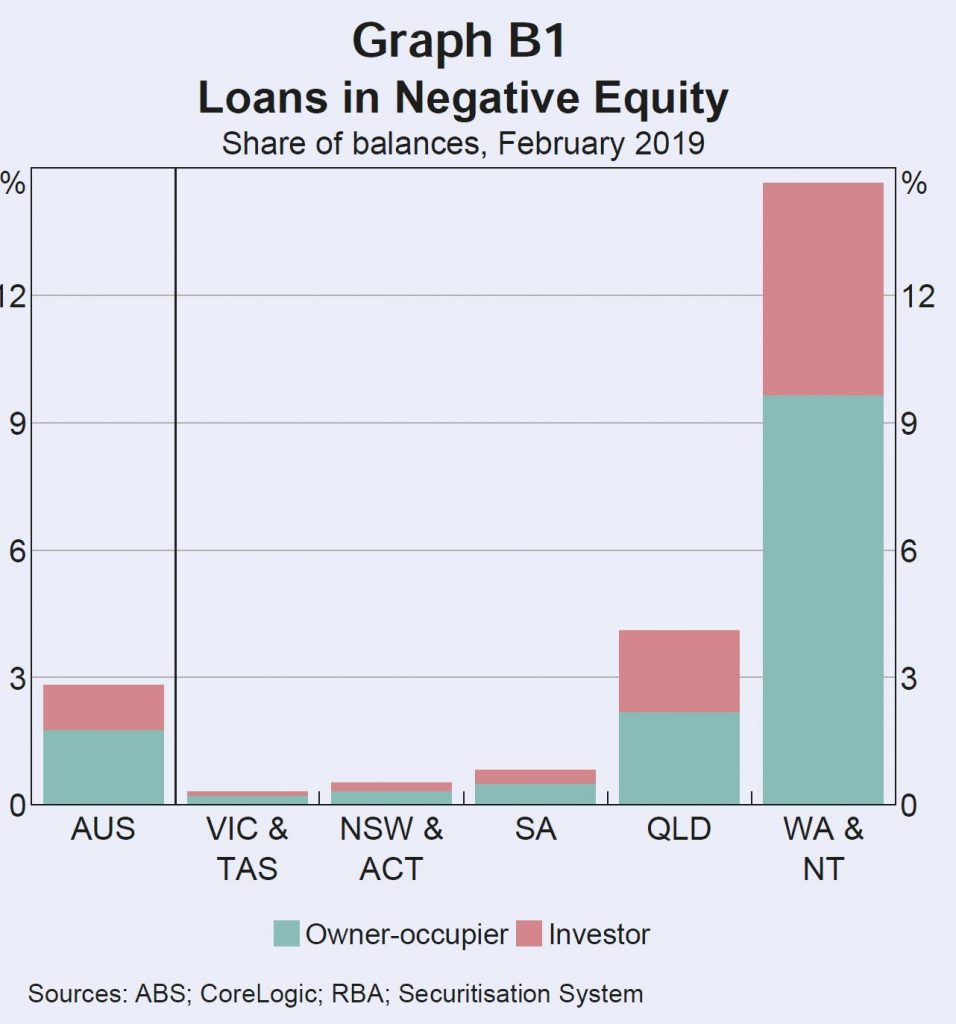
This data can be combined with regional data on housing price movements to estimate the share of loans that are currently in negative equity. This suggests that nationally, around 2¾ per cent of securitised loans by value are in negative equity (just over 2 per cent of borrowers). The highest rates of negative equity are in Western Australia, the Northern Territory and Queensland, where there have been large price falls in areas with high exposure to mining activity. Almost 60 per cent of loans in with negative equity are in Western Australia or the Northern Territory. Rates of negative equity in other states remain very low.
Estimates of negative equity from the Securitisation Dataset may, however, be under or overstated. They could be understated because securitised loans are skewed towards those with lower LVRs at origination. In contrast, the higher prevalence of newer loans in the dataset compared to the broader population of loans, and not being able to take into account capital improvements on values, will work in the other direction. Some private surveys estimate closer to 10 per cent of mortgage holders are in negative equity. However, these surveys are likely to be an overestimate for a number of reasons; for instance, by not accounting for offset account balances.
DFA Says: Of course DFA estimates 10% of households in negative equity, after taking offset balances into account, and also adding in the current forced sale value of the property and transaction costs.
Information from bank liaison and estimates based on 2017 data from the Household Incomes and Labour Dynamics of Australia (HILDA) survey suggest rates of negative equity are broadly in line with those from the Securitisation Dataset.
DFA Says: The HILDA data is at least 2 years old, so before the recent price falls – so this set will understate the current position.
The continuing low rates of negative equity outside the mining exposed regions reflect three main factors: the previous substantial increases in housing prices; the low share of housing loans written at high LVRs; and the fact that many households are ahead on their loans, having accumulated extra principal payments.
Housing prices in some areas of Sydney and Melbourne have fallen by upwards of 20 per cent from their peak in mid to late 2017. But only a small share of owners purchased at peak prices, and many others experienced price rises before property prices began to fall. Properties purchased in Sydney and Melbourne since prices peaked account for around 2 per cent of the national dwelling stock. Looking further back, properties purchased in these two cities since prices were last at current levels still only account for around 4½ per cent of the dwelling stock.
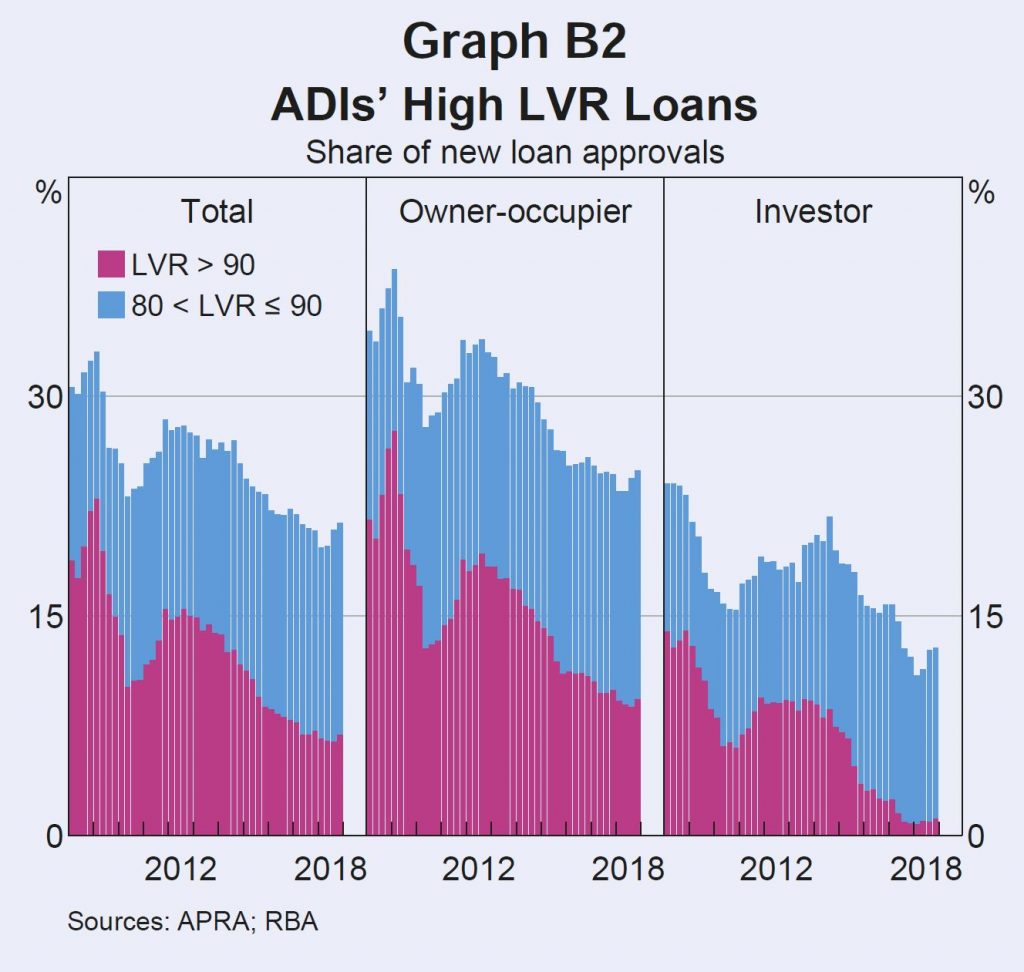
Few recent borrowers had high starting LVRs. Over the past five years, the share of loans issued by ADIs with LVRs above 90 has roughly halved. Since 2017, it has averaged less than 7 per cent (Graph B2). Around 80 per cent of ADI loans are issued with an LVR of 80 or less. Around 15 per cent of owner-occupier borrowers and 20 per cent of investors take out a loan with a starting LVR of exactly 80.
Given most borrowers do not have high starting LVRs, housing price falls need to be large for widespread negative equity. Only 15 per cent of regions have experienced price declines of 20 per cent or more from their peaks. Around 90 per cent of these regions are in Western Australia, Queensland and the Northern Territory.
If a borrower has paid off some of their debt, then price declines will need to be larger still for them to be in negative equity. Most borrowers have principal and interest loans that require them to pay down their debt and many borrowers are ahead of their repayment schedule. Around 70 per cent of loans are estimated to be at least one month ahead of their repayment schedule, with around 30 per cent ahead by two years or more.
When a borrower is behind on repayments and their loan is in negative equity, banks classify the loan as ‘impaired’. Banks are required to raise provisions against potential losses from impaired loans through ‘bad and doubtful debt’ charges. Currently the proportion of impaired housing loans is very low, at 0.2 per cent of all residential mortgages, despite having increased of late (Graph B3).
Queensland, Western Australia and the Northern Territory together account for around 90 per cent of all mortgage debt in negative equity. These states have regions that experienced large and persistent housing price falls over several years.
This has often been coupled with low income growth and increases in unemployment, which have reduced the ability of borrowers to pay down their loans. Loans currently in negative equity were, on average, taken out around five years ago and had higher average LVRs at origination, of around 85 per cent. This made them particularly susceptible to subsequent falls in property values. Investment loans are also disproportionately represented, despite typically having lower starting LVRs than owner-occupier loans. Investors are more likely to take out interest-only loans in order to keep their loan balance high for tax purposes. Around 10 per cent of loans in negative equity have interest only terms expiring in 2019, which is double the share for loans in positive equity. For these borrowers, the increase in repayments from moving to principal and interest may be difficult to manage, especially as loans in negative equity are already more likely to be in arrears. Having more borrowers in this scenario is distressing for the borrowers themselves and for the communities they live in. However, it is unlikely to represent a risk to broader financial stability given it remains largely restricted to mining-exposed regions, which represent a very small share of total mortgage debt.
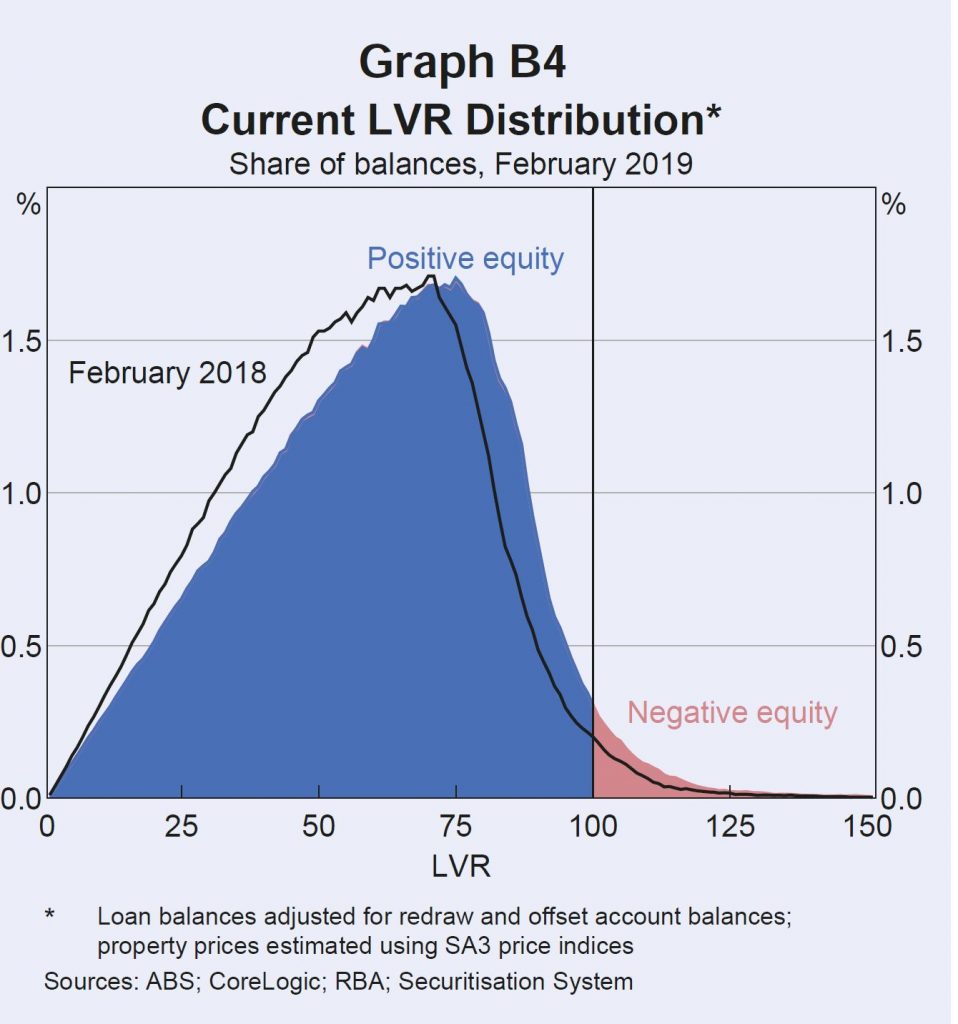
Continued housing price falls would be expected to increase the incidence of negative equity, particularly if they affect borrowers with already high LVRs. Around 11/4 per cent of loans by number (and 13/4 per cent of loans by value) have a current LVR between 95 and 100, making them likely to move into negative equity if there are further housing price falls (Graph B4).
However, compared to the international experience with negative equity during large property downturns, the incidence of negative equity in Australia is likely to remain low. Negative equity peaked in the United States at over 25 per cent of mortgaged properties in 2012 and in Ireland it exceeded 35 per cent, as peak to trough price falls exceeded 30 and 50 per cent respectively.
However, high origination LVRs were far more common in these countries than they have been in Australia.
DFA Says: Except we know there were high levels of mortgage fraud and incorrect data supporting loan applications. Higher than in Ireland.
Even if negative equity was to become more common in the larger housing markets of Sydney and Melbourne, impairment rates for banks are unlikely to increase significantly while unemployment and interest rates remain low.
DFA Says: you need to get post code granular to see what is going on. As our earlier heat map showed.
Just days after CBA announced it was cutting its rates and stepping away from its competitors, another big four has matched the changes across the board – and likely triggered a continued decrease in fixed rates at lenders of all sizes.
The newly announced decreases go into effect at Westpac tomorrow for
fixed rate loans paying P&I and are open to both new and existing
customers switching into a fixed rate.
“As expected, it hasn’t taken Westpac long to match the fixed rate cuts this week from Commonwealth Bank,” said Steve Mickenbecker, Canstar group executive of financial services.
“These decreases are a further sign that the big banks are wanting to
fight back to regain the market share losses to the local arms of
foreign banks and other domestic lenders over the past 12-months.”
At Westpac, the three- and five-year fixed rates for owner occupiers
paying P&I are to decrease by 0.10% while the four-year rate will
drop by 0.20%.
Fixed rates will also decrease for investors paying P&I, by 0.06%
for two-year, 0.20% for three-year, and 0.10% for five-year,
demonstrating “the bank’s desire to increase investment lending in the
face of declining demand,” according to Mickenbecker.
Other lenders have already been making moves of their own to stay competitive.
Suncorp has announced a discount for its three-year fixed package
rates for eligible new home lending, meaning the non-major currently has
the lowest three-year fixed rate in the market at 3.49% for owner
occupied and 3.69% for investment.
“We are now eagerly awaiting the response from the other two major
banks and the rest of the market, in light of these competitive fixed
rates from the country’s two biggest lenders,” concluded Mickenbecker.
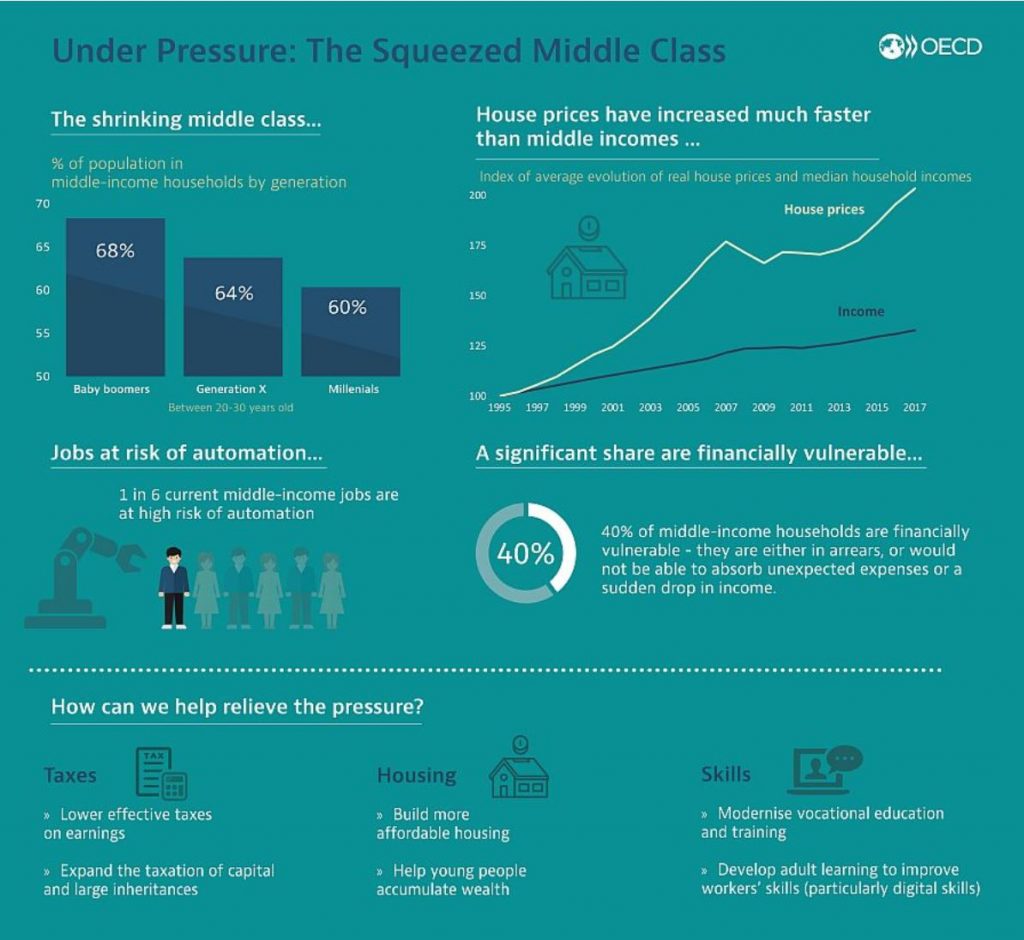
The OECD has released a report Under Pressure: The Squeezed Middle Class which underscores the fact that relative to the more affluent, those in the middle are getting squeezed. 40% are financially at risk. Timely given the current Australian election!
Much of this is because of the high costs of housing relative to incomes.
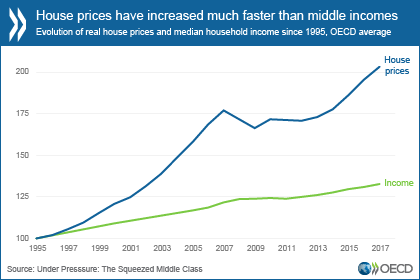
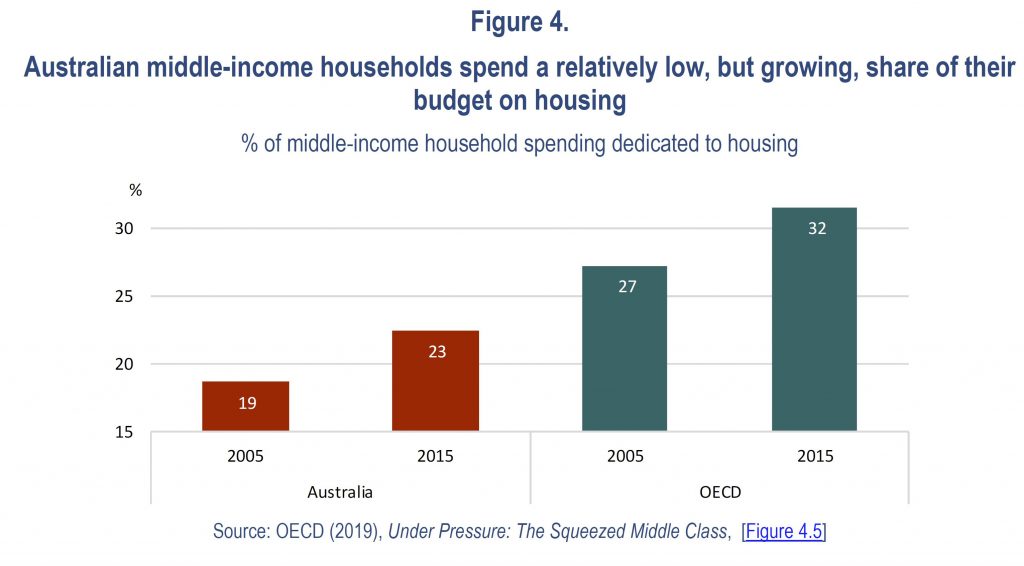
The cost of a middle class lifestyle has increased faster than inflation. Housing, for example, makes up the largest single spending item for middle-income households, at around one third of disposable income, up from a quarter in the 1990s. House prices have been growing three times faster than household median income over the last two decades
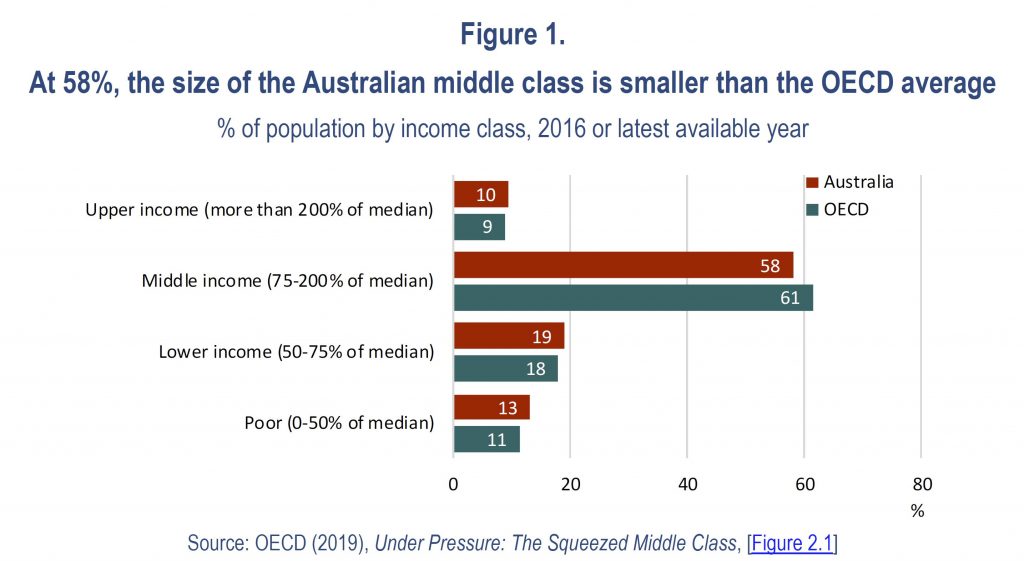
The report includes Australian specific data. At 58%, the size of the Australian middle class is smaller than the OECD average.
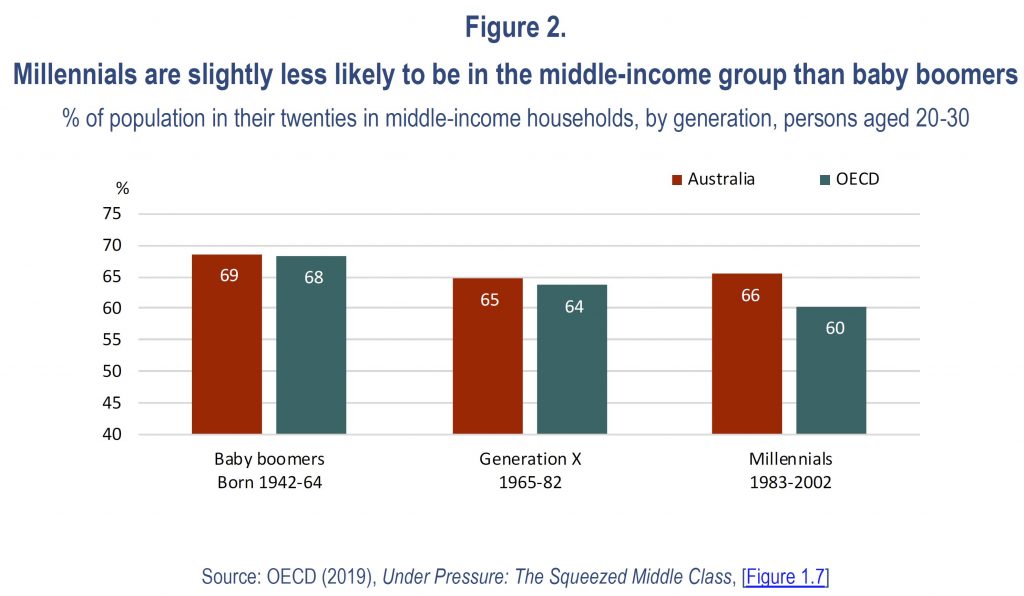
Millennials are slightly less likely to be in the middle-income group than baby boomers.
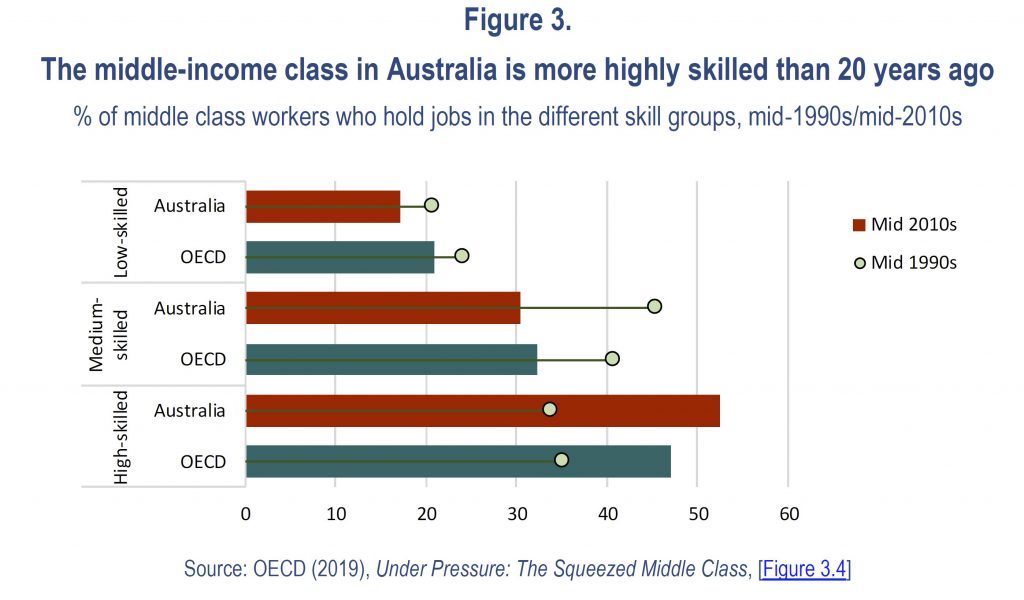
The middle-income class in Australia is more highly skilled than 20 years ago
Australian middle-income households spend a relatively low, but growing, share of their budget on housing.
More generally, the report says that the middle class has shrunk in most OECD countries as it has become more difficult for younger generations to make it to the middle class, defined as earning between 75% and 200% of the median national income. While almost 70% of baby boomers were part of middle-income households in their twenties, only 60% of millennials are today
The economic influence of the middle class has also dropped sharply. Across the OECD area, except for a few countries, middle incomes are barely higher today than they were ten years ago, increasing by just 0.3% per year, a third less than the average income of the richest 10%
“Today the middle class looks increasingly like a boat in rocky waters,” said OECD Secretary-General Angel Gurría, launching the report in New York with Luis Felipe Lopéz-Calva, Assistant Secretary General, Latin America and the Caribbean, United Nations Development Programme. “Governments must listen to people’s concerns and protect and promote middle class living standards. This will help drive inclusive and sustainable growth and create a more cohesive and stable social fabric.
Gabriela Ramos, OECD Chief of Staff and Sherpa overseeing the
Organisation’s work on Inclusive Growth, presented in more details the
main findings of the report, saying “our analysis delivers a bleak
picture and a call for action. The middle class is at the core of a
cohesive, thriving society. We need to address their concerns regarding
living costs, fairness and uncertainty.”
More than one in five middle-income households spend more than they earn and over-indebtedness is higher for them than for both low-income and high-income households. In addition, labour market prospects have become increasingly uncertain: one in six middle-income workers are in jobs that are at high risk of automation, compared to one in five low-income and one in ten high-income workers
To help the middle class, a comprehensive action plan is needed, according to the OECD. Governments should improve access to high-quality public services and ensure better social protection coverage. To tackle cost of living issues, policies should encourage the supply of affordable housing. Targeted grants, financial support for loans and tax relief for home buyers would help lower middle-income households. In countries with acute levels of housing-related debt, mortgage relief would help overburdened households get back on track
As temporary or unstable jobs – often offering lower wages and job security – increasingly replace traditional middle-class jobs, more investment is needed in vocational education and training systems. Social insurance and collective bargaining coverage for non-standard workers, such as part-time or temporary employees or self-employed, should be extended
Finally, to foster fairness of the socio-economic system, policies
need to consider shifting the tax burden from labour income to income
from capital and capital gains, property and inheritance, as well as
making income taxes more progressive and fair.
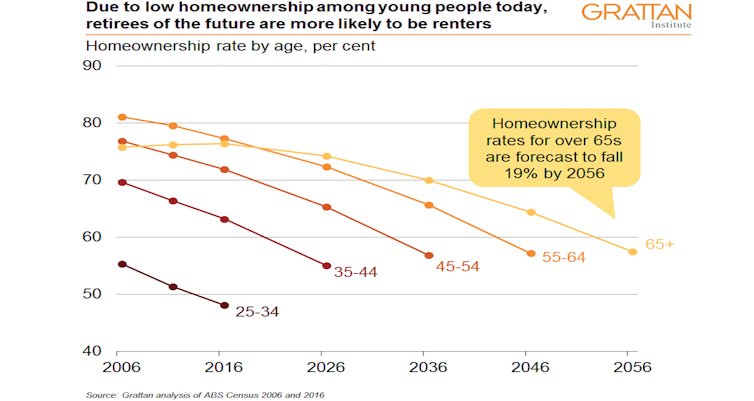
Australia’s retirement incomes system has been built on the assumption that most retirees would own their home outright. But new Grattan Institute modelling shows the share of over 65s who own their home will fall from 76% today to 57% by 2056 – and it’s likely that less than half of low-income retirees will own their homes in future, down from more than 70% today.
Home ownership provides retirees with big benefits: they have
somewhere to live without paying rent, and they are insulated from
rising housing costs. Retirees who have paid off their mortgage spend
much less of their income on housing (on average 5%) than working
homeowners or retired renters (25% to 30%). These benefits – which
economists call imputed rents – are worth more than A$23,000 a year to
the average household aged 65 or over, roughly as much again as the
maximum pension.
You’ll be OK if you own
Our 2018 report Money in Retirement
showed that while Australia’s retirement income system is working well
for the vast majority of retirees, it’s at risk of failing those who
rent. They are more than twice as likely as homeowners to suffer
financial stress, as indicated by things such as skipping meals, or
failing to pay bills.
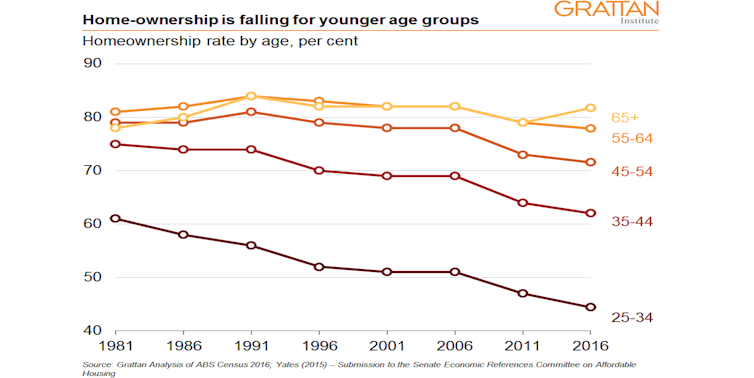
This is not surprising – renters typically have lower incomes. But the rising deposit hurdle and greater mortgage burden risks means rates of home ownership are falling fast among the presently young and the poor.
The share of 25 to 34 year olds who own their home has fallen from
more than 60% in 1981 to 45% in 2016. For 35 to 44 year olds it has
fallen from 75% to about 62%.
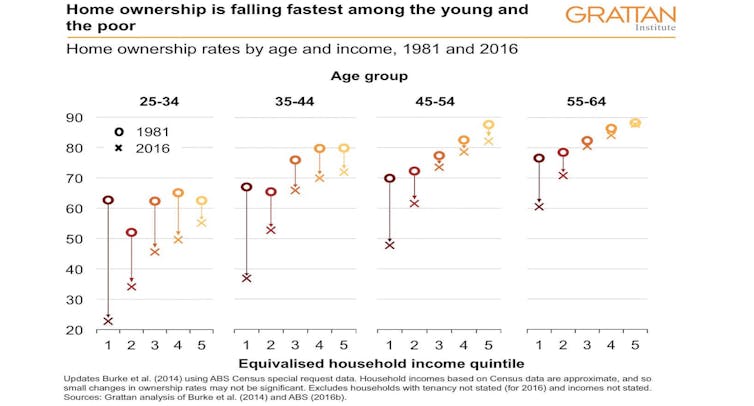
And home ownership now depends on income much more than in the past:
among 25-34 year olds, home ownership among the poorest 20% has fallen
from 63% to 23%.
But fewer will
Home ownership is likely to fall further in coming years. Using
Grattan Institute modelling, we find that on current trends, the share
of over 65s who own their home will fall from 76% today to 74% in 2026,
to 70% by 2036, 64% by 2046, and 57% by 2056.
And while we don’t project home ownership rates for different income
groups due to data limitations (we have the necessary Census data on
home ownership rates by age and income only for 1981 and 2016), it is
more than likely that less than half of low income retirees will own
their homes in future, down from more than 70% today.
Today’s younger Australians will become tomorrow’s retirees.
Worsening housing affordability means renting will become more widespread
among retirees. As a result, more retirees will be at risk of poverty
and financial stress, particularly if rent assistance does not keep pace
with future increases in rents paid by low-income renters.
And rent assistance won’t much help
The maximum rent assistance payment is indexed in line with the
consumer price index, but rents have been growing faster than the
consumer price index for a long time. Between June 2003 and June 2017,
the consumer price index climbed by 41%, while average rents climbed by
64%.
That’s why our Money in Retirement
report recommended boosting Commonwealth Rent Assistance by 40%, at a
cost of $300 million a year in today’s dollars. That would restore it to
the buying power it had 15 years ago. It should be indexed in future to
changes in the rents typically paid by the people who get it, so its
value is maintained, as recommended by the Henry Tax Review.
There’s another important implication. Retirement incomes are likely to become more unequal in future. Money in Retirement
found that in general future retirees will have adequate retirement
incomes. Most workers today can expect a retirement income of at least
89% of their pre-retirement income, well above the 70% benchmark used by
the Organisation for Economic Co-operation and Development, and more
than enough to maintain pre-retirement living standards.
But a retirees who rent will have much less for living on.
There will be ‘haves’ and more ‘have nots’
Among home-owners, an increasing proportion will be still paying off
their mortgages when they retire – the proportion of 55 to 64 year olds
who own their home outright fell from 72% in 1995-96 to 42% in 2015-16.
Some will (quite rationally) use some or all of their super to pay off
their mortgage.
And rising housing costs will in time force retirees to draw down on more of the value of their home to fund their retirement.
Currently, few retirees downsize or borrow against the equity of
their home while continuing to live in it. But that will have to change.
House prices have outstripped growth in incomes.
Median prices have increased from around four times median incomes in
the early 1990s to more than seven times median incomes today (and more
than eight times in Sydney).
Government policy should continue to encourage these retirees to draw
down on the increasingly valuable equity of their homes to help fund
their retirement. They are not the ones who will need government help.
The government’s recent expansion of the Pension Loans Scheme that allows all retirees to borrow against the value of their homes is a step in that direction.
Retirement is going to change in the years ahead. Most retirees will be far from poor, many of them better able to support themselves than ever before. But an increasing number will not. They are the ones who will need our help.
Authors: Brendan Coates, Fellow, Grattan Institute; Tony Chen, Researcher, Grattan Institute
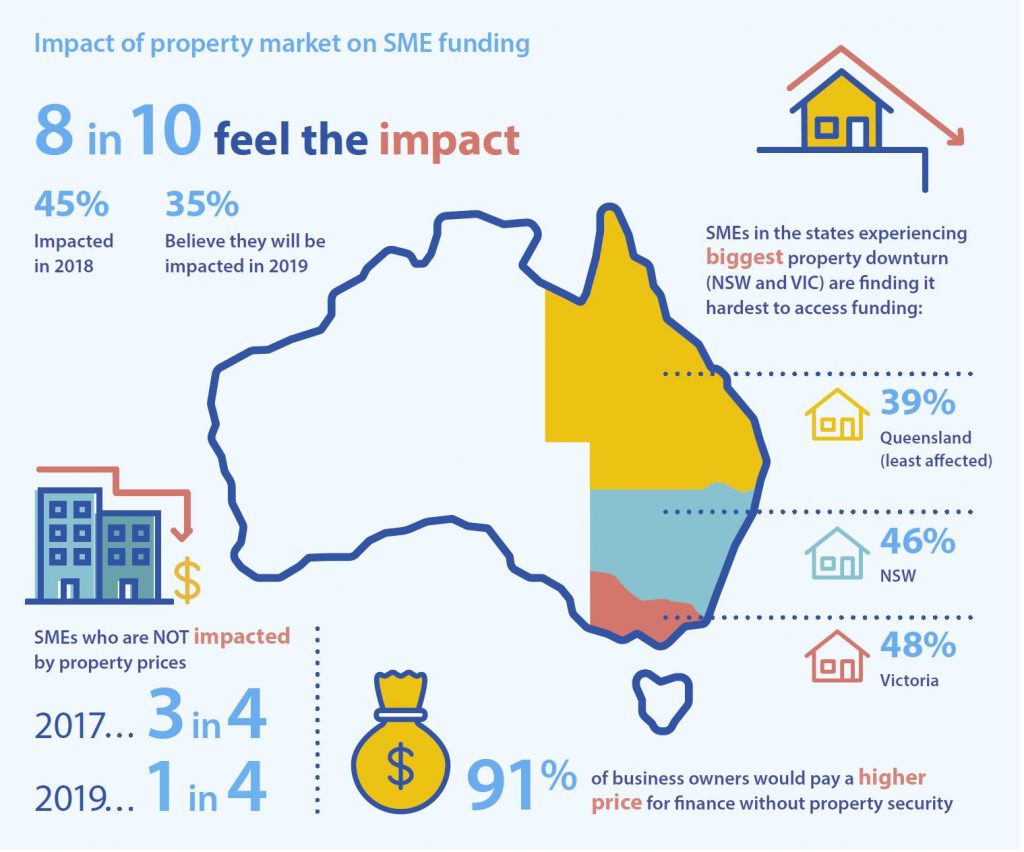
Almost half the SMEs (44.5%) say property market conditions are already making it harder for them to access business funding, likely due to softening house prices in major markets, according to the latest Scottish Pacific Business Finance report, based on research by East & Partners who interviewed 1,257 SME businesses with annual revenues of A$1-20 million over a seven-week period ending 18 January 2019.
Of course this is a relatively narrow segment of the SME market, as many will have significantly lower turnover.
The report said that a further 35% haven’t yet felt the impact, but fully expect the housing price correction and broader property market conditions including slowing loan approvals will have a significant impact on their borrowing capacity.
When property market impact was last assessed in September 2017, three out of four SMEs said property prices were having no direct impact on their businesses. This round, only one in five SMEs said they had not yet seen a direct impact.
This minority of non-affected SMEs perhaps reflects how broad the base of Australia’s small business sector is, with more than two million enterprises across a wide range of industries and regional markets.
Property prices are having more impact on SMEs in Victoria and NSW (affecting 48% and 46% respectively), with Queensland small businesses (39%) the most buffered.
Declining or no-change SMEs are being hit harder by property market movements, with 54% of non-growth SMEs already impacted (compared to 36% of growth SMEs).
For these non-growth SMEs, finances are already stretched thin and they are feeling “when it rains it pours”. These are the businesses that currently need the most support to get through tough market conditions.
More than 91% of SMEs would be prepared to pay a higher rate to obtain finance if they didn’t have to provide real estate security. This overwhelming sentiment is voiced at a time when a sharp correction in residential property prices is affecting capital cities, coupled with falling building approval data and predictions by analysts such as Core Logic and UBS of tough market conditions still to come.
Of the nine out of 10 business owners who say they would be willing to pay a higher rate for finance if they could avoid using property as security, almost two-thirds (65%) indicated they ‘definitely’ would be willing, and more than a quarter (26%) said ‘probably’. Fewer than 1% of SMEs ‘definitely’ would not consider higher rates in place of borrowing against the family home, and just over 1.5% said it would be ‘unlikely’.
According to the Productivity Commission’s draft report into Australian financial system competition, a third to a half of Australian SME loan value is reliant on property security. For the major banks, 35% of their
small business lending (by loan value) is secured by real estate. For banks outside the majors this figure is higher, at almost 47%.
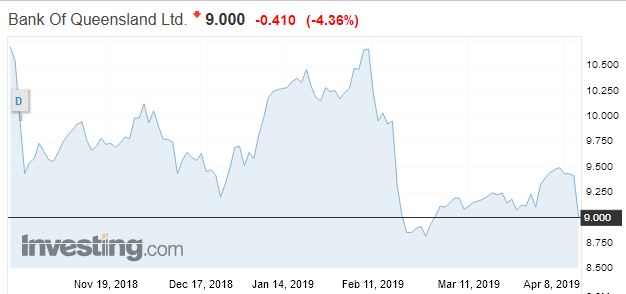
The 2019 half year results from BOQ today really underscores the pressures on the banks – especially regional ones – as home lending slows, and competition for the remaining business rises. And they see similar pressures ahead.
Banking is no longer the cash generating machine it use to be. Expect more loan repricing ahead to try and stablise the business. Their shares were lower. The dividend was cut.
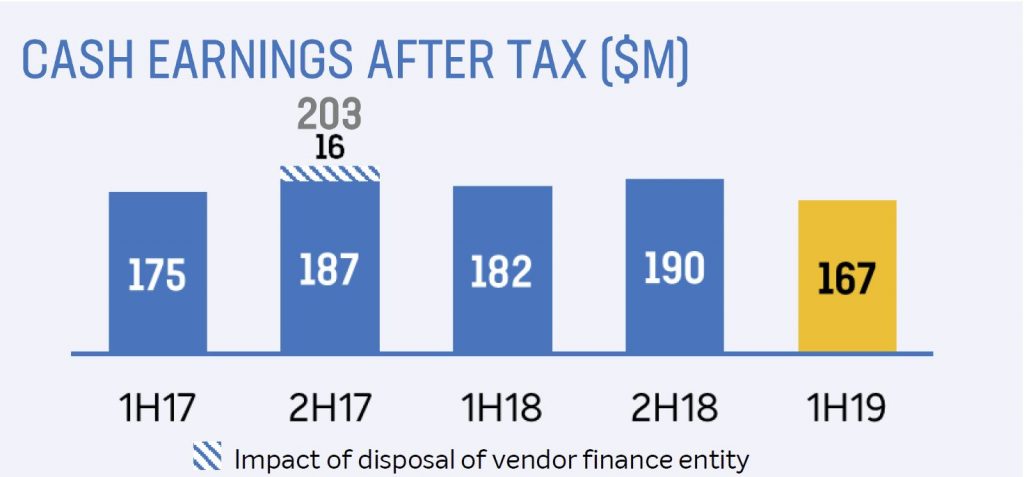
Their cash earnings after tax of $167 million, down 8% compared with 1H18, and 12% down on 2H18. This was pretty much as expected.
Their statutory net profit after tax of $156 million, down 10% on 1H18, or 4% down on 2H18.
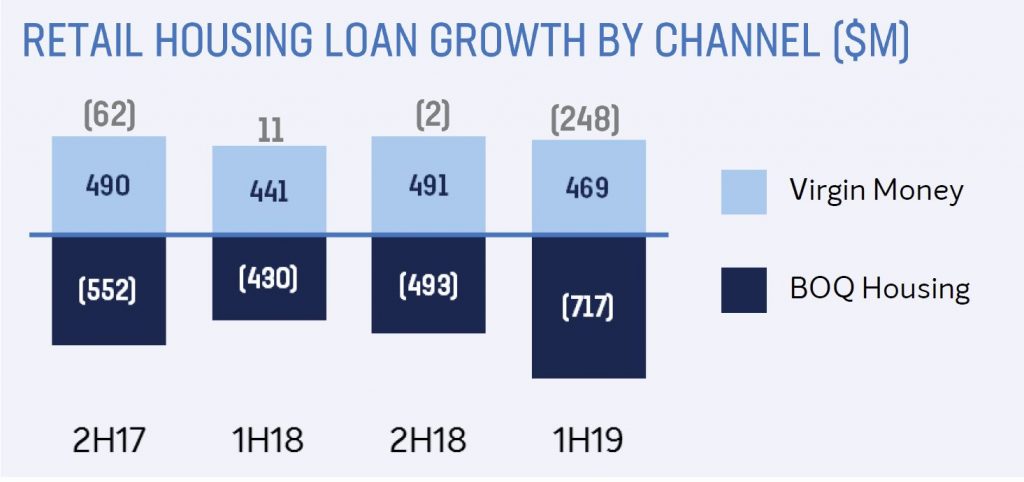
Gross loan growth was 2% in a slowing market, with housing growth through Virgin Money and BOQ Specialist, offset by contraction in branch network.
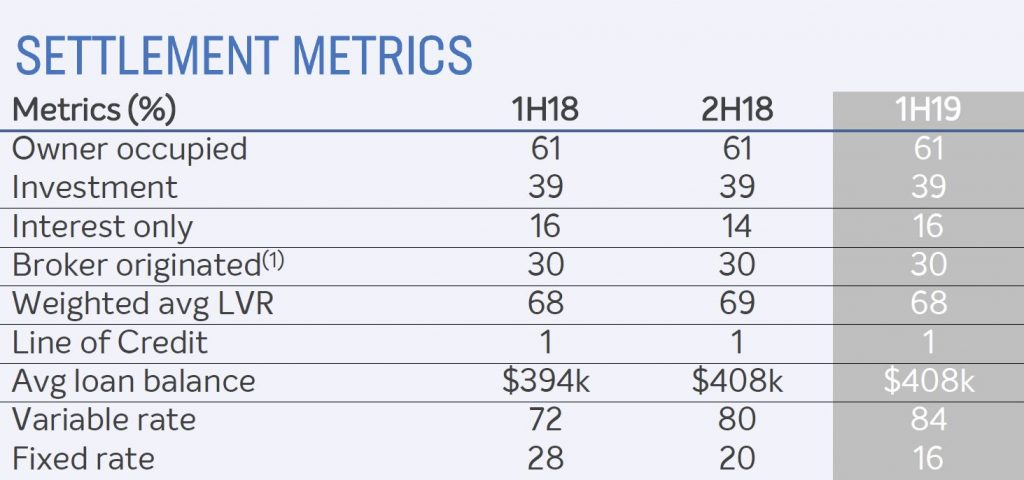
Home lending settlements included 39% investment lending (higher than the current industry average), 30% via brokers, and 16% interest only lending.
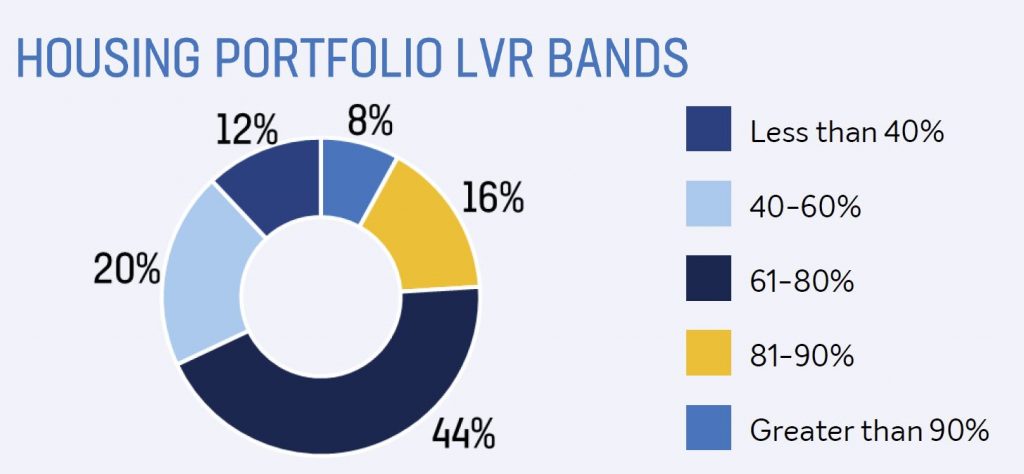
Home Lending LVR’s included 24% above 81% LVR in portfolio. Could become a problem is home prices go on falling.
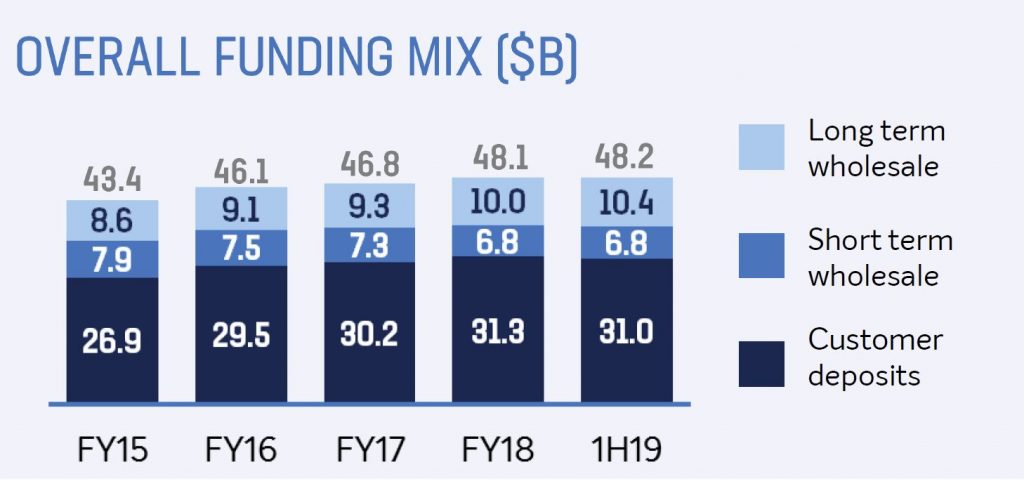
Customer deposits contracted, driven by a reduction in higher cost Term deposits, with a deposit to loan ratio of 68%
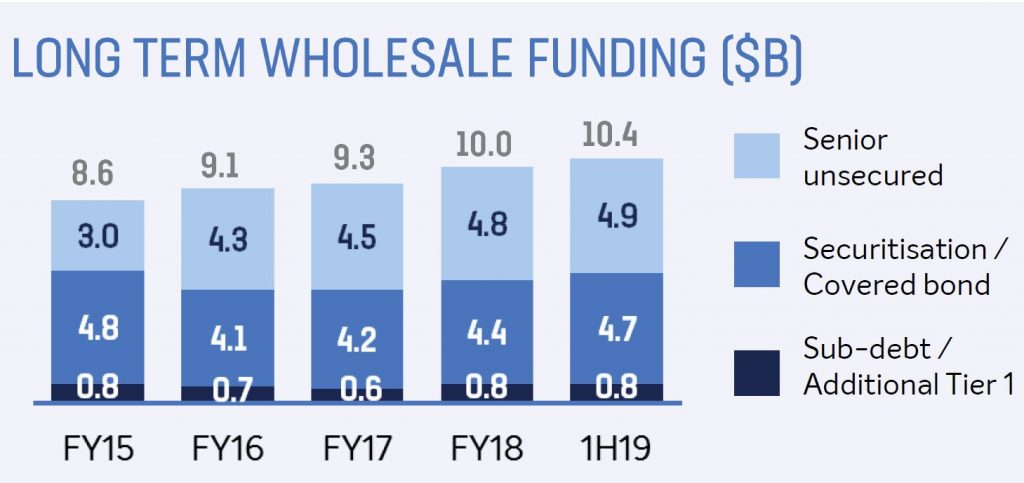
They took advantage of more favourable conditions for long term wholesale issuance
Net interest income was $215m, down 5% compared with 1H18 for the retail banks, and $216m, up 4% for the business bank.
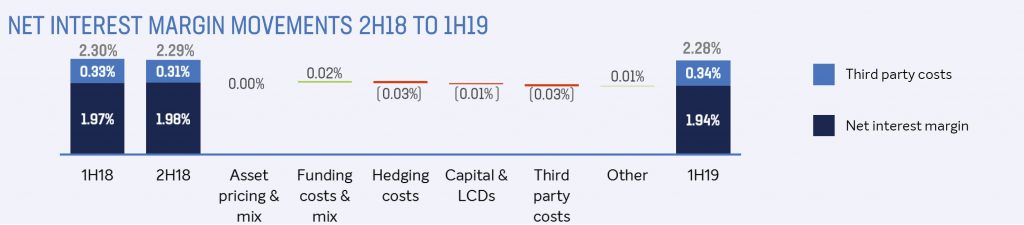
Net Interest Margin was down 4 basis points to 1.94%
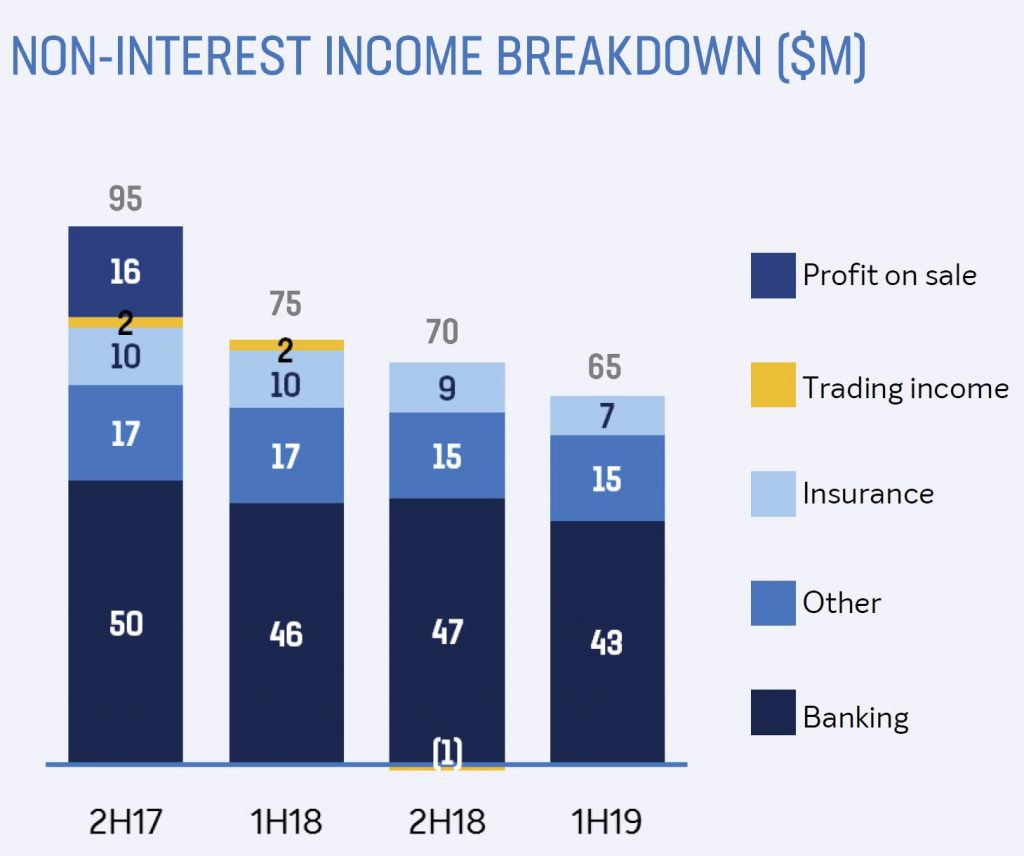
Non interest income was lower at $65m compared with $75m 1H18.
Their cost to income ratio was up 190 bps to 49.5%; They expect amortisation to increase with ongoing investment, plus rising regulatory & compliance costs expected going forward. In fact BOQ took a further $3m below the line for regulatory and compliance spend and $1m for legacy costs.
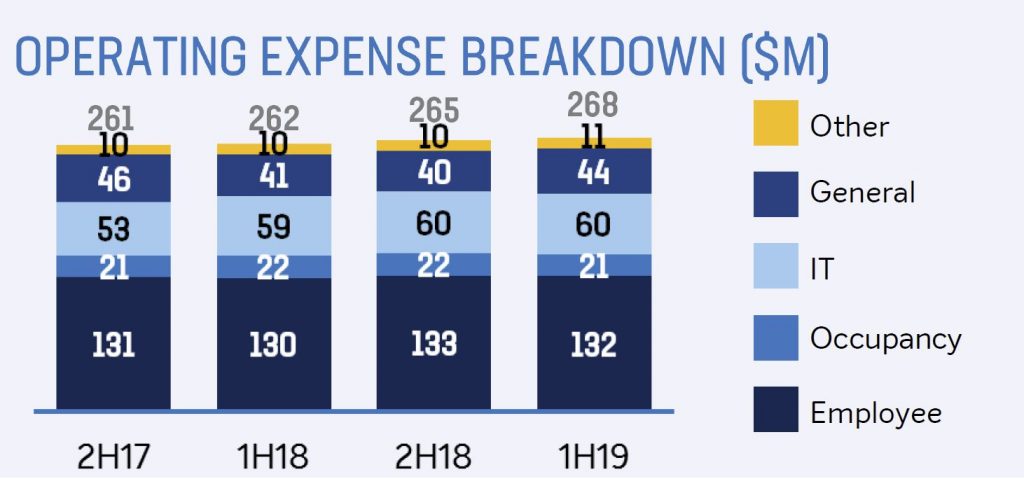
Operating expense growth was 2% to $268m and they expect higher costs ahead, with an additional $10m for regulatory costs.
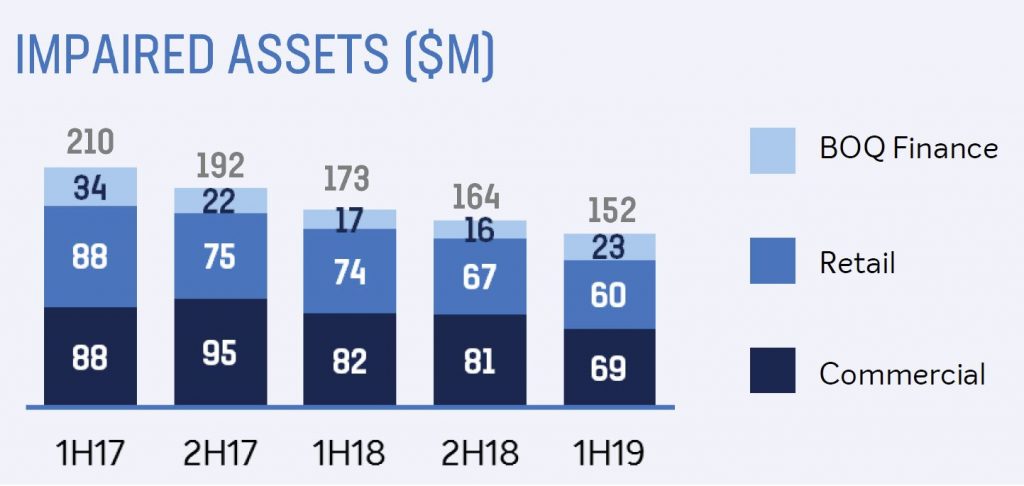
Impaired assets were down to $152m 1H19.
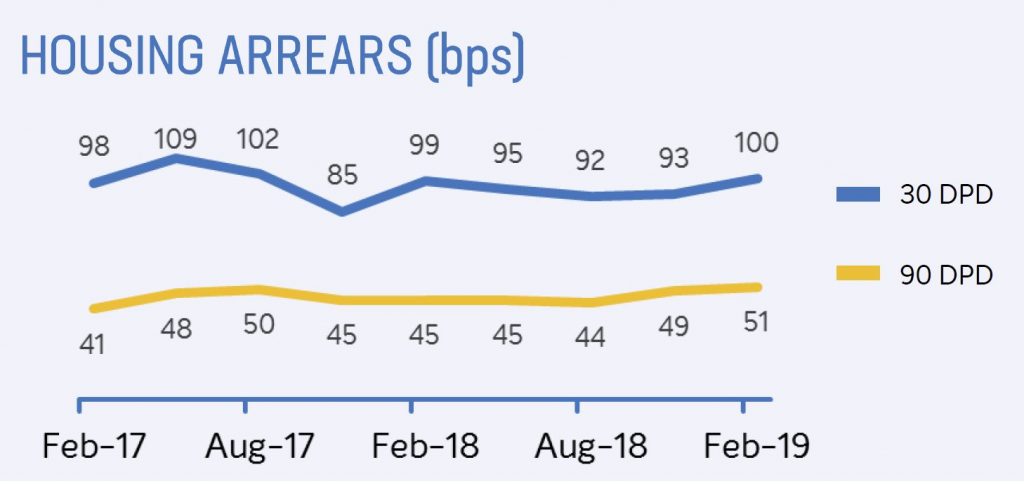
They reported a loan impairment expense of $30 million or 13 basis points of gross loans. There was an uptick in housing arrears.
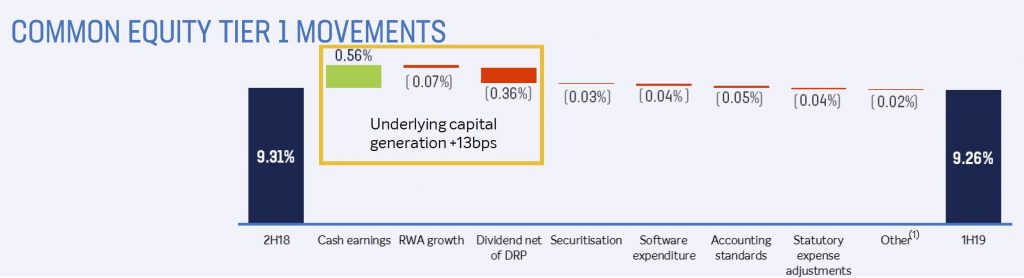
Common Equity Tier 1 (CET1) capital ratio of 9.26%, down from 9.31% 2H18.
The basic earnings per share down 10% to 41.8 cents on 1H18, but 13% down on 2H18.
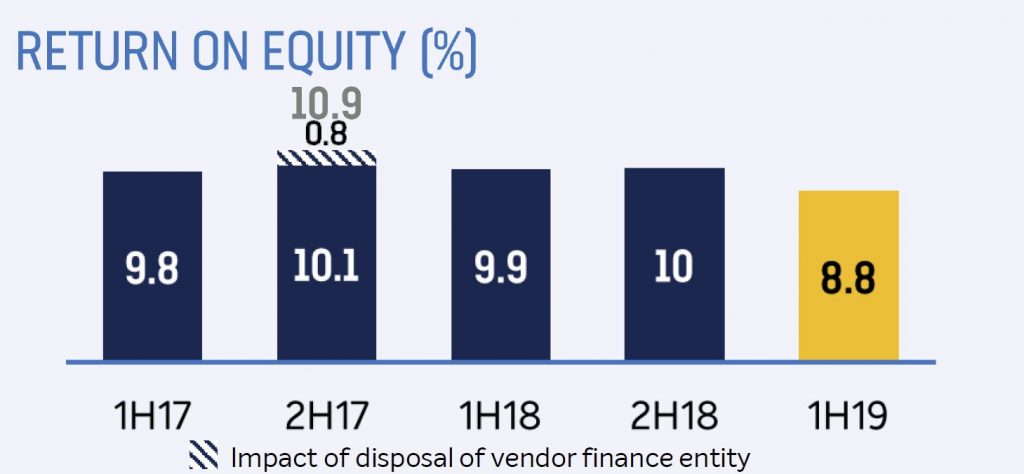
Their return on average ordinary equity was down 110 bps to 8.8%
The fully franked interim dividend was 34 cents per ordinary share, down from 38 cents.
Drawing from his direct experience in the market, mortgage broker and financial adviser Chris Bates and I discuss the latest issues and consider the impact of negative gearing reform.
Chris can be found at www.wealthful.com.au & www.theelephantintheroom.com.au plus via LinkedIn: https://www.linkedin.com/in/christopherbates
ASIC has released KordaMentha Forensic’s final report on CBA’s advice compensation program under its additional licence conditions.
CBA has offered approximately $9.3 million to customers whose advice has been reviewed as a result of the licence conditions imposed by ASIC in August 2014.
ASIC had imposed additional conditions on the Australian financial
services (AFS) licences of CBA’s Commonwealth Financial Planning Ltd and
Financial Wisdom Ltd with the consent of the licensees in August 2014,
and appointed KordaMentha Forensic as the independent expert to monitor
the licensees’ compliance with the additional licence conditions.
ASIC took this action because the licensees did not apply review and
remediation processes consistently to customers of 15 financial
advisers, disadvantaging some customers. The additional licence
conditions required that CBA offer compensation for inappropriate advice
that caused financial loss (where applicable) and offer affected
customers up to $5,000 to get independent advice from an accountant,
financial adviser or lawyer.
KordaMentha Forensic has produced five reports since the licence conditions took effect. In the first report, the Comparison Report, KordaMentha
Forensic identified inconsistencies in treatment of clients and
required the licensees to correct the inconsistencies for approximately
2,740 customers.
In the second report, the Identification Report,
KordaMentha Forensic found that the licensees had taken reasonable
steps in 2012 to identify which clients of the 15 advisers had to be
included in the compensation program.
KordaMentha Forensic also found that the licensees had taken
reasonable steps to identify other potentially high-risk advisers, but
that the licensees had not adequately reviewed advice given by 17 of
those advisers. To address this, KordaMentha Forensic prescribed the
scope of the additional reviews (of the 17 advisers) that the licensees
had to undertake.
KordaMentha then produced three additional reports describing the
licensees’ compliance with the conditions, the additional steps that the
licensees were required to take, and the compensation outcomes. Compliance Report Parts 1 & 2 assessed
the steps taken by the licensees to communicate with and compensate
(where applicable) customers of 15 former advisers for advice provided
between 2003 and 2012.
Compliance Report Part 3 described
the licensees’ review of the 17 potentially high-risk advisers and
KordaMentha Forensic’s conclusion that the licensees should apply the
compensation program to customers of five of those advisers.
In the final report, Compliance Report Part 4,
published today, KordaMentha Forensic covers the last of CBA’s advice
compensation program under the licence conditions. The report states
that CBA has offered a further $2.3 million to 232 clients of the five
advisers. This is in addition to:
$4.95 million (including interest) offered to customers of different
advisers under the licence conditions (reported in KordaMentha
Forensic’s Compliance Report Parts 1 & 2);
$1.9 million (including interest) offered to additional customers as
a result of CBA’s review outside the licence conditions. The need for
these reviews was identified during the licence conditions process.
This means that CBA has offered approximately $9.3 million to
customers whose advice has been reviewed as a result of the licence
conditions imposed by ASIC in August 2014.