GDP Sags Below Expectation In September 2017

The ABS released the National Accounts to September 2017 today.  The expectation was a 0.7% lift in GDP, but it came in 0.6%. This gives an annual read of 2.3%, well short of the hoped for 3%+. Seasonally adjusted,  growth was 2.8%. Business investment apart, this is a weak and concerning result.  The terms of trade fell.

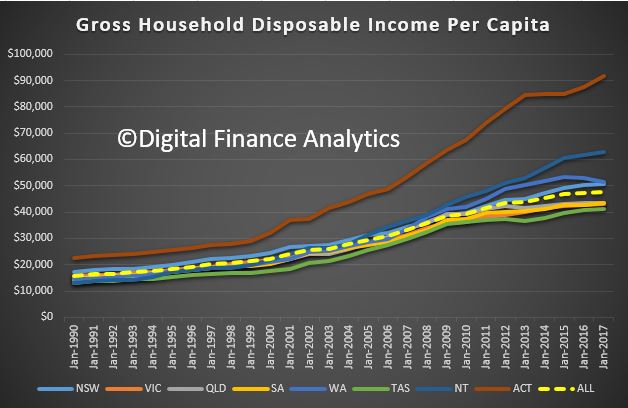
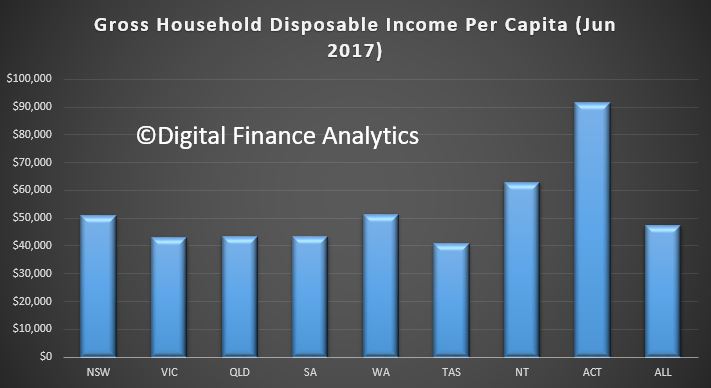
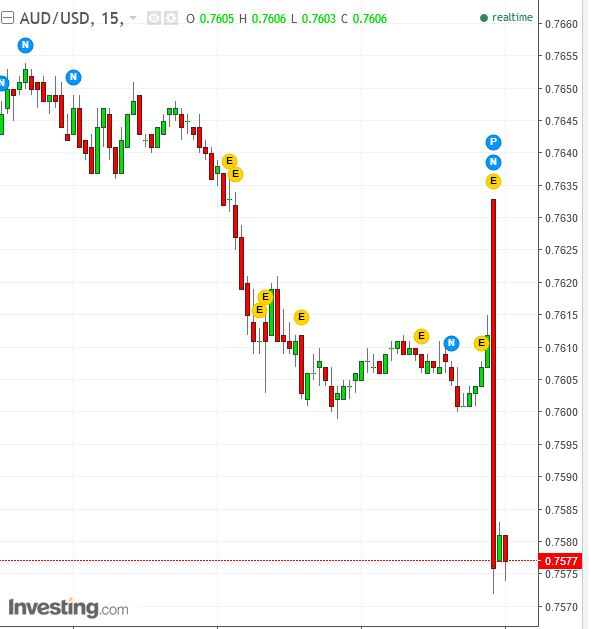
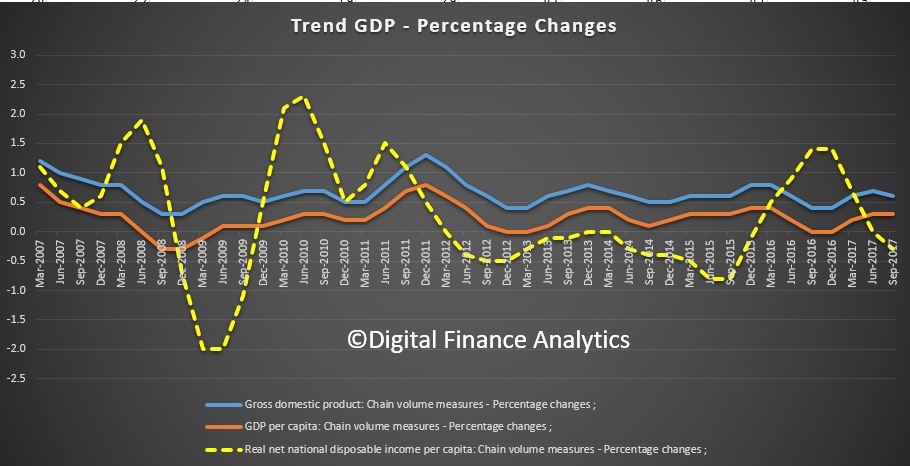
The GDP per capita and net disposable income per capita both fell, which highlights the basic problem the economy faces.  The dollar fell on the news.

Actually, we need to reboot our thinking on economic progress, as a quest for continual growth on the current settings will lead us into the gutter. Time for some fresh ideas. But then it seems that the alignment between potential growth, and lifts in tax take which follow makes this difficult.

The Australian economy grew 0.6 per cent in seasonally adjusted chain volume terms in the September quarter 2017, according to figures released by the Australian Bureau of Statistics (ABS) today.

Chief Economist for the ABS, Bruce Hockman, said: “Increased activity in both private business investment and public infrastructure underpinned broad growth across the industries.”

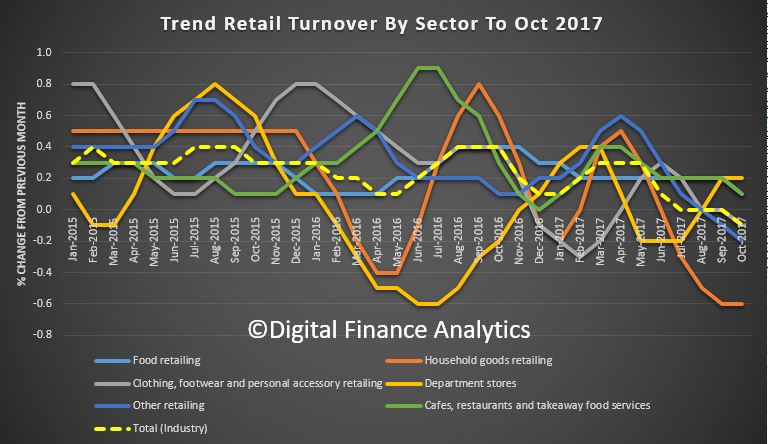
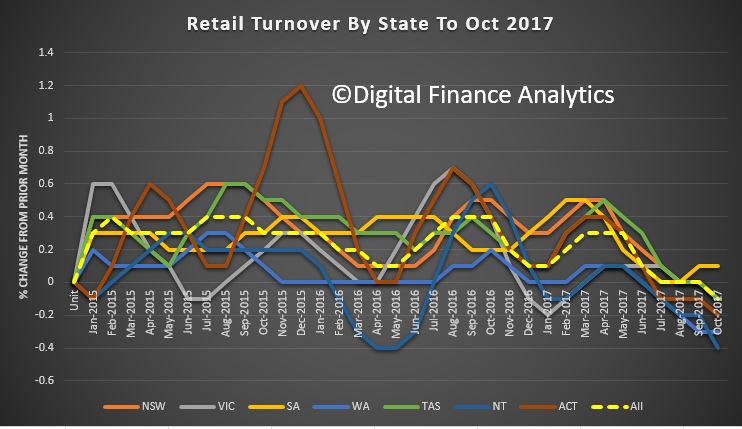
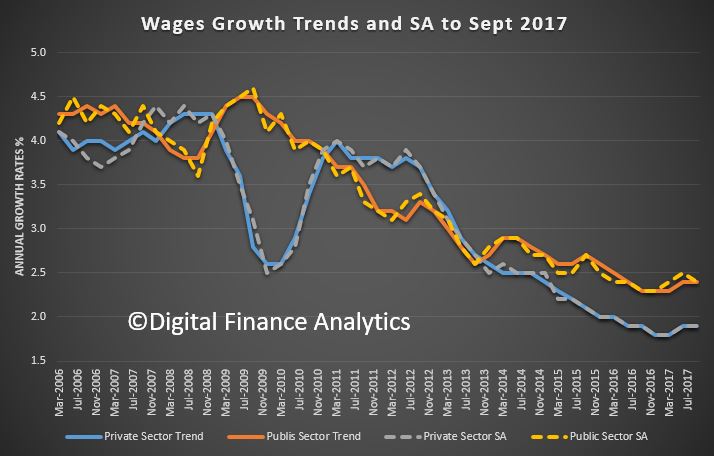
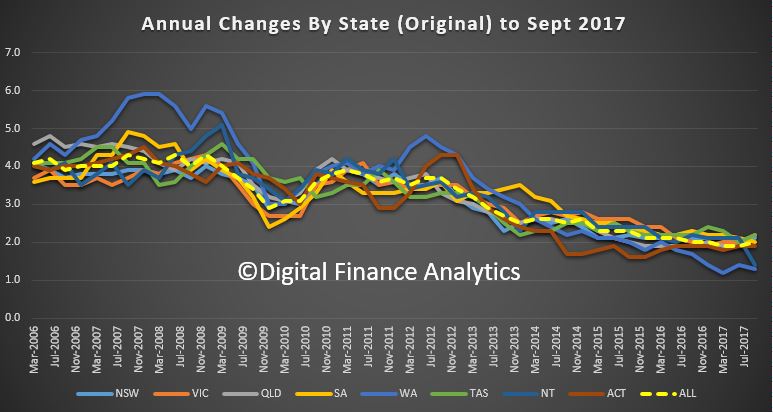
Compensation of employees (COE) increased in all states and territories, resulting in a national quarterly growth of 1.2 per cent and growth of 3.0 per cent since the September quarter 2016. Despite higher household income, household consumption was weak at 0.1 per cent, in line with the retail trade estimates. This weak household spending combined with growth in household income resulted in an increase in the household saving ratio for the first time in five quarters.

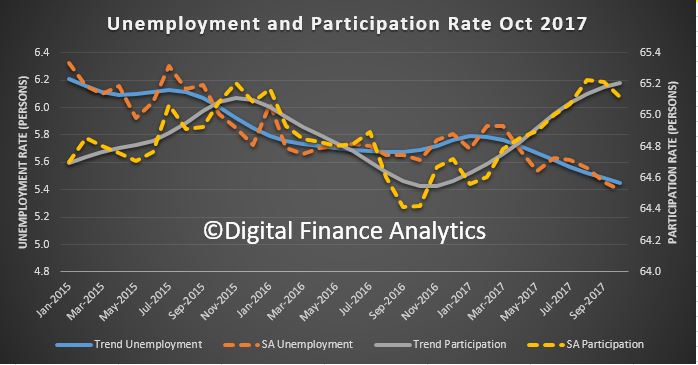
Mr Hockman added: “The increase in wages was consistent with the stronger employment and hours worked data that has been reported in the labour force survey.”

Net exports contribution to growth was flat this quarter despite higher Mining production and exports of coal and iron ore. The terms of trade fell 0.4 per cent on the back of lower export prices.

17 out of 20 industries recorded positive growth this quarter driven by Professional, Scientific and Technical Services, Health Care and Social Assistance and Manufacturing. A longer-term analysis of the changing drivers of the economy, from an industry perspective, is provided in a feature article included in this quarter’s publication.

Trend Retail Turnover Still Stagnant In October

According to the ABS, the trend estimate for Australian retail turnover fell 0.1 per cent in October 2017 following a relatively unchanged estimate (0.0 per cent) in September 2017. Compared to October 2016 the trend estimate rose 1.8 per cent. Trend estimates smooth the statistical noise.

Food retailing rose 0.1% in trend terms, Housing good retailing fell 0.6%, Clothing and footwear fell 0.1%, Department stores rose 0.2% and cafes and food services rose 0.1%.

Looking across the states, again in trend terms, NSW and VIC both fell 0.1%, WA fell 0.3%, NT fell 0.4% and ACT fell 0.2%. SA was the only state to register a rise, of 0.1%.

Online retail turnover contributed 4.7 per cent to total retail turnover in original terms.

For the record, Australian retail turnover rose 0.5 per cent in October 2017, seasonally adjusted, and follows a 0.1 per cent rise in September 2017.

In seasonally adjusted terms, all states rose. There were rises in Victoria (1.0 per cent), New South Wales (0.3 per cent), South Australia (1.2 per cent), Western Australia (0.5 per cent), Queensland (0.1 per cent), the Northern Territory (1.7 per cent), the Australian Capital Territory (0.6 per cent) and Tasmania (0.5 per cent).

Dwelling Approvals Rise 0.7 per cent in October Thanks to Victoria

Growth in Victoria has driven total dwelling approvals higher in October (up by more than 20% in that state), whilst there was a fall in New South Wales.  We are still seeing the strongest demand for property in VIC, thanks to strong migration, though supply and demand is patchy as the recent ANU study highlighted.

The number of dwellings approved rose 0.7 per cent in October 2017, in trend terms, and has risen for nine months, according to data released by the Australian Bureau of Statistics (ABS) today.

“Dwelling approvals have continued to strengthen in recent months, rising above 19,000 dwellings in October 2017,” said Justin Lokhorst, Director of Construction Statistics at the ABS. “This is the first time the series has reached this level since August 2016.”

Dwelling approvals increased in October in Tasmania (4.1 per cent), Victoria (3.8 per cent), South Australia (0.6 per cent), Western Australia (0.3 per cent) and Northern Territory (0.3 per cent), but decreased in the Australian Capital Territory (5.3 per cent), Queensland (1.7 per cent) and New South Wales (0.3 per cent) in trend terms.

In trend terms, approvals for private sector houses rose 0.6 per cent in October. Private sector house approvals rose in Queensland (1.4 per cent), Victoria (1.2 per cent) and South Australia (1.0 per cent), but fell in Western Australia (1.0 per cent) and New South Wales (0.7 per cent).

In seasonally adjusted terms, dwelling approvals increased by 0.9 per cent in October, driven by a rise in private house approvals (1.5 per cent), while private dwellings excluding houses fell 1.0 per cent.

The value of total building approved rose 0.5 per cent in October, in trend terms, and has risen for 10 months. The value of residential building rose 0.8 per cent while non-residential building was flat.

The ACT Is Another Country

The ABS has released their analysis of individual state accounts to Jun 2017.

This includes an estimate of average gross household disposable income per capita. The variations across states are significant and interesting. Of note is the astronomical value, and trajectory of individuals in the ACT, relative to everywhere else.  In addition, we see a decline in gross incomes in WA (one reason why mortgage defaults are rising there).

Households in TAS and SA are, on average on the lower rungs. The slowdown in income growth is also visible.

This goes a long way to explaining the high current levels of mortgage stress we observe, because home prices, mortgages and credit growth are all rising faster than income. NSW and VIC, then QLD are worse hit.


Trend unemployment rate remains at 5.5 per cent

The monthly trend unemployment rate remained at 5.5 per cent in October 2017, according to figures released by the Australian Bureau of Statistics (ABS) today. This reflects the continued strength in employment growth in the Australian labour market.

Monthly trend full-time employment increased for the 13th straight month in October 2017. Full-time employment grew by a further 16,000 persons in October, while part-time employment increased by 4,000 persons.

“Full-time employment has now increased by around 289,000 persons since October 2016, and makes up the majority of the 347,000 person net increase in employment over the period,” Chief Economist for the ABS, Bruce Hockman, said.

“Over the past year, trend employment increased by 2.9 per cent, which is above the average year-on-year growth over the past 20 years (1.9 per cent).”

The labour force participation rate remained at 65.2 per cent for a second month, the highest it has been since April 2012.

The trend monthly hours worked increased by 3.5 million hours (0.2 per cent), with the annual figure also showing strong growth (3.1 per cent). This is consistent with the continued growth in full-time employment.

Mr Hockman added: “Over the past year, the states and territories with the strongest annual growth in employment were Queensland (4.6 per cent), ACT (3.1 per cent), Tasmania (3.0 per cent) and Victoria (2.8 per cent).”

Trend series smooth the more volatile seasonally adjusted estimates and provide the best measure of the underlying behaviour of the labour market.

The seasonally adjusted number of persons employed increased by 4,000 in October 2017. The seasonally adjusted unemployment rate decreased by 0.1 percentage points to 5.4 per cent and the labour force participation rate decreased to 65.1 per cent.

Wages Growth Stalls Again

The seasonally adjusted Wage Price Index (WPI) rose 0.5 per cent in the September quarter 2017 and 2.0 per cent over the year, according to figures released today by the Australian Bureau of Statistics (ABS). This was below consensus expectation, and continues the slow grind in household income, for many falling below the costs of living.  Those in the public sector continue to do better than those in the private sector.

The WPI, seasonally adjusted, has recorded quarterly wages growth in the range of 0.4 to 0.6 per cent for the last 13 quarters (from the June quarter 2014).

ABS Chief Economist Bruce Hockman said: “Annual wages growth increased marginally to 2.0 per cent in the September quarter 2017. The higher wage growth in the September quarter was driven by enterprise agreement increases, end of financial year wage reviews and the Fair Work Commission’s annual minimum wage review.”

Seasonally adjusted, private sector wages rose 1.9 per cent and public sector wages grew 2.4 per cent through the year to the September quarter 2017.

In original terms, through the year wage growth to the September quarter 2017 ranged from 1.2 per cent for the Mining industry to 2.7 per cent for Health care and social assistance and Arts and recreation services.

Western Australia recorded the lowest through the year wage growth of 1.3 per cent and Victoria, Queensland and Tasmania the highest of 2.2 per cent.

Housing Lending – Down the Gurgler?

The latest housing finance data from the ABS confirms what we already knew, lending momentum is on the slide, and first time buyers, after last months peak appear to have cooled. With investors already twitchy, and foreign investors on the slide, the level of buyer support looks anemic. Expect lots of “special” refinance rates from lenders as they attempt to sustain the last gasp of life in the market.

Here is the count of new FTB loans by selected states. Clearly those new incentives (some would say bribes) did not hold up for long, as underwriting standards have tightened partially offsetting the potential benefits. .  Of course these are original numbers, so they are not corrected for seasonal variations, but the direction seems clear across multiple states, even Victoria, which has been driving the demand recently.

So, no surprise that we see the number of new loans to first time buyers down 6.3%, or 630 on last month. The number of non-first home buyer commitments decreased 8.0% so the number of first home buyer commitments as a percentage of total owner occupied housing finance commitments rose to 17.4% in September 2017 from 17.2% in August.

We also see a fall in fixed loans, down 14%.  The DFA sourced investor first time buyers also fell again, down 4%.

Here is the first time buyer tracker, down overall.

More broadly, the flow of new loans was down $19 million or 0.06% to $33.1 billion. Within that, investment lending flows, in trend terms, fell 0.52% or $62.8 million to $12.1 billion, while owner occupied loans rose 0.32% or $47.7 million to $15.0 billion.  So investment flows were still at 44.6% of all flows, excluding refinances.

Refinances comprise 17.9% of all flows, down 0.07% or $3.9 million, to $5.9 billion.

Looking in more detail at the ABS trend categories, OO lending flows for construction of new dwellings rose 0.4%, by $8.3 million to $2 billion, purchase of new dwellings rose $15 million or 1.29% to $1.2 billion; and purchase of OO existing dwellings rose 0.2% or $23 million to $11.8 billion. Investment new construction fell 1.57% or $16.5 million to $1.0 billion, purchase of housing by individuals for investment rose 0.14% or $13.9 million to $10.1 billion and investment property by other borrowers fell 5.9% down $60m to $950 million.

Finally, the original housing stock data shows that total ADI lending for housing rose 0.32%, or $5 billion to $1.57 trillion. Within that owner occupied stock rose rose 0.35% or $3.7 billion to $1.05 trillion and investment property lending rose 0.17% of 0.9 billion to $558 billion.

ABS Revises CPI Weightings, Will They Lead the Measure Lower?

The Australian Bureau of Statistics has now released their paper which describes the changes that will be made to the Consumer Price Index (CPI) and Selected Living Cost Indexes (SLCIs) as a result of the introduction of the 17th series expenditure patterns.

There are quite a number of technical changes, as well as different weights for specific items. Housing and power costs for example will be higher. From 2018, the CPI will be re–weighted annually in December quarters

This is likely to lead to a lower headline CPI rate, perhaps by around 0.25% or more (DFA estimate), though there are various offsetting adjustments, so we cannot be sure.  More noise in the numbers!

The first publications based on the 17th series will be in respect of the December quarter 2017, which are due to be released on 31 January 2018 (CPI) and 7 February 2018 (SLCIs).

Australia has produced indexes of retail price inflation going back as far as 1901. Prior to the introduction of the CPI in 1960, there were five series of retail price indexes compiled by the (then) Commonwealth Bureau of Census and Statistics. Since 1960, the Australian Bureau of Statistics (ABS) has maintained a program of periodic reviews of the CPI to ensure that it continues to meet community needs. The main objective of these reviews is to update the household expenditure information used to set the item weights in the CPI, but they also provide an opportunity to reassess the scope and coverage of the index.

The SLCIs, incorporating the Pensioner and Beneficiary Living Cost Index (PBLCI) and the Analytical Living Cost Indexes (ALCIs) have also been reviewed as part of the 17th series. These indexes are produced as a by-product of the CPI, with weights also derived from the Household Expenditure Survey (HES).

The 17th series review is a minor review of the CPI and SLCIs, consisting of an update of the upper level (expenditure class) weights in line with the latest HES, and a simple examination of structures and methodologies.

This information paper provides an overview of the changes to the CPI and SLCIs that will be introduced with the 17th series from the December quarter 2017. It describes the household expenditure data used to calculate the weights and the ways in which some of the data have been adjusted to align with CPI and SLCI requirements. The paper also presents the updated weighting patterns and some background on the major shifts in weights between the 16th and 17th series. There are no changes to the classification structure or publications in respect of the 17th series.

They also continue to explore options for a more frequent and timely monthly measure.

Retail Turnover Remains Sluggish In September

More evidence that many households are under financial pressure.

Australian retail turnover was relatively unchanged (0.0 per cent) in September 2017, according to the latest Australian Bureau of Statistics (ABS) Retail Trade figures.

The trend estimate for Australian retail turnover was relatively unchanged (0.0 per cent) in September 2017 and relatively unchanged (0.0 per cent) in August 2017. Compared to September 2016 the trend estimate rose 2.0 per cent.

In seasonally adjusted terms, there were rises in food retailing (0.6 per cent), department stores (2.1 per cent), and cafes, restaurants and takeaway food services (0.3 per cent). There were falls in other retailing (-1.7 per cent), household goods retailing (-0.4 per cent), and clothing, footwear and personal accessory retailing (-0.7 per cent) in September 2017. This follows a seasonally adjusted fall of -0.5 per cent in August 2017.

In trend terms, there were falls in WA, NT and ACT. NSW had a 0.1% rise compared to last month.

In seasonally adjusted terms, there were rises in New South Wales (0.2 per cent), Queensland (0.3 per cent), South Australia (0.7 per cent), Tasmania (0.6 per cent), and the Australian Capital Territory (0.1 per cent). There were falls in Western Australia (-1.3 per cent), and the Northern Territory (1.7 per cent). Victoria was relatively unchanged (0.0 per cent).

Online retail turnover contributed 4.4 per cent to total retail turnover in original terms.

In seasonally adjusted volume terms, turnover rose 0.1 per cent in the September quarter 2017, following a rise of 1.5 per cent in the June quarter 2017. “The main contributor to the quarterly volume rise was food retailing (0.9 per cent) but there was also rises in clothing, footwear and personal accessory retailing (0.7 per cent) and other retailing (0.4 per cent),” said Ben James, the Director of Quarterly Economy Wide Surveys. “A fall in Household goods retailing (-1.6 per cent) offset these rises.”

Dwelling approvals rise 1.8 per cent in September

The latest ASB data shows that the number of dwellings approved rose 1.8 per cent in September 2017, in trend terms, and has risen for eight months.

Dwelling approvals increased in September in the Australian Capital Territory (7.9 per cent), Northern Territory (6.5 per cent), Tasmania (4.5 per cent), New South Wales (3.4 per cent), Western Australia (2.0 per cent), South Australia (1.5 per cent) and Victoria (0.7 per cent), but decreased in Queensland (0.5 per cent) in trend terms.

In trend terms, approvals for private sector houses rose 0.7 per cent in September. Private sector house approvals rose in Queensland (1.8 per cent), South Australia (1.2 per cent), Victoria (0.6 per cent) and New South Wales (0.5 per cent), but fell in Western Australia (0.9 per cent).

In seasonally adjusted terms, dwelling approvals increased by 1.5 per cent in September, driven by a rise in private dwellings excluding houses (2.6 per cent), while private house approvals rose 0.6 per cent.

The value of total building approved rose 1.3 per cent in September, in trend terms, and has risen for nine months. The value of residential building rose 1.5 per cent while non-residential building rose 1.0 per cent.

“The value of non-residential building approvals have risen for the past eight months, in trend terms, reaching a record high in September 2017.” Bill Becker, the Assistant Director of Construction Statistics at the ABS, said.

“The strength in non-residential building has been driven by approvals in Victoria, where a number of office and education buildings have been approved in recent months.”