The Australian economy expanded by 2.0% in chain volume terms in 2016-17. This is the 26th consecutive year of economic growth, but the lowest rate of growth since 2008-09.
Optimal growing conditions saw the agriculture industry make a robust contribution to economic growth, largely on the back of a bumper wheat crop and higher meat sales, which returned the highest annual income to farmers on record. Mining was the beneficiary of elevated commodity prices, but the industry’s growth in volume terms was subdued. Most of the expansion in mining came from oil and gas extraction, reflecting additional capacity coming online. Service-based industries also contributed to growth, highlighting the economy’s transition to service delivery.
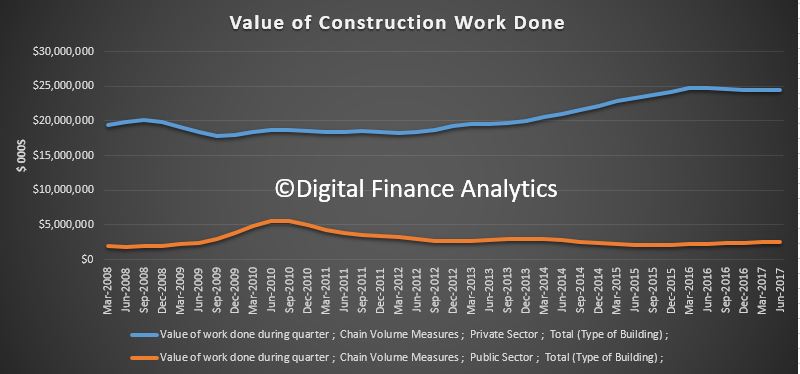
Household consumption expanded moderately in volume terms. Gross fixed capital formation fell for the fourth successive year, albeit only marginally, despite continuing strength in dwelling investment in 2016-17. New engineering construction continued to slide as the impact of the recent mining construction boom fades.
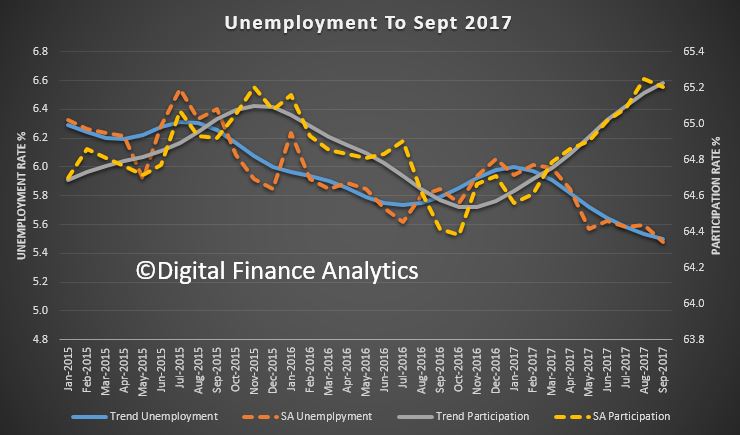
Weak wage growth resulted in compensation of employees rising 2.1%, the weakest annual rise since 1991-92. This, combined with a fall in social assistance benefits received by households during the year, caused the household saving ratio to fall to 4.6%, its lowest level since 2007-08.
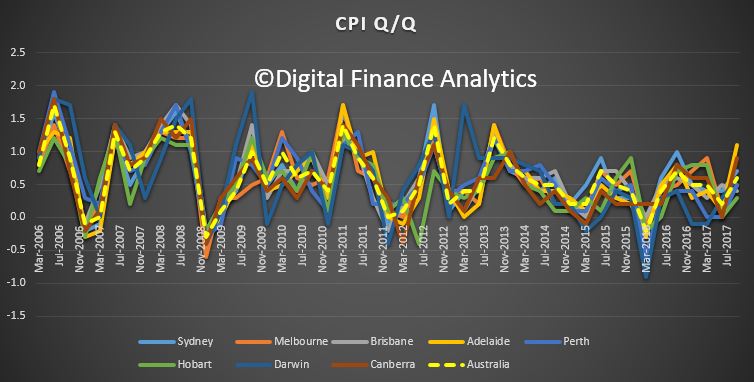
Price pressures in the domestic economy remained weak throughout 2016-17. Subdued domestic prices and wages drove the weakest annual rise in household consumption, in current price terms, on record. The terms of trade grew for the first time in 5 years, reflecting elevated prices received for key export commodities such as coal and iron ore. These prices boosted mining company profits, real net national disposable income, and overall export revenues, which sharply narrowed the current account deficit.
The Australian economy’s overall financial position improved during 2016-17, borrowing less in net terms from the rest of the world in any year since 2001-02. In current prices Australia’s net worth at 30 June 2017 is estimated at $11,377 billion.
AUSTRALIAN ECONOMY GROWS BY 2.0%
Australian Gross Domestic Product (GDP) grew by 2.0% in the 2016-17 year. This represents a 0.1pp upward revision from the annualised 2016-17 GDP estimates published in the June quarter national accounts. GDP per capita increased 0.4% as the Australian population grew by 1.5%.
GDP and GDP per capita, Volume measures

CONSUMPTION DRIVES ECONOMIC GROWTH IN 2016-17
Economic growth in 2016-17 was largely driven by consumption. Government consumption contributed 0.8pp to GDP growth, while household consumption contributed 1.2pp to growth. Gross fixed capital formation made no contribution to growth, with the impact of public sector capital expansion being cancelled out by the decline in private works. Net exports contributed 0.1pp.
CONTRIBUTIONS TO GDP(E) GROWTH, Volume measures
 Contributions may not add to GDP growth due to the statistical discrepancy.
HOUSEHOLD CONSUMPTION WEAK IN CURRENT PRICE TERMS
While household consumption contributed solidly to GDP growth in volume terms, growth in household expenditure as measured in current price terms of 3.0% is the lowest on record.
HOUSEHOLD FINAL CONSUMPTION EXPENDITURE, Current prices

MINING INVESTMENT CONTINUES TO FALL
In 2016-17, mining investment fell by 23.7%. This was the fourth consecutive fall in mining investment, with the level of investment now 58.1% lower than it was in 2012-13. The impact the fall in mining investment has had on GDP has been partially offset by investment in dwellings, which grew 5.2% in 2016-17.
Private sector gross fixed capital formation for non-mining industries grew 2.2% in 2016-17. Investment in non-mining is 15.1% higher than in 2012-13, with the strength being led by the information, media and telecommunications industry.
PRIVATE CAPITAL INVESTMENT, Current prices

SERVICES AND AGRICULTURE DRIVE GROWTH IN 2016-17 AS THE COMPOSITION OF AUSTRALIAN GROSS VALUE ADDED (GVA) CONTINUES TO SHIFT
In 2016-17, good growing conditions resulted in a large increase in the output of the Agriculture industry, contributing 0.4 percentage points to the yearly GDP growth in chain volume terms, the largest contribution from Agriculture in ten years. Health Care and Social Assistance, Professional Scientific and Technical Services and Financial and Insurance Services industry all contributed at least 0.3 percentage points to GDP growth this year.
This is consistent with the longer term trend being observed with these three industries along with Mining and Construction making up the largest share of the overall economy in 2016-17. This is in contrast to the 1996-97 year in which Manufacturing, Financial and Insurance Services and Public Administration and Safety were the top three contributors.
INDUSTRY SHARES OF GVA – Selected industries, Current prices
 GVA at basic prices of industries as a proportion of total GVA at basic prices
COMPENSATION OF EMPLOYEES SHARE OF TOTAL FACTOR INCOME FALLS
In 2016-17, the compensation of employees (COE) share of total factor income fell to 52.8%. This share is still higher than the lowest level recorded, but continues the long term decline from 57.1% in 1984-85. The series has been more volatile in the past 7-8 years with swings in the terms of trade impacting overall factor income.
The profit share (based on gross operating surplus) of total factor income was 26.5% for the 2016-17 year. This increase is due to the higher profits received by the mining industry this year due to the increase in the terms of trade. The current year share is less than the peak of 28.9% in 2008-09 but still higher than the 22.0% share observed in the mid-1980s. The profit share of total factor income should not be interpreted as a direct measure of ‘profitability’ for which it is necessary to relate profits to the level of capital assets employed.
WAGES SHARE OF TOTAL FACTOR INCOME

PROFITS SHARE OF TOTAL FACTOR INCOME

CHANGES TO INDUSTRY COMPENSATION OF EMPLOYEES OVER TIME
The industry share of COE has changed significantly over time. The Health Care and Social Assistance and Professional, Scientific and Technical Services industries had the largest proportion of total COE in 2016-17. The Manufacturing industry made up the highest share of COE in 1996-97 but this share has now fallen to 7.3%.
INDUSTRY SHARES OF COE – Selected industries, Current prices

HOUSEHOLD SAVING RATIO DECLINES
The household saving ratio was at its lowest point (4.6%) in nine years in 2016-17. This fall in net saving as a proportion of net disposable income can be attributed to slower growth in COE as well as a reduction in social assistance benefits received. The result this year is not isolated, and continues the downward trend seen in the past five years.
HOUSEHOLD SAVING RATIO

GDP CHAIN PRICE INDEX GROWTH DRIVEN BY STRONG EXPORT PRICES
The GDP chain price index grew by 3.8% in 2016-17. Strength in export prices (specifically coal and metal ore) drove this result. The domestic final demand chain price index rose 0.8% in 2016-17, which is the lowest reading of domestic price pressure since 1996-97.
CHAIN PRICE INDEXES

MARKET SECTOR MULTIFACTOR PRODUCTIVITY INCREASES
Market sector multifactor productivity (MFP) grew 0.6% in 2016-17. This result reflects a 1.9% increase in GVA and a 1.3% increase in labour and capital inputs. On a quality adjusted hours worked basis, MFP rose 0.3%, reflecting changes in labour composition. These changes were due to educational attainment and work experience.
On an hours worked basis, labour productivity grew 1.0%. On a quality adjusted hours worked basis, labour productivity grew 0.5%.
MARKET SECTOR PRODUCTIVITY, Hours worked basis

LOW INTEREST RATES ENTICE HOUSEHOLDS TO INVEST IN DWELLINGS AND LAND
Interest rates have been at historically low levels for a number of years, which has reduced the pressure on households in terms of the proportion of income spent paying interest on mortgages. Interest on dwellings accounted for 3.7% of total gross household income in 2016-17, compared to 5.3% in 2006-07.
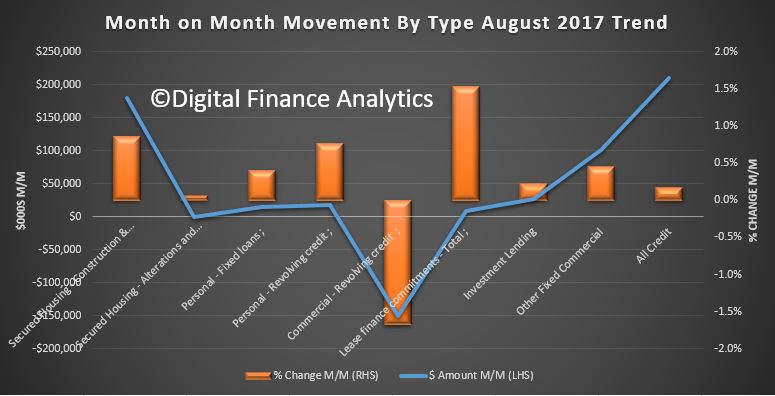
Households borrowed an additional $990 billion over the 10 year period from 2006-07, while the value of land and dwellings owned by households increased by $2,930 billion over the same period. Land and dwellings owned by households increased by $621 billion through 2016-17, boosted by the recent additions in dwelling stock.
In 1988-89, the value of dwellings and land held by households was 5.1 times the value of household borrowing. By 2006-07 this ratio was at 3.3, and it has been reasonably stable since. In 2016-17, land and dwellings owned by households covered their borrowing 3.1 times.
HOUSEHOLD INTEREST PAYABLE ON DWELLINGS – Relative to total gross household income, Current prices

HOUSEHOLD LAND AND DWELLING ASSETS – Relative to loans, Current prices

HOUSEHOLD INCOME AND WEALTH
Despite slow wage growth, household gross disposable income plus other changes in real net wealth increased $456.6 billion, or 32.6%, in 2016-17. This was largely due to a $306.5 billion appreciation in the value of land held by households.
Living standards and economic wellbeing are supported by wealth as well as income. Gross disposable income grows at a fairly constant rate over time, but its rate of growth has slowed in recent years. However, households reap gains and incur losses from holding assets, such as land, dwellings, equities and accumulated saving, which also bears on consumption patterns.
HOUSEHOLD INCOME AND WEALTH, Current prices


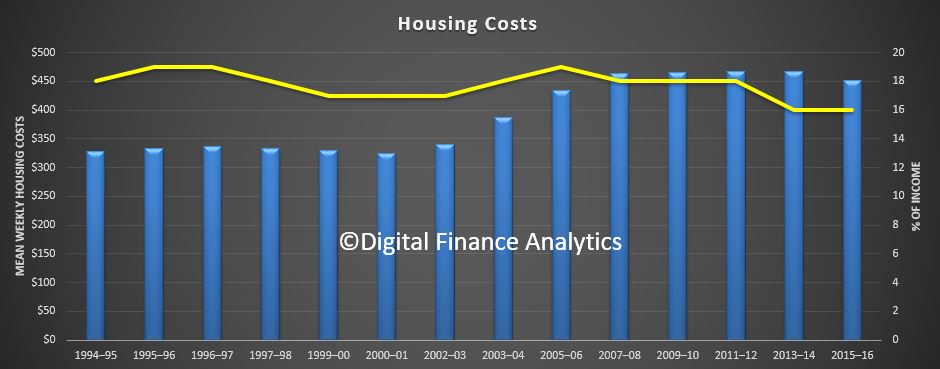
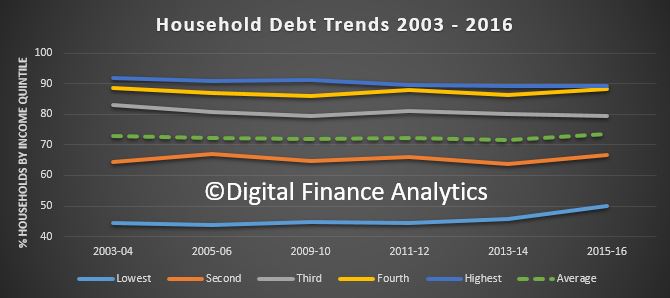 The ABS also said that in 2005-6 the proportion of households with debt more than three times income was 23.9%, while in 2015-16 it was 27.2%, up 3.3%.
 This underscores the issue we face, debt is higher, and more lower income families are more stretched. Sure, net worth may be higher now, but the debt (mostly mortgage debt) is the problem. As we saw last week, most of the growth in wealth is associated with home prices. Should they reverse, then this looks very wobbly.