Housing Lending – Down the Gurgler?

The latest housing finance data from the ABS confirms what we already knew, lending momentum is on the slide, and first time buyers, after last months peak appear to have cooled. With investors already twitchy, and foreign investors on the slide, the level of buyer support looks anemic. Expect lots of “special” refinance rates from lenders as they attempt to sustain the last gasp of life in the market.

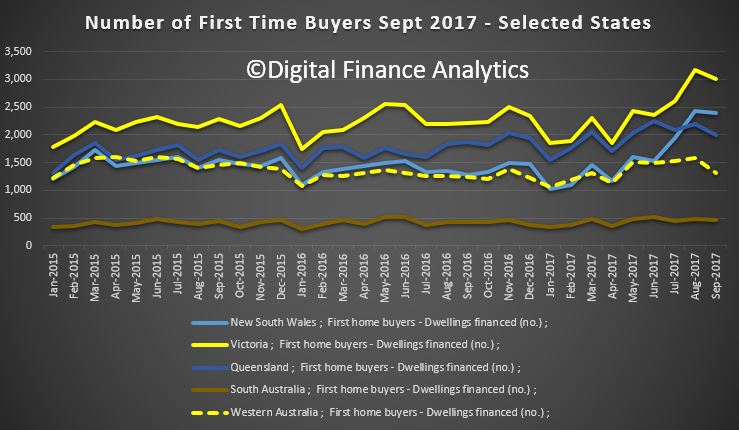
Here is the count of new FTB loans by selected states. Clearly those new incentives (some would say bribes) did not hold up for long, as underwriting standards have tightened partially offsetting the potential benefits. .  Of course these are original numbers, so they are not corrected for seasonal variations, but the direction seems clear across multiple states, even Victoria, which has been driving the demand recently.

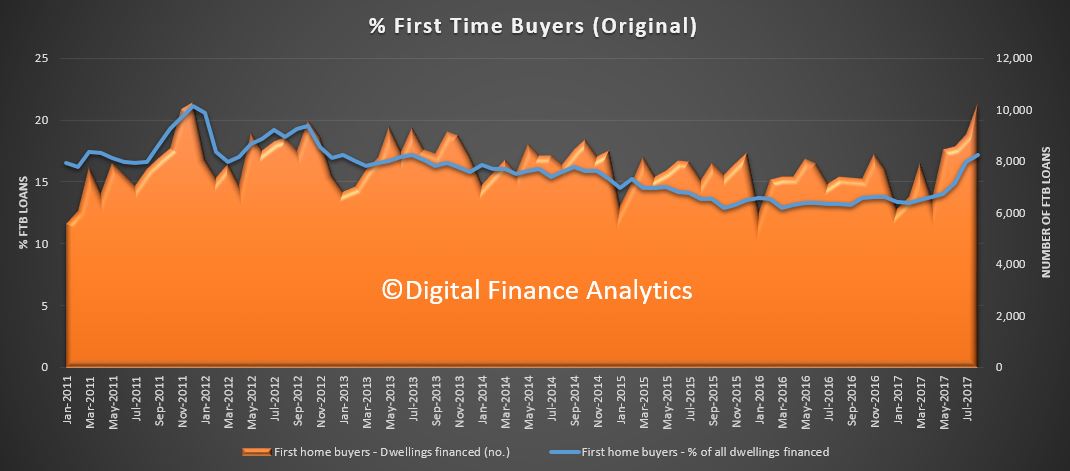
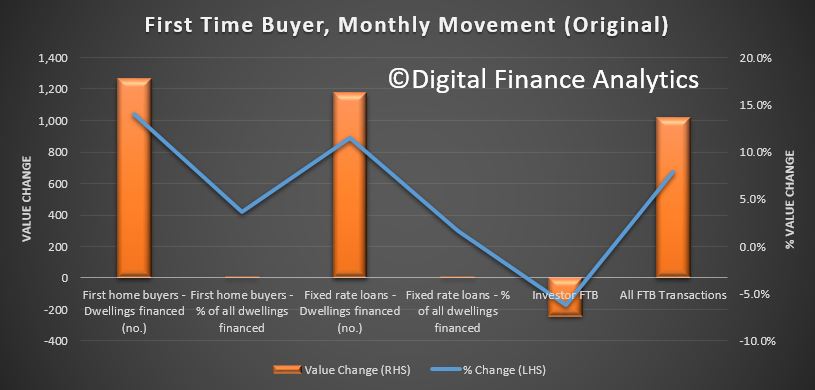
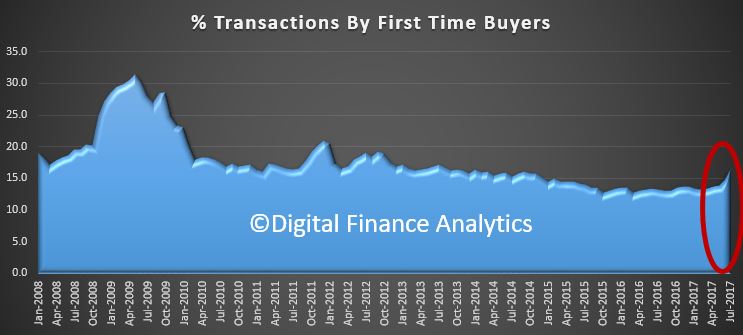
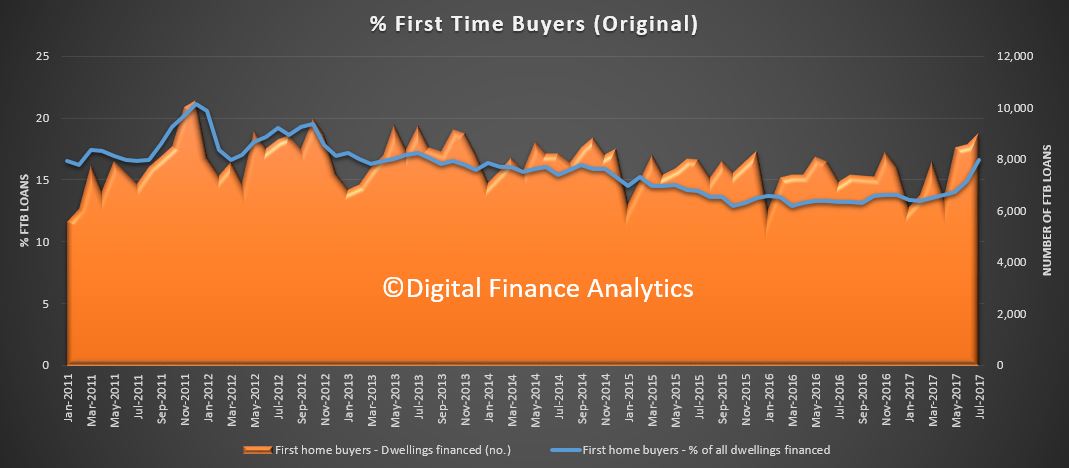
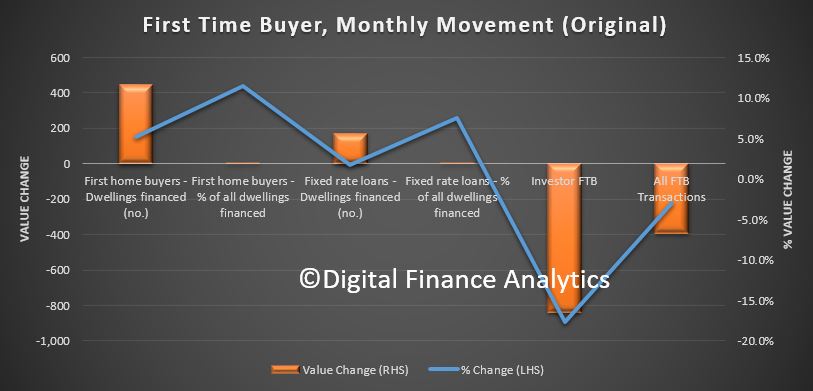
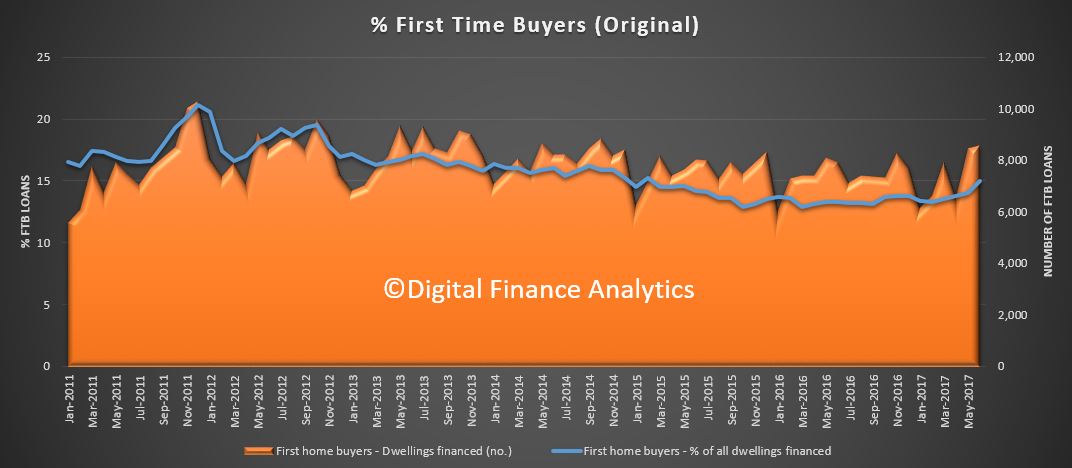
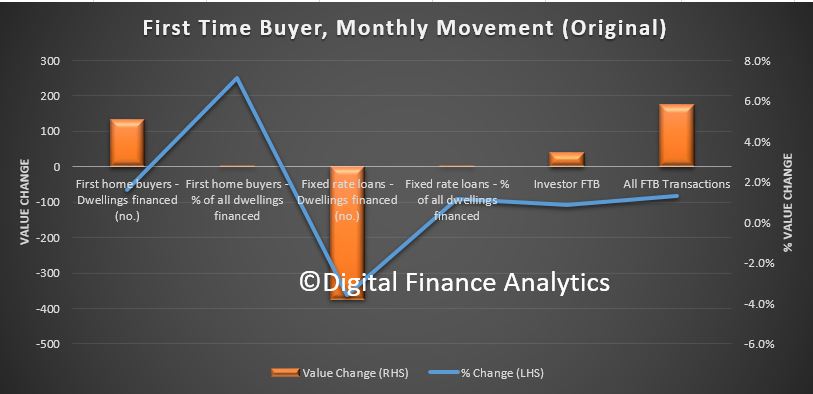
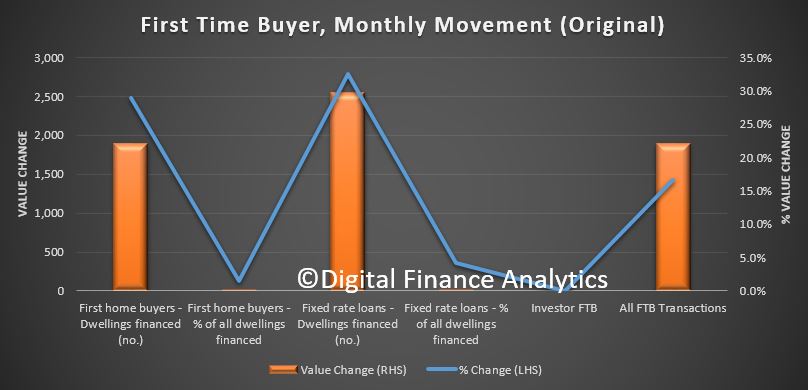
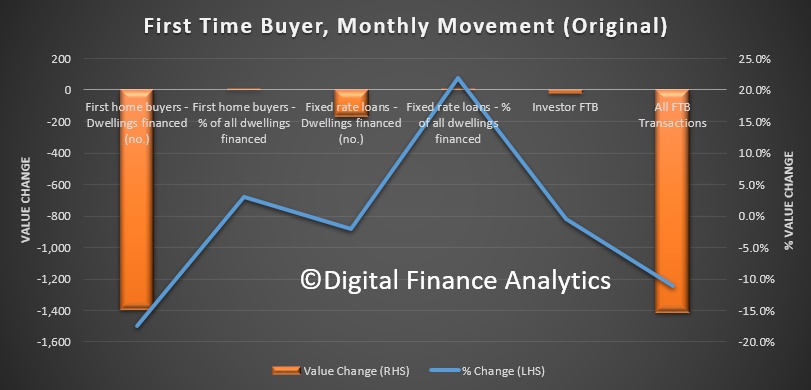
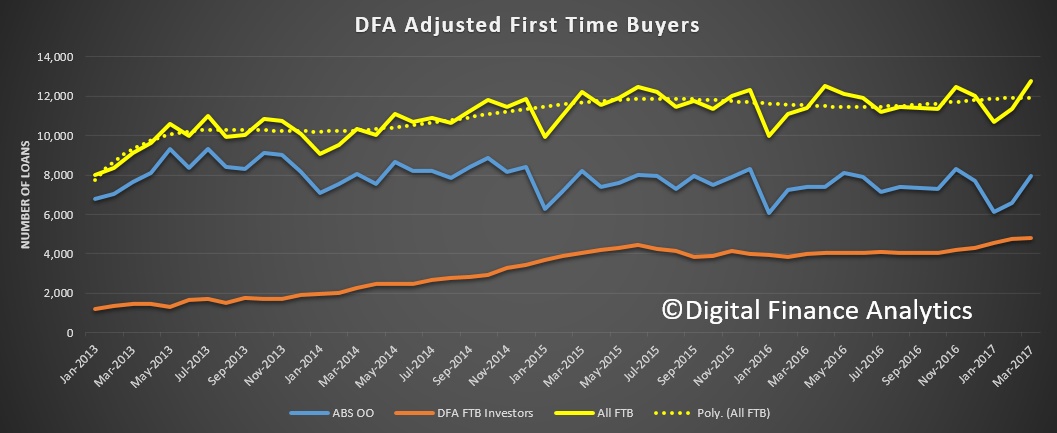
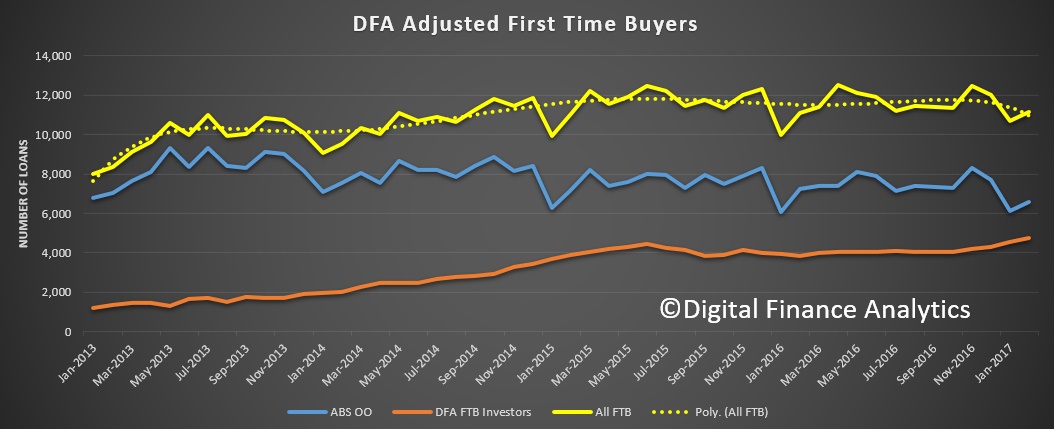
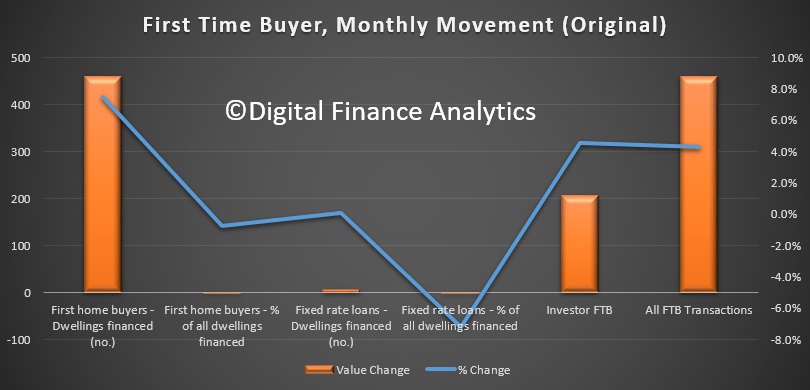
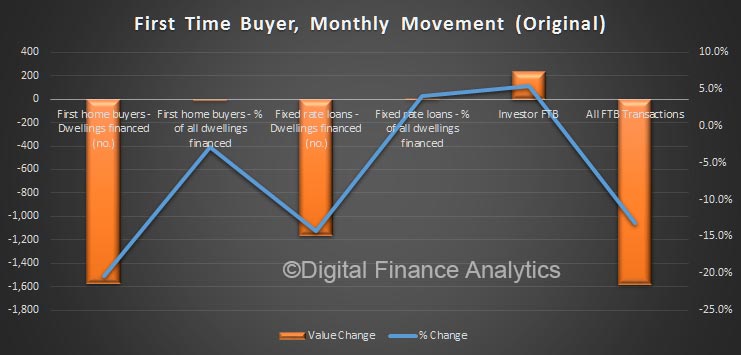
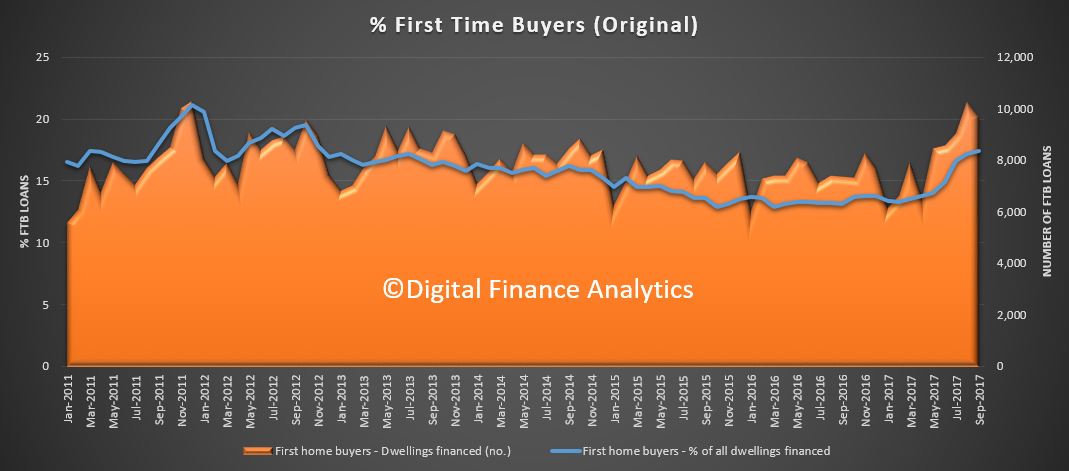
So, no surprise that we see the number of new loans to first time buyers down 6.3%, or 630 on last month. The number of non-first home buyer commitments decreased 8.0% so the number of first home buyer commitments as a percentage of total owner occupied housing finance commitments rose to 17.4% in September 2017 from 17.2% in August.

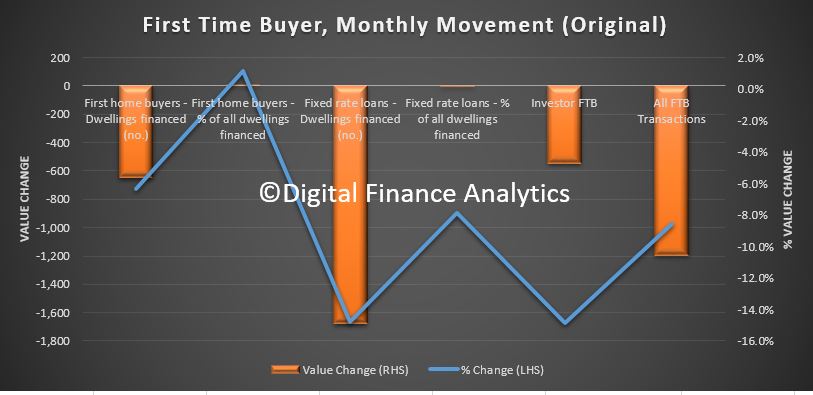
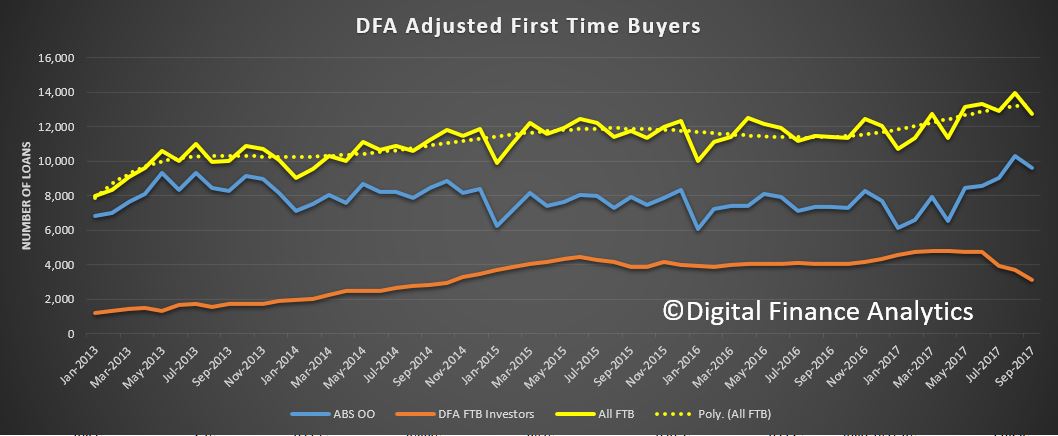
We also see a fall in fixed loans, down 14%.  The DFA sourced investor first time buyers also fell again, down 4%.

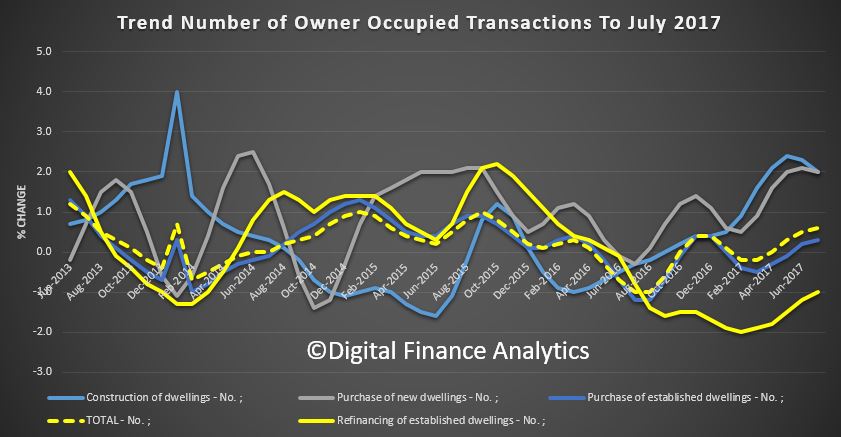
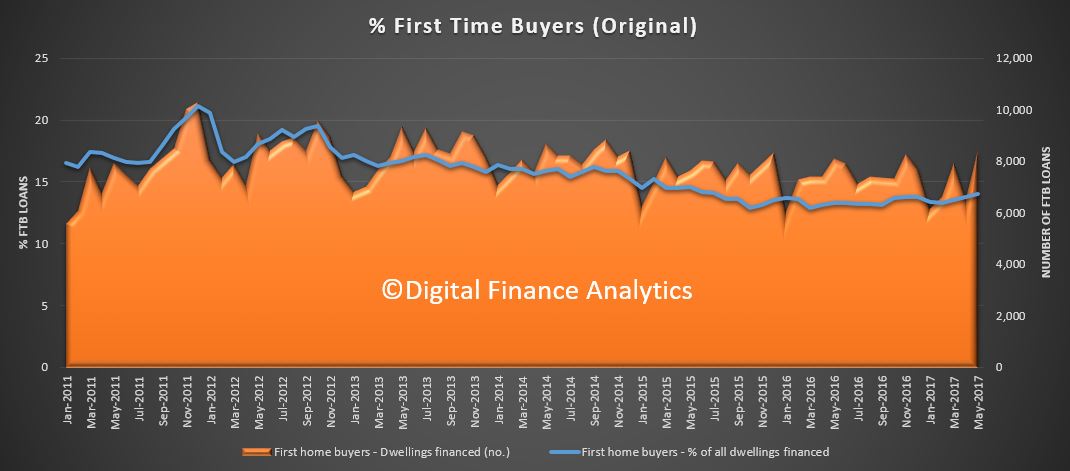
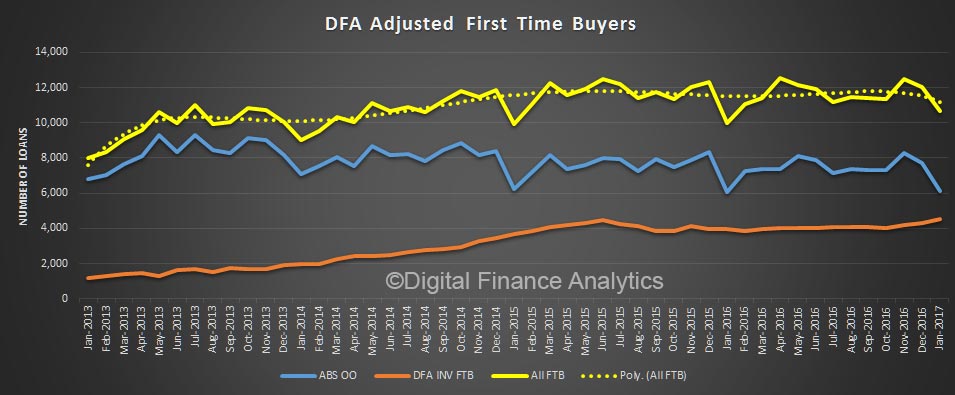
Here is the first time buyer tracker, down overall.

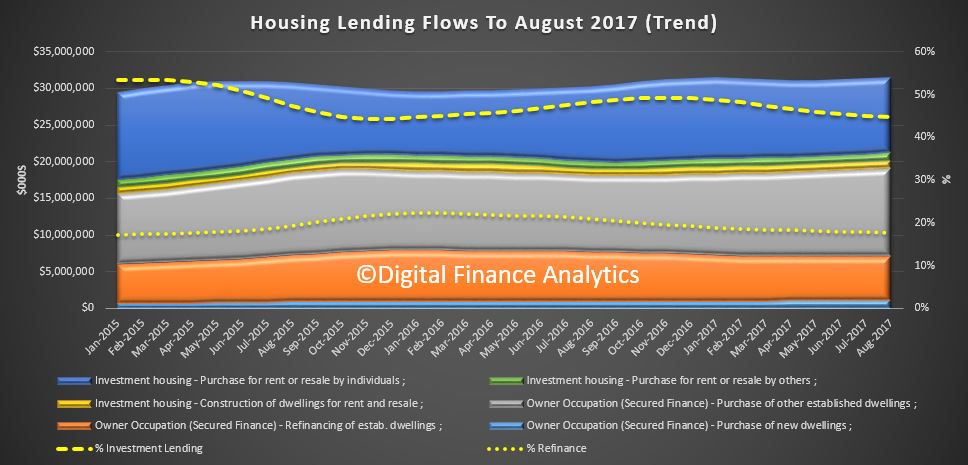
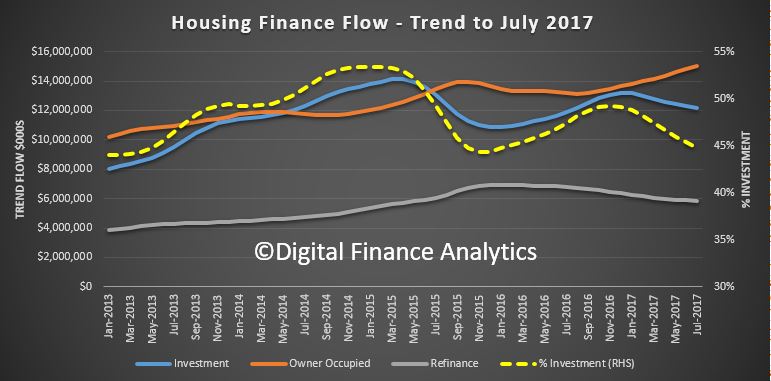
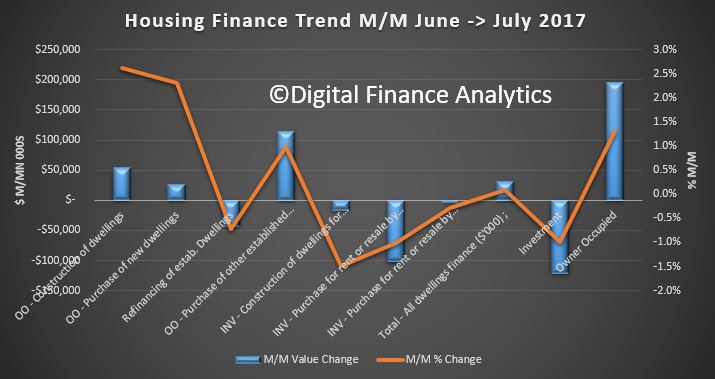
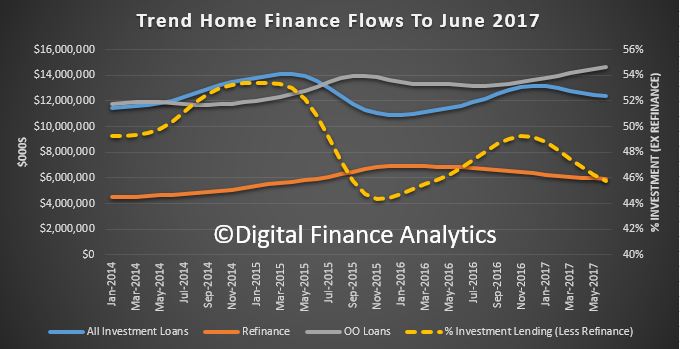
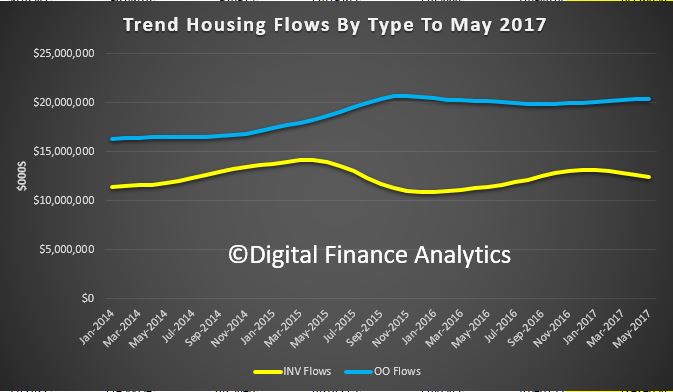
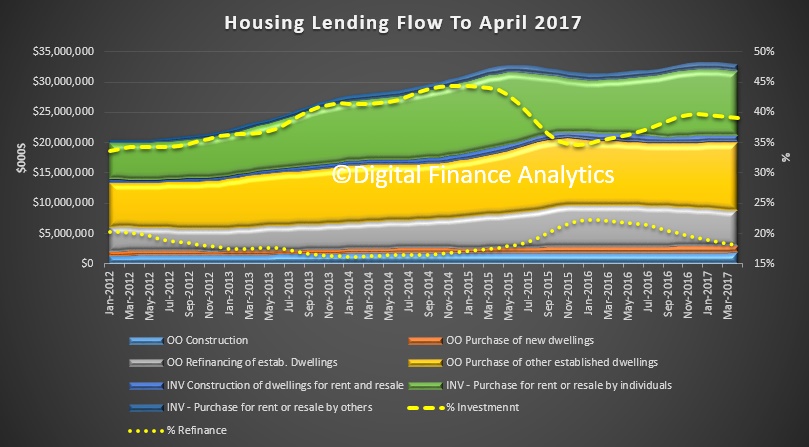
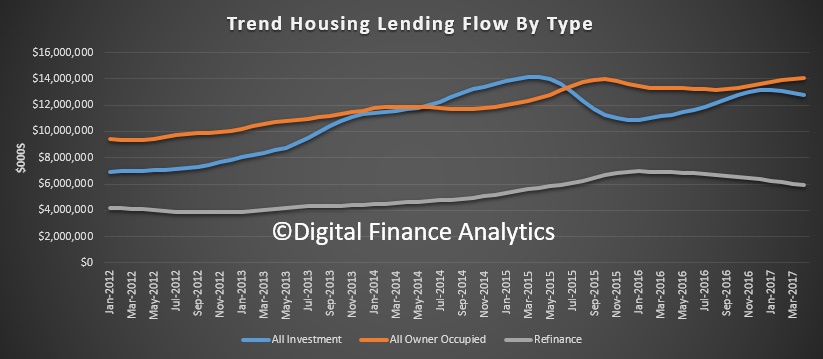
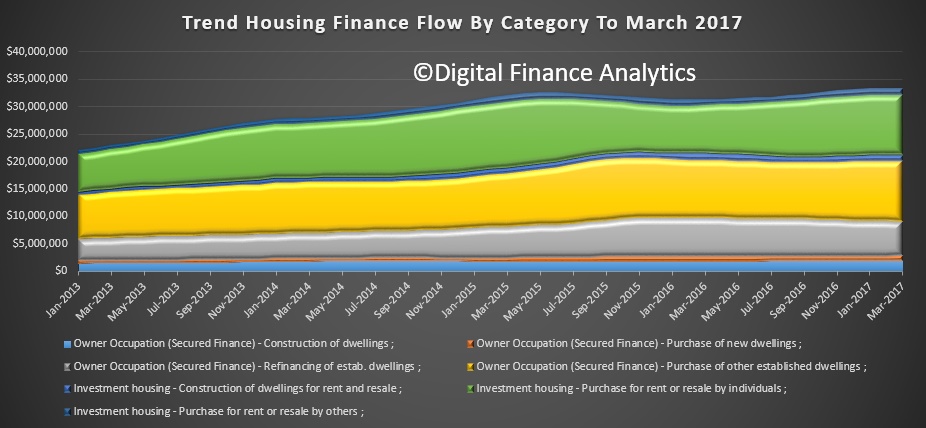
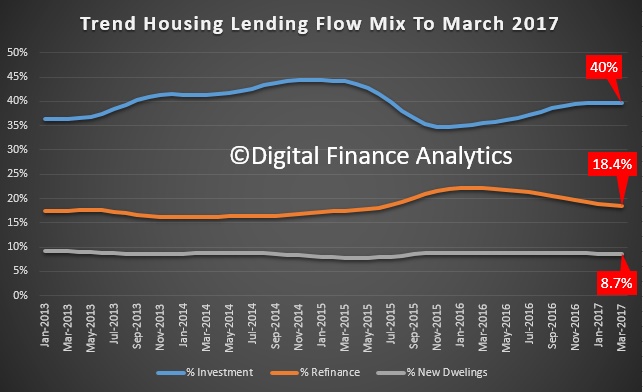
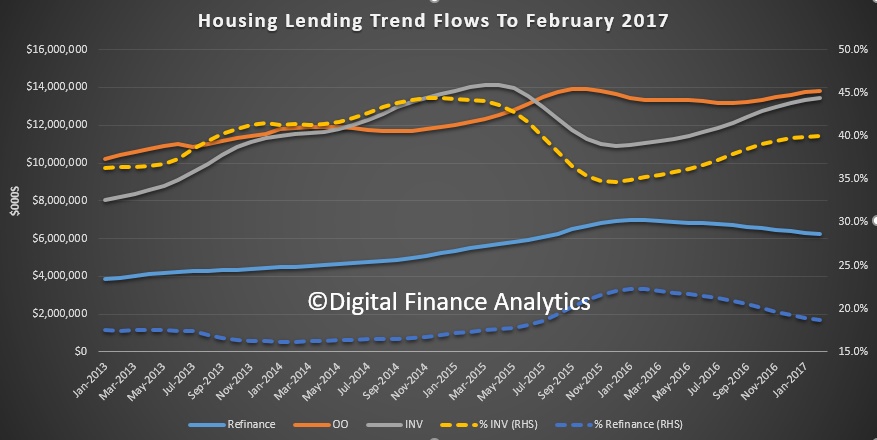
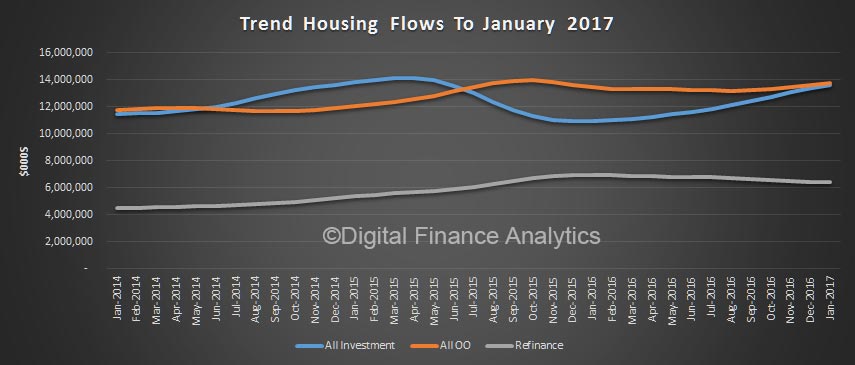
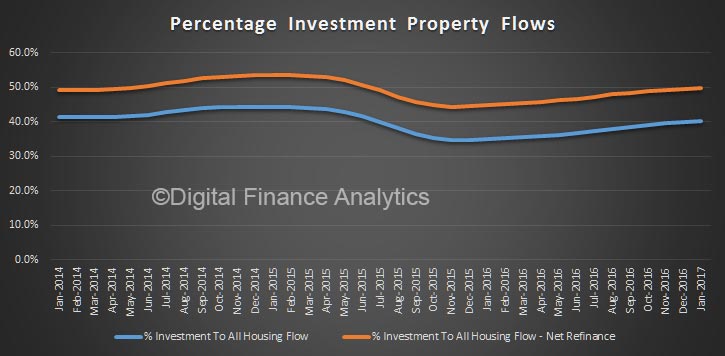
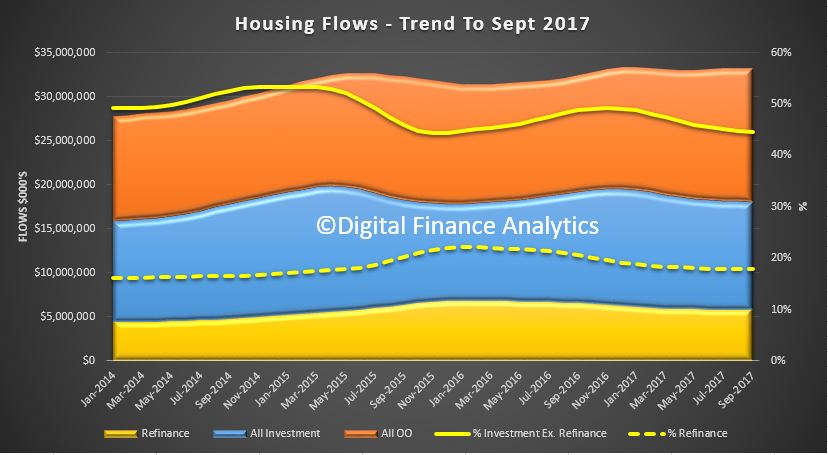
More broadly, the flow of new loans was down $19 million or 0.06% to $33.1 billion. Within that, investment lending flows, in trend terms, fell 0.52% or $62.8 million to $12.1 billion, while owner occupied loans rose 0.32% or $47.7 million to $15.0 billion.  So investment flows were still at 44.6% of all flows, excluding refinances.

Refinances comprise 17.9% of all flows, down 0.07% or $3.9 million, to $5.9 billion.

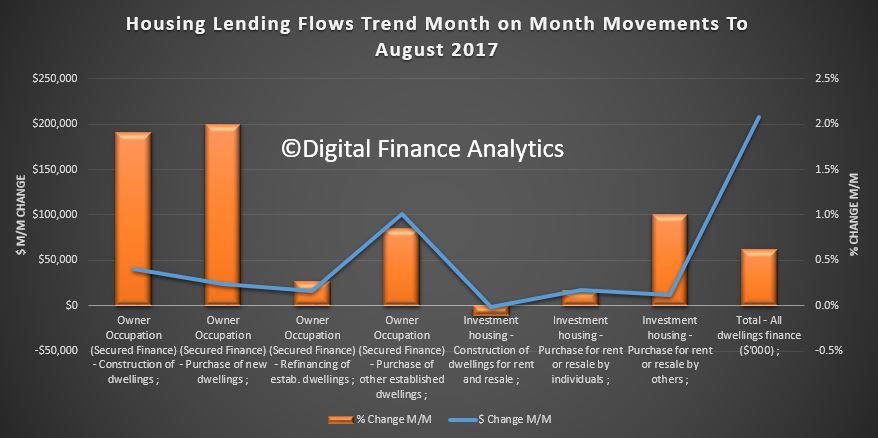
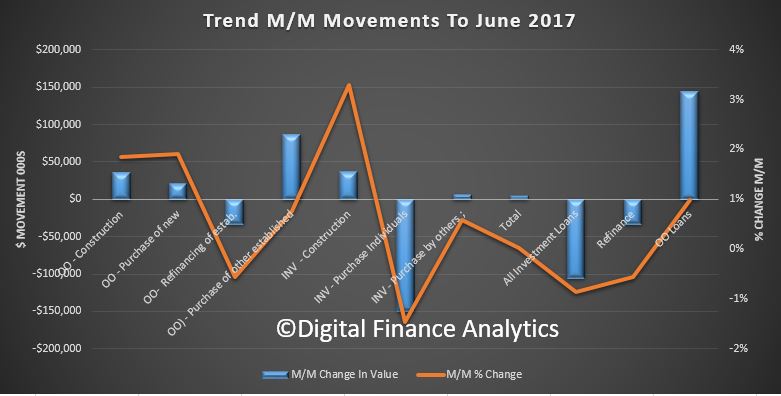
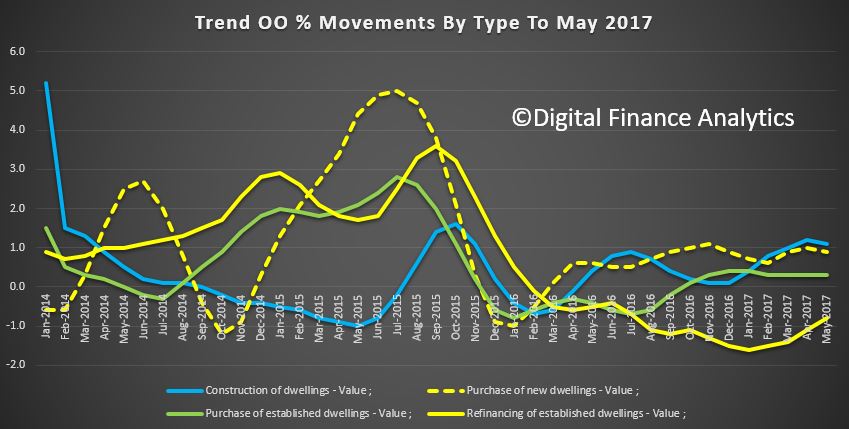
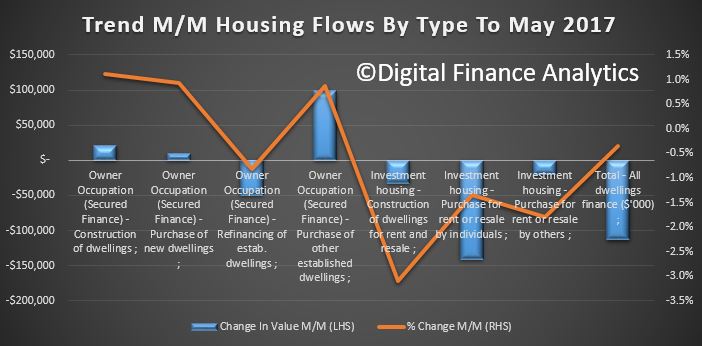
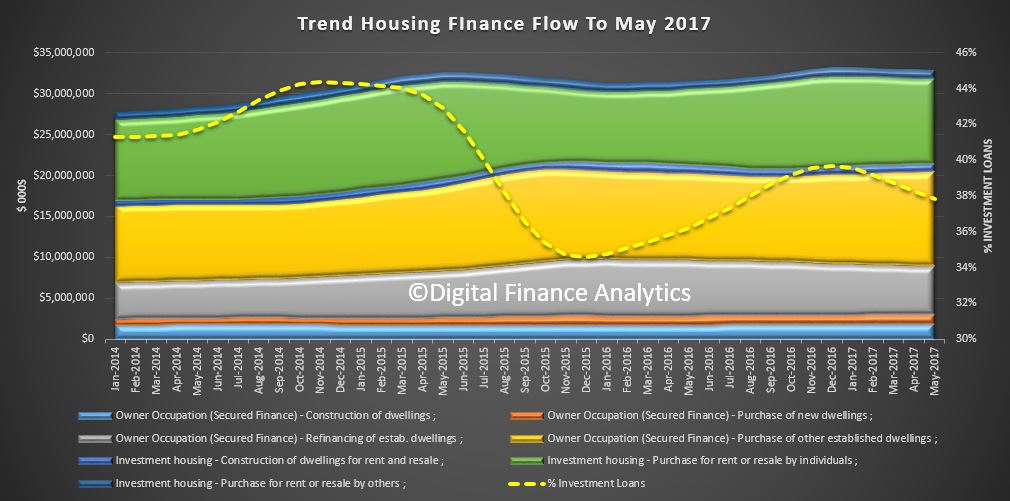
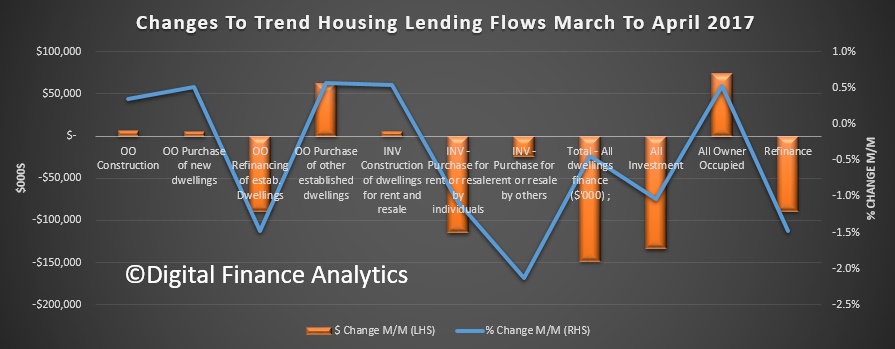
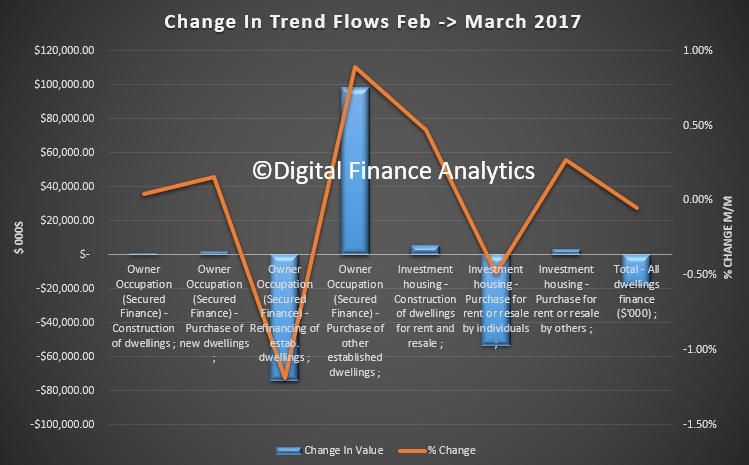
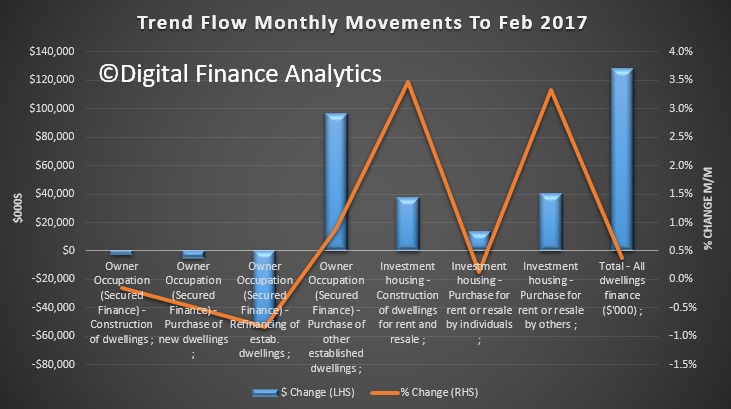
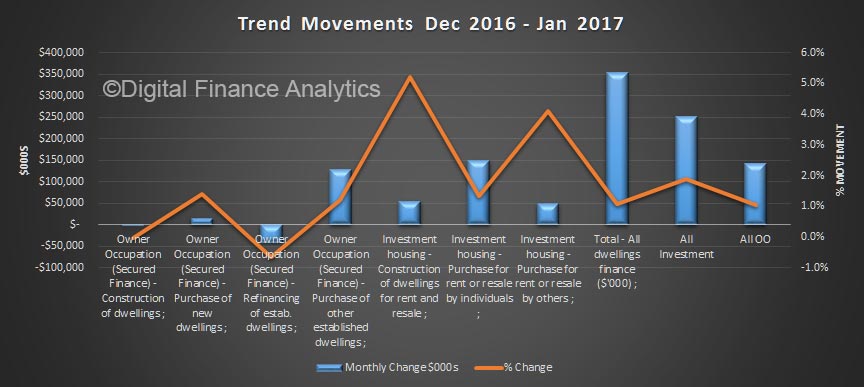
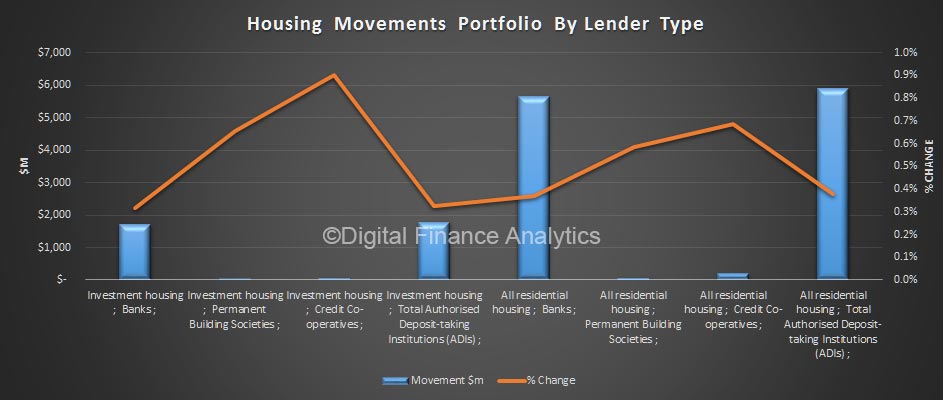
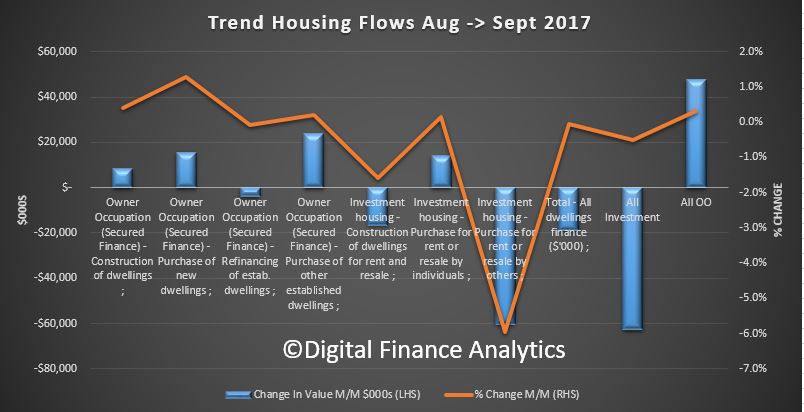
Looking in more detail at the ABS trend categories, OO lending flows for construction of new dwellings rose 0.4%, by $8.3 million to $2 billion, purchase of new dwellings rose $15 million or 1.29% to $1.2 billion; and purchase of OO existing dwellings rose 0.2% or $23 million to $11.8 billion. Investment new construction fell 1.57% or $16.5 million to $1.0 billion, purchase of housing by individuals for investment rose 0.14% or $13.9 million to $10.1 billion and investment property by other borrowers fell 5.9% down $60m to $950 million.

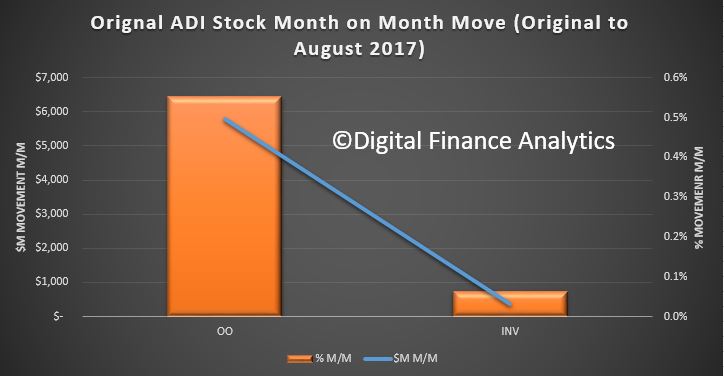
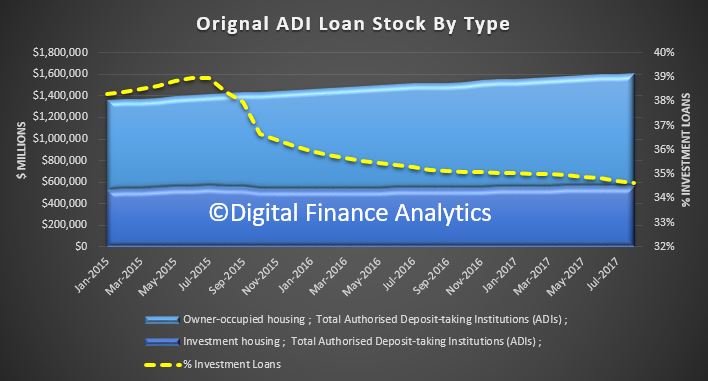
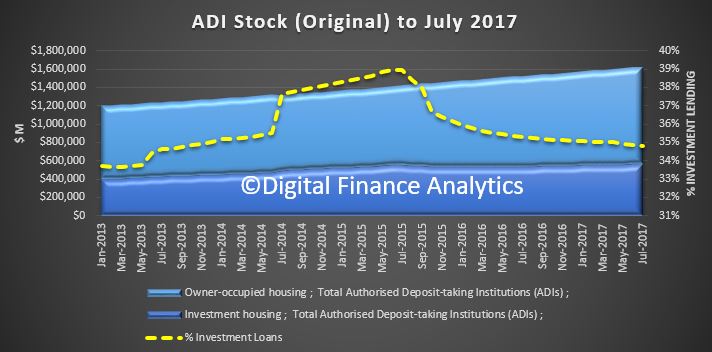
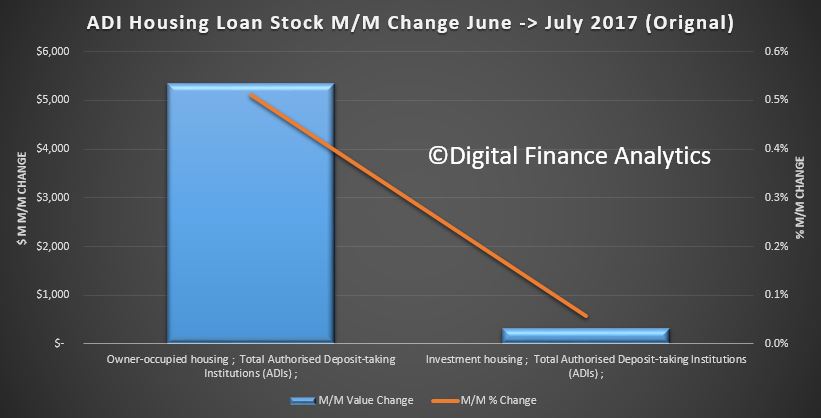
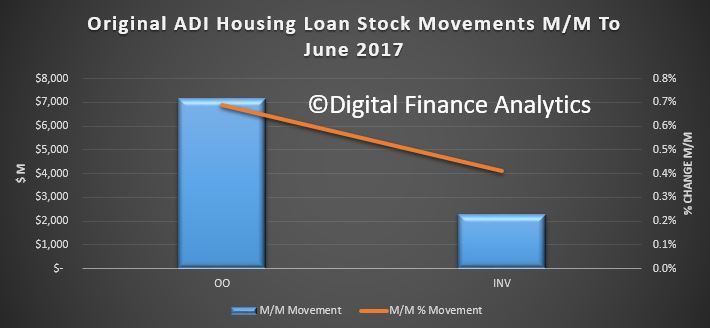
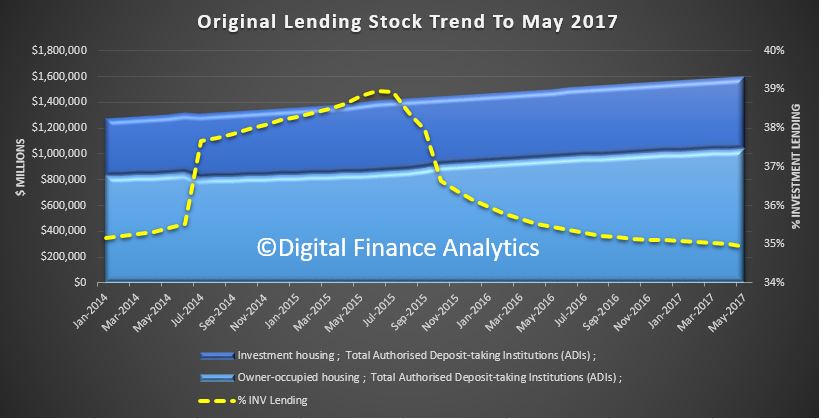
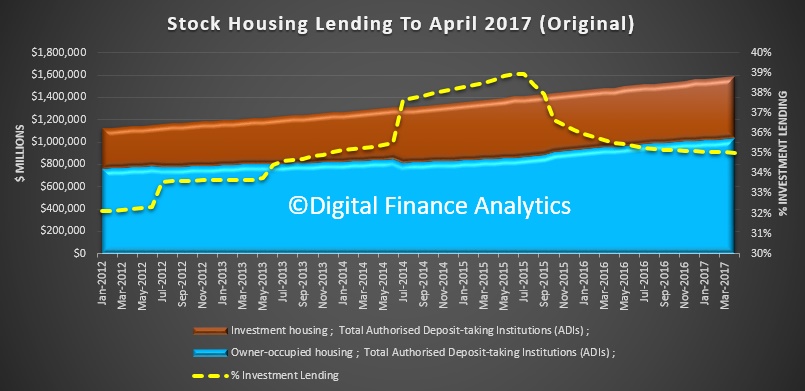
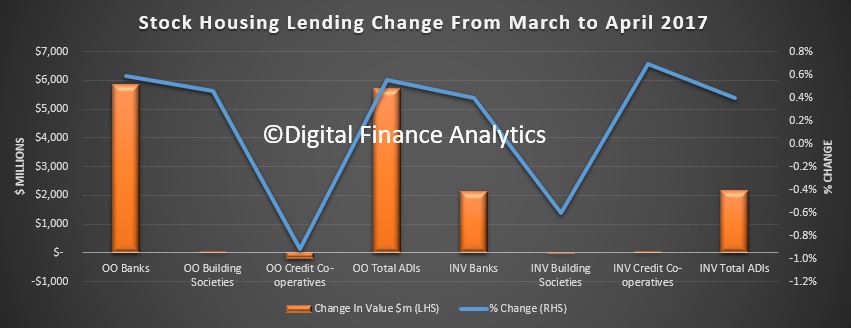
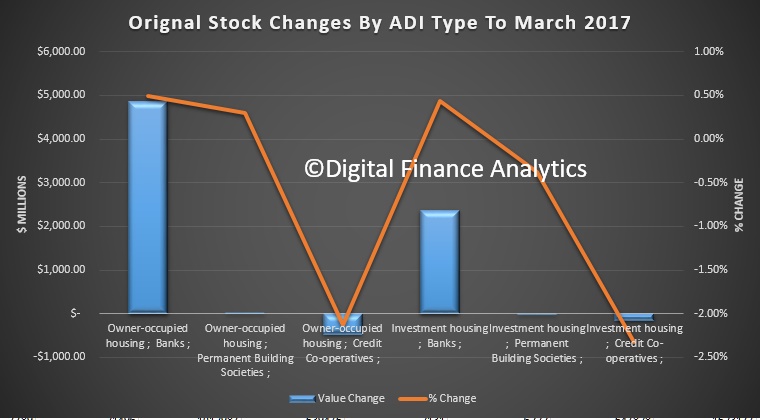
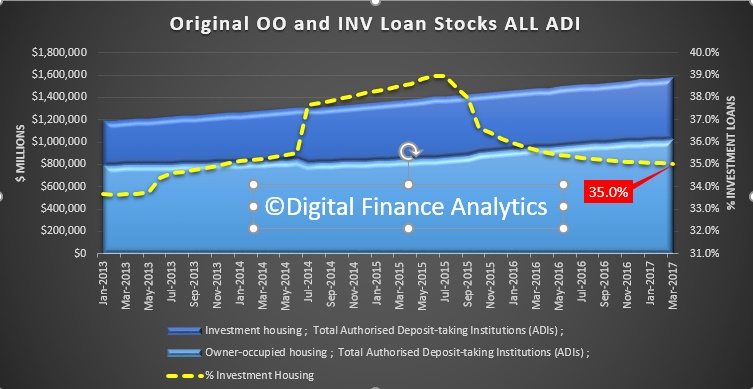
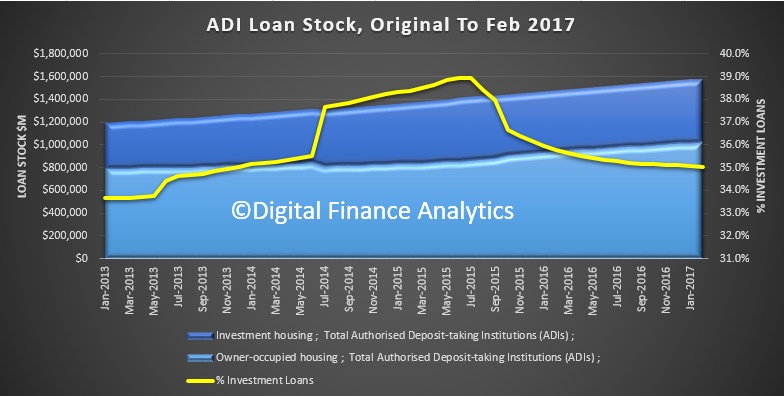
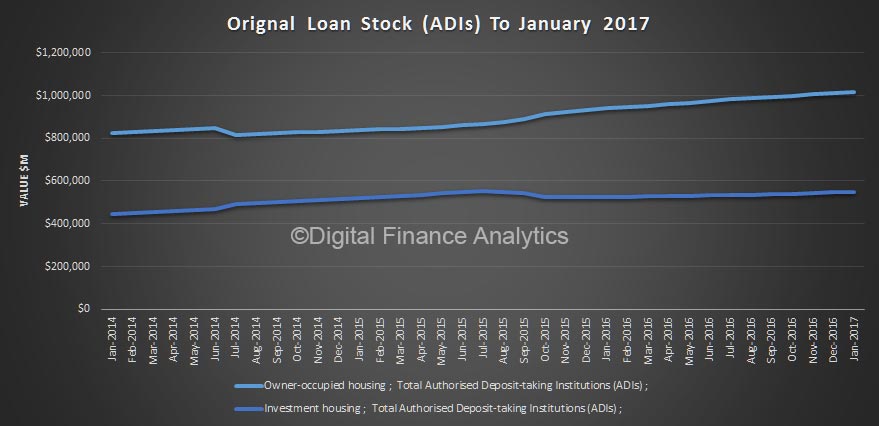
Finally, the original housing stock data shows that total ADI lending for housing rose 0.32%, or $5 billion to $1.57 trillion. Within that owner occupied stock rose rose 0.35% or $3.7 billion to $1.05 trillion and investment property lending rose 0.17% of 0.9 billion to $558 billion.

First Time Buyers Lead Housing Finance Higher In August

Data from the ABS today on housing finance reconfirms what we already knew, overall lending flows for housing from the ADI’s rose 0.6% in trend terms or 2.1% seasonally adjusted. Within that, lending for owner occupied housing rose 0.9%, or 2.1% seasonally adjusted and investor loans rose 0.2% in trend terms, or a massive 4.3% in seasonally adjusted terms. So lending growth is apparent, and signals more household debt ahead.

First time buyers continue to extend their reach, despite we seeing “Peak Price” for property at the moment. In original terms, the number of first home buyer commitments as a percentage of total owner occupied housing finance commitments rose to 17.2% in August 2017 from 16.6% in July 2017. But these numbers may be wobbly, as the ABS warns:

The number of loans to first home buyers increased strongly in August. The ratio of the number of first home buyer loans to the total number of owner occupier loans also increased strongly. The increase has been driven mainly by changes to first home buyer incentives made in July by the New South Wales and Victorian governments. The ABS is working with financial institutions to establish the size of the increase in first home buyer lending in recent months. These numbers may be revised and users should take care when interpreting recent ABS first home buyer statistics. The ABS is continuing to work with APRA and the financial institutions to improve the quality of first home buyer statistics.

The number of investor first time buyers fell a little according to our surveys, but overall there are more active, thanks to the recent owner occupier incentives.

The overall lending flows, in trend terms revealed a rise in all categories, other than lending for new construction to investors, which fell just a little. Also refinanced loans only grew a little and continues to slide as a proportion of all loans. No real surprise as rates are rising now. The mix of loans also continues to pivot away from investment property, down to 44.8% of all loans (ex. refinance). Still a high number though.

Here are the month on month movements by category.

Looking at the original stock data, another $6.5 billion was added to the owner occupied category or 0.6%, while investor loans rose just 0.1% in the month.

The portfolio mix of investment loans drifted lower overall, down to 34.6% or $550 billion, while the total value of owner occupied loans stood at $1.1 trillion.

There’s No Stopping The Housing Train

The latest data from the ABS, Housing Finance to July 2017, confirms what we knew. Owner occupied purchases are steaming ahead, while investment lending is stagnating. A clear reflection of the tightening in investor lending regulation, and the availability of new incentives and grants for first time buyers, alongside the attractor loan rates for new borrowers.

We saw first time buyers more active in NSW and VIC, two states where new concessions started in July.

A small but important rise, which is still well below the pre-GFC peak of 30%.

Importantly, owner occupied lending is still rising stronger than inflation or incomes, so the burden of household debt is set to rise further. Some revisions to earlier months data were made, and the RBA already highlighted that $1.4 billion of loans were reclassified between investment and owner occupied loans in the month.

In July, the trend lending flows were $33 billion, up 0.1%, with owner occupied lending up $20.8 billion or 0.7%, and Investment lending down 1% to $12.1 billion.  The number of owner occupied transaction rose 0.6%, construction of dwellings rose 2%, new dwellings, 2% and the purchase of established dwellings 0.3%.

The owner occupied lending trends highlight the rise in loans for construction and new building, as well as a rise in refinanced loans.

In original terms, the number of first home buyer commitments as a percentage of total owner occupied housing finance commitments rose to 16.6% in July 2017 from 14.9% in June 2017. The absolute number of loans also rose.

The number of first time buyer investors fell (using data from our surveys) showing a clear movement towards owner occupied first time buyer purchase.

The number, and proportion of first time buyers rose, and there was a rise in the proportion of loans on a fixed rate, reflecting attractive offers, and concerns about future rate rises.

As a result, in original terms, the total pool of loan stock rose more than $6 billion in the month,  to another record of $1.61 trillion.

  The bulk of the rise was in the owner occupied sector.

So the good news for banks is their loan portfolios are still growing, and their margins are now quite healthy. The longer term social impact of households saddled with massive debt will work out over a generation, but it highlights how exposed the nation is to any potential rise in interest rates.


June Home Lending Says Property Has Further To Run

The latest data from the ABS shows home lending finance in June 2017 remained robust. In fact, overlaid with the latest home price data, and auction clearance rates, it looks like the property market has further to run, at least in the main markets of Sydney, Melbourne and Canberra. Loans for construction were up.

Or in other words, household debts will continue to climb, despite the “risk trimming” measures imposed by APRA.

Whilst the trend estimate for the total value of dwelling finance commitments excluding alterations and additions was flat, owner occupied housing commitments rose 0.5% while investment housing commitments fell 0.9%. However, in seasonally adjusted terms, the total value of dwelling finance commitments excluding alterations and additions rose 0.8%.

In original terms, the number of first home buyer commitments as a percentage of total owner occupied housing finance commitments rose to 15.0% in June 2017 from 14.0% in May 2017.

More first time buyers are entering the market now, reacting to the attractive rates selectively on offer.

Overlaying the first time buyer investors, which was also quite strong, we see momentum building.

In original terms, in the past month, owner occupied lending flows grew by $7 billion, whilst investment loans grew $2.1 billion.

Looking at the trend adjusted stock, the mix of loans remained about the same at 35.9%, and overall loans pools grew.

We see a rise in borrowing for both owner occupied and investment construction.

So here are the trend adjusted flows, with owner occupied loans on the rise, investment loans down a little, and refinanced loans also down.

Worth noting that if you remove refinancing though, investment loans are still 46% of new loan flows. This is hardly indicative of a cooling of the property market.

Finally, the ABS says that in trend terms, the number of commitments for owner occupied housing finance fell 0.2% in June 2017.

In trend terms, the number of commitments for the construction of dwellings rose 1.9% and the number of commitments for the purchase of new dwellings rose 1.3%, while the number of commitments for the purchase of established dwellings fell 0.5%.

Finance for new dwellings appear to be getting a second wind with all eight state and territories showing growth in owner occupier loans for new dwellings during the month.


First Time Buyers Up, Investors Down

The ABS released their Housing Finance data to May 2017 today. Overall, trend housing finance owner occupied housing commitments rose 0.4%, while investment housing commitments fell 1.5%. The trend estimate for the total value of dwelling finance commitments excluding alterations and additions fell 0.3%.

First, there was a rise in the number of first time buyers in May. The original data (no seasonal adjustments) is always volatile but the percentage rose a little to 14.0% from 13.8% in April 2017.

The month on month movements show a rise in the number of loans, up nearly 2,000 and also a rise in the number of refinanced loans.

Overlaying data from our surveys to capture investor first time buyers, we see the combined trend is rising. We expect a further kick in July when the new FTB incentives kick in.

Next we look at the owner occupied changes across the months. We see an inflection in refinanced loans, but still falling, whilst other categories of loans are relatively stable or falling slightly.

Next we look at flow by category. Owner occupied purchase of established dwellings rose the strongest, with the owner occupied construction and new purchases also up. The value of refinancing fell as did all categories of investor loans.  We can conclude the regulatory tightening and lower expectations of investors are having a cooling impact on the market. Hence all the repricing across the market we have seen in recent weeks.

Comparing the flows across new owner occupied and investment loans we see the value of the latter falling, whilst the former is up just a little.

Analysis of the more detailed splits shows the proportion of investor loans fell to below 38% and this falling trend is set to continue.  Owner occupied purchase of established dwellings rose. In trend terms, while the number of commitments for the construction of dwellings rose 1.0% and the number of commitments for the purchase of new dwellings rose 0.4%, the number of commitments for the purchase of established dwellings fell 0.6%.

Movements by lender type shows the bulk of lending is being done by the banks, although the mutuals showed a small rise.

Finally, the trend lending stock to May showed another rise, with the proportion of investor loans slipping to below 35%, the lowest since 2014.

So we can conclude that lending momentum is changing, there is clearly a focus on owner occupied refinance and first time buyers. But given the still firm auction clearance rates reported through June and July, it will be interesting to see just how weak the investment sector goes.


The Great Lending Rotation Is Upon Us

The bumper edition of ABS data today, just before the long weekend included both the housing finance data and the lending finance data for April. Investor lending is on the turn now, and first time buyers are also retreating. The question now is what will this do to house prices, and the debt burden many households are currently under?

We think this marks a significant point of rotation for the housing market. However, business lending is not accelerating, leaving a significant growth hole in the economy.

Looking at the housing lending, overall lending flows fell 0.4% in trend terms from March, to $32.8 billion. Within that owner occupied loans fell 0.1% to $19.9 billion and investment lending fell 1% to $12.6 billion.

Refinance loans fell significantly, and the proportion of loans for investment purposes also fell.

Looking at the number of commitments, overall this fell by 0.5% to 53,062, with the purchase of new dwellings down 0.7% to 44,443. Purchase of new dwellings was down 0.1% to 2,755 and the construction of dwellings was up 0.6% to 5,864.

Revisions to the data have changed the trends, with owner occupied loans stronger, and investment loans weaker.

Looking at the stock of loans, overall values were higher again.

Owner occupied loans net rose $5.7 billion, or 0.56%, whilst investment loans rose $2.1 billion or 0.39%. Both Building Societies and Credit Unions saw a net loss in portfolio value.

In original terms, the number of first home buyer commitments as a percentage of total owner occupied housing finance commitments rose to 13.9% in April 2017 from 13.5% in March 2017. The number of first home buyer commitments decreased by 17.5% to 6,547 in April from 7,939 in March; the number of non-first home buyer commitments also decreased.

There was a big fall in the number of first time buyer commitments, offsetting the rise in the previous month.

We continue to track momentum in investor first time buyers, another 4,000 joined the ranks this past month.

The ABS says that in this issue, revisions have been made to the original series as a result of improved reporting of survey and administrative data. These revisions have affected the following series:

  • Owner occupied housing for the month of March 2017.
  • Investment housing for the month of March 2017.
  • Housing loan outstandings to households for owner occupation series for the periods January 2017 to March 2017.


APRA Wriggles In Senate Probe On Housing Risk

From our friends at MacroBusiness, quoting Nathan Lynch, Asia-Pacific bureau chief, financial crime and risk, Thomson Reuters.  The video is essential viewing!

It was only the devoted, the desperate or the sleep deprived who remained in the chamber last night in Canberra when Wayne Byres, APRA chairman, buckled under a sustained line of questioning. For almost two-and-a-half hours the Senate Economics Legislation Committee had been firing questions like mortars at the country’s chief prudential regulator. By the end, Byres looked understandably fatigued.

Are Australian capital city house prices sustainable? Do they pose a systemic risk to the broader economy? Is APRA concerned that Australian households are vying with Switzerland to claim a gold medal in the global consumer-debt-to-GDP sweepstakes?

The recent data from the Bank for International Settlements is alarming, showing Australian households carrying an average of 123% debt-to-GDP.

In the measured language so well honed by prudential regulators, Byres said the risks in the Australian property market were among APRA’s highest priorities.

He said Australian housing had entered a high-risk phase due to a range of factors, including capital city house prices, household debt levels, record low interest rates and anaemic wages growth. APRA, ever vigilant, was taking action to intervene in the market to ensure that banks were not taking on excessive risks and exposing the broader economy to unnecessary systemic risks.

“The whole issue of housing and property is a big issue on our agenda. There’s a lot of discussion at APRA and a lot of discussion at the Council of Financial Regulators (with Treasury, the RBA and ASIC) about the risks. We’ve never hidden behind the fact that we are in an environment of heightened risk. Prices are high, household debt is high, interest rates are at historical lows, interest rates are low and competitive pressure is strong in the housing market. So everyone needs to be fairly careful about how they operate in this environment,” Byres said.

Nick Xenophon, the South Australian senator, wasn’t having any of it. With supportive grenade lobs from Greens senator Peter Whish-Wilson, he pressed Byres for a concrete answer to one simple question: at what point will housing debt levels trigger alarm bells at APRA?

“Do you consider that there is a point where at which the ratio of household debt to GDP becomes problematic in this country?” Xenophon asked. “Is it 200%?”

Earlier in the week John Fraser, Treasury secretary, had refused to provide a number.

“He’s a wise man,” quipped Byres, realising where this was heading.

The truth is, though few want to admit it, APRA’s alarm bells have been ringing for years. It would be an imprudent prudential regulator who suggested otherwise. The regulator’s responses simply haven’t worked.

More than two hours into the appearance Byres finally said it: alarm bells were ringing, albeit “softly”, over the accumulation of risks in the banking system.

“I’d say they’re [alarm bells] going off softly. That’s why we’ve been intervening in the sense that …” Byres said, before being cut off by questions from a feverish chamber.

It was the committee’s gotcha moment. And it went largely unnoticed.

Macroprudential mayhem

In recent years APRA has taken a number of tentative steps, jokingly referred to in the industry as “macroprudential lite”, to constrain the irrational exuberance in the property market. It’s imposed higher interest rate buffers for loan serviceability assessments, set benchmarks for year-on-year growth in investor lending and most recently took steps to constrain interest-only investor loans.

The regulator has been hamstrung, however, as these measures apply on a nationwide basis and APRA is reluctant to cripple lending in resources-linked markets such as Perth and Darwin. Behind the scenes it’s also worried about driving borrowers into the shadow banking sector, which takes lending activity outside APRA’s regulatory remit.

Despite these challenges, the message from the handful of bellicose senators last night was clear: something needs to be done about housing market risks and APRA needs to be a core part of the solution.

Some of the tools that need to be considered are hard macroprudential caps (the type the major Australian banks have been operating under in New Zealand) and lending controls targeted at specific geographical areas. APRA already has powers to impose the former and, in the wake of the latest Budget, it will soon have explicit powers to do the latter.

The politically unpalatable subtext to this discussion is that, if there is a “property calamity” in Australia, taxpayers are ultimately on the hook for these long-term regulatory shortcomings.

Housing Finance On The Slide

Latest data from the ABS for March 2017 shows that the trend estimate for the total value of dwelling finance commitments excluding alterations and additions was $33.4 billion, down 0.1%. Owner occupied housing commitments was $20.1 billion up 0.1% while investment housing commitments was $13.2 billion down 0.3%.

Within the mix, owner occupied refinance flows fell 1.1% and investment finance by individuals fell 0.5%.  In trend terms, the number of commitments for the construction of dwellings rose 0.4% and the number of commitments for the purchase of new dwellings rose 0.2%. The number of commitments for the purchase of established dwellings fell 0.1%.

Investment housing lending comprised 40% of monthly flows, refinance 18.4% (and still trending down) whilst funding for new construction continued at about 8.7%.

Total ADI loan stock grew by 0.4%, with owner occupied loans growing just a little faster than investment loans.

Investment loans comprise 35% of the total book.

The number of owner occupied first time buyers rose in March by 20.5% to 7946 in original terms, a rise of 1,350.  In original terms, the number of first home buyer commitments as a percentage of total owner occupied housing finance commitments rose to 13.6% in March 2017 from 13.3% in February 2017.

The DFA surveys saw a small rise in first time buyers going to the investment sector as their first property purchase. Total first time buyers were up 12.3% to 12,756, still well below their peak from 2011 when they comprised more than 30% of transactions.

Note the ABS has revised the data series:

In this issue, revisions have been made to the original series as a result of improved reporting of survey and administrative data. These revisions have affected the following series:

  • Owner-occupied finance from May 2012 to February 2017.
  • Investment housing finance from July 2013 to February 2017.
  • Housing loan outstandings to households for owner occupation series for the periods May 2016 to January 2017.

The number and value of commitments for the purchase of newly erected dwellings have been revised for the period May 2012 to June 2013, and consequentially the number and value of commitments for the purchase of established dwellings have been revised for the same period.


Housing Finance Still Growing

The latest data from the ABS on Housing Finance to February 2017 shows that overall finance continued to grow.

The trend estimate for the total value of dwelling finance commitments excluding alterations and additions rose 0.4%. Investment housing commitments rose 0.7% and owner occupied housing commitments rose 0.2%. [DFA NOTE: They include owner occupied refinance in these numbers]

In seasonally adjusted terms, the total value of dwelling finance commitments excluding alterations and additions fell 2.7%.

But within the moving parts there are interesting observations – as usual we will focus on the trend series, which irons out some of the statistical bumps, though others will rush to comment on the 13% fall in investor loan flows from the previous month.

But looking first at ADI loan stock, overall balances rose 0.44% in the month to $1.57 trillion. Investor loans comprise 35% of the total, just down a little, in original terms.

Turning to the trend lending flows, total flows grew by 0.38% compared with the previous month, up $128 million. Within that, refinance fell to 18.7% of flows, down 0.83% or $50 million, owner occupied loans rose 0.65%, up $89 million and investment loans rose 0.69% or $91 million.

The main rise in the owner occupied sector was the purchase of established dwellings, whilst funding for new purchases and construction both fell a little. All categories of investor lending rose.

The HIA highlights that

the number of loans to owner occupiers constructing or purchasing new homes during February 2017 rose in just two states – South Australia (+6.5 per cent) and Queensland (+3.7 per cent). Compared with a year earlier, the largest reduction in lending volumes affected the Northern Territory (-63.8 per cent), followed by the ACT (-23.4 per cent) and New South Wales (-9.7 per cent). There were also falls in Western Australia (-8.7 per cent), Victoria (-2.0 per cent) and Tasmania (-1.7 per cent).

Looking next a first time buyers, the number of transactions rose in the month, in original terms up 7.5% to 6,596, or 13.3% of all transactions, still below previous peaks and lower than last month.

Our surveys also identified another 4,600 first time buyers going direct to the investment sector, so overall volumes are higher than the official figures suggest.

Looking at the movements, month on month, the number of FTB rose, with an increase of 460 over the previous month. Fixed rate lending compared with all transactions was down.

Investors Boom, First Time Buyers Crash

The ABS released their Housing Finance data today, showing the flows of loans in January 2017. Those following the blog will not be surprised to see investor loans growing strongly, whilst first time buyers fell away. The trajectory has been so clear for several months now, and the regulator – APRA – has just not been effective in cooling things down.  Investor demand remains strong, based on our surveys. Half of loans were for investment purposes, net of refinance, and the total book grew 0.4%.

In January, $33.3 billion in home loans were written up 1.1%, of which $6.4 billion were refinancing of existing loans, $13.6 billion owner occupied loans and $13.5 billion investor loans, up 1.9%.  These are trend readings which iron out the worst of the monthly swings.

Looking at individual movements, momentum was strong, very strong across the investor categories, whilst the only category in owner occupied lending land was new dwellings.  Construction for investment purposes was up around 5% on the previous month.

Stripping out refinance, half of new lending was for investment purposes.

First time buyers fell 20% in the month, whilst using the DFA surveys, we detected a further rise in first time buyers going to the investment sector, up 5% in the month.

Total first time buyer activity fell, highlighting the affordability issues.

In original terms, total loan stock was higher, up 0.4% to $1.54 trillion.

Looking at the movements across lender types, we see a bigger upswing from credit unions and building societies, compared with the banks, across both owner occupied and investment loans. Perhaps as banks tighten their lending criteria, some borrowers are going to smaller lenders, as well as non-banks.

We think APRA should immediately impose a lower speed limit on investor loans but also apply other macro-prudential measures.  At very least they should be imposing a counter-cyclical buffer charge on investment lending, relative to owner occupied loans, as the relative risks are significantly higher in a down turn.

The budget has to address investment housing with a focus on trimming capital gain and negative gearing perks.  The current settings will drive household debt and home prices significantly higher again.