Australia’s Proposal to Allow Local Mutuals to Issue Common Equity Tier 1 Capital Is Credit Positive

From Moody’s.

The Australian Prudential Regulation Authority (APRA) announced a proposal to amend the existing mutual equity interest (MEI) framework to allow Australian mutually owned deposit-taking institutions (ADIs) to directly issue common equity Tier 1 (CET1) eligible capital instruments. The current framework only creates CET1-equivalent capital, so-called MEIs, through the conversion of Additional Tier 1 (AT1) and Tier 2 capital instruments at the ADI’s point of non-viability. The amendment is credit positive because it would provide an additional option for mutuals to support balance sheet growth by raising high-quality capital. Australia’s mutuals have relied on retained earnings as their sole CET1 source because their mutual corporate status by definition has not allowed them to raise common equity.

APRA’s proposed amendment would allow mutuals to raise capital outside of extreme circumstances. The amendment also would provide a more efficient capital channel for mutuals to respond to growth opportunities. Mutuals thus far have relied on retained earnings accumulation as their primary source of CET1 capital. We view the proposal as an important step in levelling the playing field between mutuals and listed Australian ADIs, the latter of which have the ability to raise common equity.

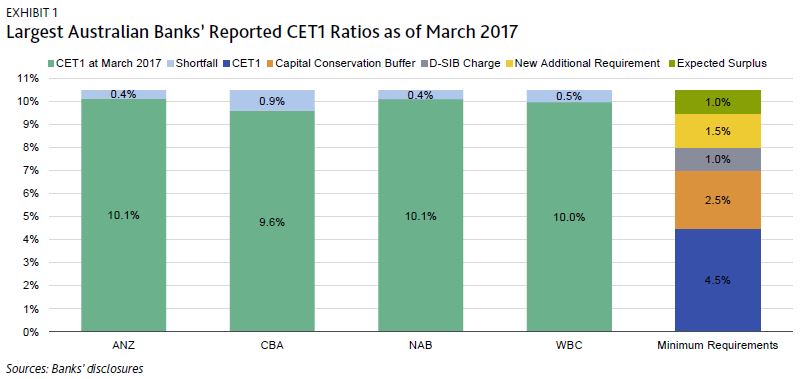
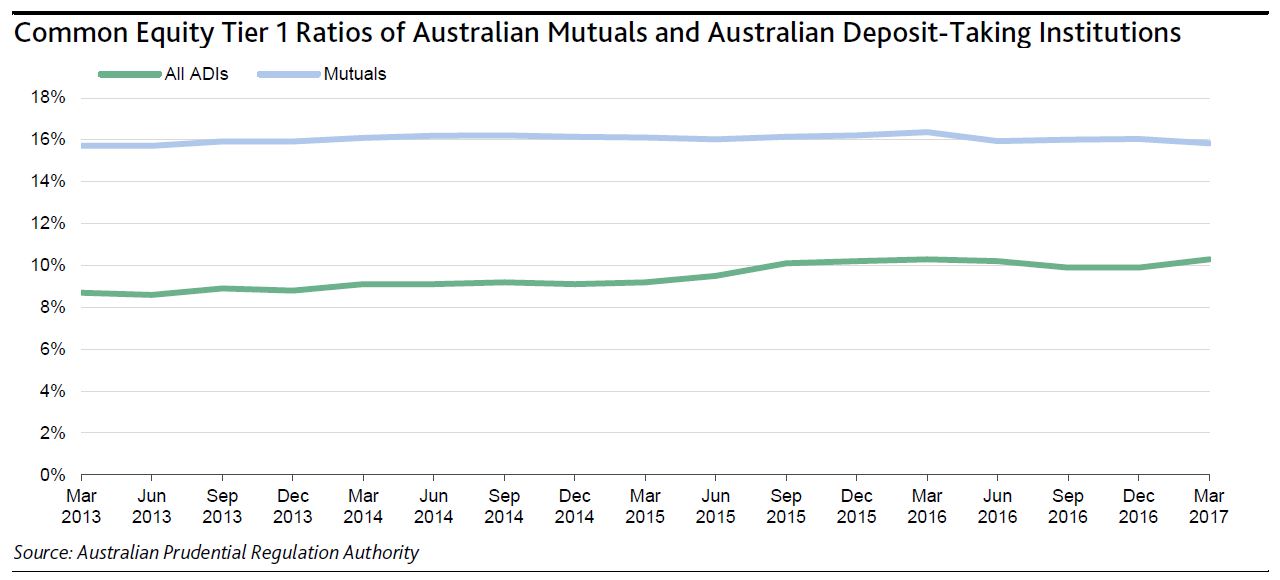
We do not expect the amendment, if enacted, to strongly increase common equity issuance to replace retained earnings as a dominant CET1 capital source because of mutuals’ already-strong capitalization and the limits that APRA will set on such instruments. Australia’s mutuals have no urgent need to boost their capital ratios. The exhibit below shows that mutuals have consistently reported higher average CET1 ratios than other ADIs. As of the end of March 2017, their aggregate CET1 ratio was 15.8%, versus 10.3% for all ADIs.

Under the current MEI framework, which has been in place since 2014, Moody’s-rated mutuals have 2% of their total capital as AT1 and Tier 2 instruments. (Moody’s-rated mutuals make up approximately 50% of the mutual sector’s total assets.)

The regulator also limits mutuals’ ability to rely on MEI-created CET1 (either through conversion of AT1 and Tier 2 instruments or direct issuance). Specifically, APRA has proposed a 15% cap on the inclusion of MEIs in CET1 capital, and distribution of profits to MEI investors at 50% of ADIs’ net profit after tax on an annual basis.

We expect that MEIs will continue to account for only a minor share of mutuals’ capital, which alleviates the risk that the APRA proposal will incentivize mutuals to maximize their profitability to meet MEI investors’ dividend payment expectations. This scenario would conflict with mutual ADIs’ traditional business model that de-emphasizes profit maximization, and instead focuses on providing value to members via cheaper loans and higher-yielding deposits.

Australian Banks’ Stricter Capital Requirements Are Credit Positive – Moody’s

From Moody’s

On 19 July, the Australian Prudential Regulation Authority (APRA) announced that it will raise the minimum common equity Tier 1 (CET1) ratio for banks. The stricter capital requirements will make the banking system more resilient to any weakening of credit conditions, a credit positive.

Australia’s four biggest banks, the Australia and New Zealand Banking Group Ltd. (Aa3/Aa3 stable, a22), Commonwealth Bank of Australia (Aa3/Aa3 stable, a2), National Australia Bank Limited (Aa3/Aa3 stable, a2), and Westpac Banking Corporation (Aa3/Aa3 stable, a2), which use internal ratings based models for calculating risk-weighted assets, will be most affected. APRA increased the four banks’ minimum CET1 ratio 150 basis points to 9.5%, including a 1% charge for domestic systemically important banks (D-SIBs). Although the higher capital requirements will take effect in early 2021, APRA said that it expects banks to exceed the new requirement and have CET1 ratios of 10.5% by 1 January 2020 at the latest.

The minimum CET1 ratio for Macquarie Bank Limited (A2 stable, baa1), which also uses an internal ratings-based approach but is not a D-SIB, was similarly raised 150 basis points to 8.5%, effective 1 January 2020. For all the other banks, which use standardized models, the minimum CET1 ratio is 7.5%, a 50 basis point increase.

The new minimum CET1 ratio is an incremental increase from the banks’ current capital levels. The APRA has for some time indicated that it would tighten capital rules, and our Australian bank ratings fully reflect that possibility. To meet a CET1 target of 10.5%, the four big banks will need to raise their CET1 ratios between 40 and 90 basis points from their reported levels at March 2017 (see Exhibit 1). That translates into an aggregate capital shortfall of about AUD9.1 billion. However, the banks’ normalized annual internal capital generation is already around AUD6.5-AUD7.5 billion after dividend payments and dividend reinvestments. Also, in practice, they may need less additional capital because they have been actively reducing their risk-weighted assets by changing their business mixes.

Macquarie Bank’s CET1 ratio was 11.1% as of March 2017, well above its new 8.5% minimum. Smaller banks subject to a 7.5% minimum also mostly have CET1 ratios exceeding the requirement, so any capital shortage for them will be minimal.

The tighter capital requirement reflects the APRA’s concern about Australian banks’ reliance on foreign wholesale funding, which makes them vulnerable to sudden shifts in foreign investor sentiment. Australian banks issue around 70% of their long-term debt and 40% of their short-term debt to foreign investors (see Exhibit 2).
 The APRA has also flagged further increases in capital requirements in 2021. The regulator plans to increase the risk weights of certain assets, particularly for investor property loans and higher loan-to-value ratio loans. Although loss rates on mortgages remain low, housing loans make up 60% of Australian banks’ loan portfolios. Furthermore, a high and rising level of household debt has elevated risks within the household sector, making Australian banks’ credit quality more vulnerable to a shock. APRA also stated that its assessment of bank capital assumes that a framework for total loss-absorbing capacity will be introduced at a later date.

Record US Ratio of Debt to GDP Contains Growth and Interest Rates

From Moody’s.

The leverage of the US nonfinancial sector has reached unprecedented heights according to the US’s never before seen ratio of nonfinancial-sector debt to GDP. Nonfinancial-sector debt includes the credit obligations of households, nonfinancial businesses, state and local governments, and the US government. Though the ratio of US nonfinancial-sector debt to GDP’s moving yearlong average dipped slightly from Q4-2016’s record 255% to Q1-2017’s 253%, the latter was considerably higher than year-end 2007’s 230% that immediately preceded the Great Recession. (Figure 1.)

However, the burden of debt repayment may have been greater during yearlong 2007 for several reasons. The first centers on the much higher interest rates of yearlong 2007 compared to mid-2017. For example, 2007 showed much higher annual averages of 4.63% for the 10-year Treasury yield (versus a now 2.27%), 5.00% for fed funds (versus a recent 1.125%), 6.34% for the 30-year mortgage yield (versus today’s 3.90%), 5.80% for the investment-grade corporate bond yield (versus a current 3.15%) and 8.28% for the composite speculative-grade bond yield (compared to a now 5.72%).

Note also that 2007’s borrowing costs were rendered more onerous by how the 5.00% fed funds topped the accompanying 4.63% 10-year Treasury yield. Time and again, inverted yield curves have correctly warned of approaching turmoil for corporate credit and overall business activity.

Moreover, because private-sector debt has been more susceptible to default than public-sector debt, year-end 2007’s debt burden may have been skewed higher by private-sector debt’s near record 168% share of GDP, compared to Q1-2017’s 152%. Thus, we find that the jump by the ratio of public-sector debt from 2007’s 62% to Q1-2017’s 101% of GDP largely explains why total nonfinancial-sector debt advanced from 2007’s 230% to the latest 253% of GDP. (Figure 2.)

Massive debt limits upside for interest rates

In general, the higher is the ratio of total nonfinancial-sector debt to GDP, the more burdensome will higher borrowing costs be to business activity. This is but another reason not to expect a full “normalization” of interest rates during the next 10 years.

The slower growth of the US nonfinancial-sector debt has helped to rein in interest rates. The outstanding nonfinancial-sector debt of the US private and public sectors totaled $47.495 trillion as of 2017’s first quarter and was up by 3.7% from a year earlier. The annual increase was slower than the 4.5% of Q4-2016 and the 5.0% of Q1-2016. During the five-years-ended March 2017, nonfinancial sector debt grew by 4.1% annually, on average, which was much slower than the metric’s 9.1% average annual advance of the five-years-ended 2007, or the final five years of the previous economic recovery.

US government replaces household-sector as the US’s biggest debtor

The US government is now the largest debtor of the US nonfinancial sector. First-quarter 2017’s $15.898 trillion of outstanding US government debt more than doubles the $6.074 trillion of federal debt as of year-end 2007. The 11.0% average annualized surge by US government debt since 2007 raced past the accompanying 2.8% average annual rise by nominal GDP. Lately, federal debt has slowed considerably. First-quarter 2017’s 3.2% yearly increase by federal debt was slower than the category’s 5.7% average annualized increase of the five-years-ended March 2017.

The distribution of US nonfinancial-sector debt was far different at the end of 2007. Back then, household sector’s $14.170 trillion of debt led all categories and was 133% greater than the roughly $6 trillion of US government debt. Since year-end 2007, household sector debt barely grew by 0.5% annualized, on average, to $14.801 trillion, where the latter now trails the nearly $16 trillion of federal debt by -6.9%. (Figure 3.)

Household debt slows, but remains elevated relative to income

Over time, household financial flexibility has been diminished by a rising ratio of household debt to GDP. Household debt has gone from averaging 72% of disposable personal income during the Reagan years to 105% as of the year-ended March 2017. But, at least household debt is down from 2007’s record 135% of disposable personal income.

First-quarter 2017’s $14.801 trillion of outstanding household debt rose by 3.4% yearly, which was above the 2.1% average annual increase of the last five years. In a stark and an ultimately destabilizing contrast, household debt advanced by an unsustainable 10.6% annualized during the five-years-ended 2007.


US Banks Pass Federal Reserve’s Stress Test

From Moody’s

Last Thursday, the US Federal Reserve published the results of the 2017 Dodd-Frank Act stress test (DFAST) for 34 of the largest US bank holding companies (BHCs), all of which exceeded the 4.5% minimum required common equity Tier 1 (CET1) capital ratio under the Fed’s severely adverse stress scenario, a credit positive.

This is the third consecutive year that all tested BHCs exceeded the Fed’s minimum requirement, and the median margin above the minimum also increased. However, for the first time, this year’s test incorporated the supplementary leverage ratio (SLR) for advanced-approach banks, which was more constraining for some of the banks.

DFAST considers how well banks withstand a severely adverse economic scenario, which is characterized as a severe global recession. The 2017 test scenario used modestly more favorable interest rates than in 2016 with a greater increase in rates and no negative short-term rates. The test incorporated a 6.5% peak-to-trough decline in US real gross domestic product, an increase in the unemployment rate to 10%, a 50% decline in equity prices through year-end 2017, and a 25% drop in home prices and a 35% decline in commercial real estate prices by 2019.

All 34 BHCs were subjected to this scenario, including new participant CIT Group Inc. In addition, the stress tests for eight of the 34 BHCs with substantial trading or processing operations were required to incorporate the sudden default of their largest loss-generating counterparty. The eight BHCs subject to the counterparty default component were Bank of America Corporation, The Bank of New York Mellon Corporation, Citigroup Inc., The Goldman Sachs Group, JPMorgan Chase & Co. Morgan Stanley, State Street Corporation, and Wells Fargo & Company. Finally, six of these eight BHCs with significant trading operations were also required to include a global market shock (Bank of New York Mellon Corporation and State Street Corporation were excluded from this global market shock scenario.)

On 28 June, the Fed will release the results of the Comprehensive Capital Analysis and Review (CCAR), which evaluates the BHCs’ capital plans, including dividends and stock repurchases, incorporating their DFAST results. The capital-planning processes of the large complex banks will also be publicly evaluated. Prior to the CCAR release, BHCs can reduce their planned capital distributions, commonly known as taking a “mulligan.” Our analysis of pre-provision net revenue declines and loan losses under the severely adverse scenario highlights still significant tail risks for DFAST participants. Nonetheless, we expect banks’ capital distribution requests to be more aggressive than in prior years, which will limit or negate improvement in their capital ratios.

ALL BANKS EXCEED MINIMUM REQUIRED CAPITAL IN THE SEVERELY ADVERSE SCENARIO

Exhibit 1 compares the minimum CET1 ratios of 34 participating BHCs under the Fed’s severely adverse scenario with their actual CET1 ratios reported at year-end 2016. The exhibit segments the BHCs into two groups: the 26 BHCs subject only to the severely adverse economic scenario (on the right), and the eight BHCs also subject to the additional global market shock and counterparty default components noted above (on the left). The minimum CET1 ratios of the eight large BHCs are all comfortably above the Fed’s 4.5% requirement despite being subjected to the additional stress components. The other 26 BHCs are also above the 4.5% requirement, although for many the margin is smaller than for the largest BHCs. The lowest minimum ratios were for Ally Financial Inc. at 6.6%, up from 6.1% in the 2016 test; and KeyCorp at 6.8%, up from 6.4% in 2016.

Even though all of the BHCs passed the 4.5% minimum threshold, many would still take sizeable capital hits under the Fed’s severely adverse scenario (Exhibit 2). The estimated declines in the BHCs’ CET1 ratios range from a high of 840 basis points (bp) for Morgan Stanley to a low of 210 bp for Santander Holdings USA, Inc.. Positively, the median of the 34 banks was narrower at 280 bp compared with 350 bp last year, indicating greater overall resilience to an economic shock. In its report, the Fed partly attributed this to lower losses from changes in the banks’ portfolio composition and risk characteristics.

SUPPLEMENTARY LEVERAGE RATIO IS A GREATER CONSTRAINT FOR SOME BANKS

The BHCs’ generally good results for stressed CET1 ratios in DFAST suggests that increased capital distributions are likely for the vast majority of institutions. However, CET1 is not the most constraining ratio for all banks. In particular, this year’s test for the first time incorporated the supplementary leverage ratio (SLR) for the advanced approach banks (Exhibit 3). Because the denominator of the SLR comprises average assets and off-balance sheet exposures, it tends to be much larger than the risk-weighted asset denominator of CET1, with the result that the banks’ margin above the 3% minimum SLR is smaller. Morgan Stanley had the lowest minimum SLR of 3.8%, which is likely to constrain its efforts to return more capital to shareholders. State Street and Goldman Sachs also had comparatively low minimum SLRs.

Moody’s Cuts Aussie Bank Ratings Due To “Tail Risk” Concerns

From Zero Hedge.

Back in 2007, the ratings agencies were so woefully behind the eight ball in understanding and reporting the credit risks in the U.S. financial system that it was nearly impossible to tell from day to day whether they were really just that incompetent or if they were complicit in the biggest financial fraud in history.  Regardless of which you believe is more likely, they seem intent upon not making the same mistake again…at least not in Australia.

As The Sydney Morning Herald points out today, Moody’s has cut the long-term credit rating of Australia’s four biggest banks after pointing to surging home prices, rising household debt and sluggish wage growth as potential threats to the financial industry down under.  Australia & New Zealand Banking Group Ltd., Commonwealth Bank of Australia, National Australia Bank Ltd. and Westpac Banking Corp. were all downgraded to Aa3 from Aa2, Moody’s said in a statement released earlier today. Per The Sydney Morning Herald

“In Moody’s view, elevated risks within the household sector heighten the sensitivity of Australian banks’ credit profiles to an adverse shock, notwithstanding improvements in their capital and liquidity in recent years,” the statement said.

“In Moody’s assessment, risks associated with the housing market have risen sharply in recent years. Latent risks in the housing market have been rising in recent years, because significant house price appreciation in the core housing markets of Sydney and Melbourne has led to very high and rising household indebtedness,” the statement said.

“The rise in household indebtedness comes against the backdrop of low wage growth and structural changes in the labour market, which have led to rising levels of underemployment”.

“Whilst mortgage affordability for most borrowers remains good at current interest rates, the reduction in the savings rate, the rise in household leverage and the rising prevalence of interest-only and investment loans are all indicators of rising risks.”

Of course, as we’ve pointed out multiple times before, the Chinese money laundering operation…sorry, we meant Sydney “housing market”…puts the previous U.S. housing bubble to shame.

Of course, all of the banks that are now being downgraded are the same ones that assured us just a couple of months ago that Australian home prices were not in a “speculative bubble.” Testifying before a parliamentary committee, the chief executives of National Australia Bank, Westpac Banking and Commonwealth Bank of Australia all said that while they were worried about elements of the housing market, prices weren’t over-inflated.  Per Bloomberg

“I would draw the distinction between a speculative bubble in prices and prices beyond what fundamentals would justify,”Westpac’s Brian Hartzer told the committee in Canberra Wednesday. A bubble isn’t occurring in Sydney or Melbourne, where house prices have risen the most, he said.

“There are increasing risks, but I still believe the answer is no,” National Australia Bank’s Andrew Thorburn said when asked if houses in Sydney and Melbourne are overpriced.

Commonwealth Bank, the nation’s largest mortgage lender, is “lending at levels we are comfortable with” across Australia, Chief Executive Officer Ian Narev told the committee when he testified Tuesday.

Meanwhile, the ever-important “crane-index” helps to put some perspective around just how ‘bubbly’ the Australia market has become.

Australia

Of course, maybe Australia’s bankers are right and bubbly home prices are just the result of strong fundamentals.  Although, the last time a prominent banker made a similar prediction in the U.S. he turned out to be just a bit off the mark.  Ben Bernanke (July 2005):

“Well, unquestionably, housing prices are up quite a bit; I think it’s important to note that fundamentals are also very strong. We’ve got a growing economy, jobs, incomes. We’ve got very low mortgage rates. We’ve got demographics supporting housing growth. We’ve got restricted supply in some places. So it’s certainly understandable that prices would go up some. I don’t know whether prices are exactly where they should be, but I think it’s fair to say that much of what’s happened is supported by the strength of the economy.”

Oops!

12 Banks Downgraded

Elevated household debt is behind Moody’s downgrade of 12 Australian banks today.

In Moody’s view, elevated risks within the household sector heighten the sensitivity of Australian banks’ credit profiles to an adverse shock, notwithstanding improvements in their capital and liquidity in recent years.

In Moody’s assessment, risks associated with the housing market have risen sharply in recent years. Latent risks in the housing market have been rising in recent years, because significant house price appreciation in the core housing markets of Sydney and Melbourne has led to very high and rising household indebtedness”

These include ANZ, CBA NAB and Westpac as well as Bendigo and Adelaide Bank, Heritage Bank, ME Bank, Newcastle Permanent, QT Mutual, Teachers Mutual, Victoria Teachers Mutual; and Credit Union Australia.

The four majors had their longer-term ratings cut one notch from Aa3 to Aa2 and their baseline credit assumptions trimmed from A1 to a2.

Moody’s downgraded Bendigo and Adelaide bank’s long-term rating from A3 to to A2, but Bank of Queensland and Suncorp were unchanged at A3 and A1 respectively.

ANZ confirmed the downgrade, saying

“Along with the other major banks, ANZ’s senior unsecured credit rating has been lowered by one notch from Aa2 to Aa3. Following this action, Moody’s has also restored the ratings outlook for the four major Australian banks to Stable from Negative”.

There was no change to ANZ’s short term rating which remains at P1.

The full lists of revised ANZ ratings are:
• Senior debt: downgraded from Aa2 (Negative) to Aa3 (Stable)
• Subordinated debt: downgraded from A3 to Baa1
• Hybrid debt: downgraded from Baa1 to Baa2

The ratings are predicated on the assumption that Government support will be available if needed.

These are relatively minor changes which are unlikely to impact funding costs that much, but the trajectory and underlying rationale are much more significant.


US Fannie Mae to increase its debt-to-income (DTI) ceiling

From Moody’s

On 9 June, Fannie Mae announced that it would increase its debt-to-income (DTI) ceiling for mortgage borrowers to 50% from 45%, effective on 29 July. The increase is credit positive for US state housing finance agencies (HFAs) because it will make mortgage loans more attainable for first-time homebuyers, thereby supporting HFA loan originations, which have been driving HFAs’ profitability margin growth.

HFAs are charged with providing and increasing the supply of affordable housing in their respective states, specifically for first-time homebuyers. The DTI ratio is often the barrier to home ownership for first-time borrowers, so increasing the DTI ratio ceiling will increase mortgage approvals, thereby increasing the pool of borrowers who may opt for HFA loans.

Over the past five years, HFAs have more than tripled their single-family loan originations to $20.6 billion in 2016 from $6.5 billion in 2012. This has been one of the primary drivers of HFA profit margin growth, which reached an all-time high of 17% in fiscal 2015 (see exhibit).

One of the challenges that HFAs face is a shrinking supply of single-family affordable housing inventory, which hinders first-time homebuyers and hampers HFA loan originations. The increase in the DTI ratio limits will help offset these challenges by expanding the pool of borrowers eligible for mortgages as well as allowing some borrowers to buy somewhat more expensive homes. Additionally, we expect HFAs to continue to maintain their high level of originations, which will support their strong margins.

Although Fannie Mae’s increase in the DTI ratio will ease financial standards for potential first-time homebuyers by allowing applicants to carry additional debt, the HFAs will not bear the credit risk of these lower credit quality borrowers. Loans approved by Fannie Mae are either securitized or sold to Fannie Mae and loan payments are guaranteed by Fannie Mae regardless of the underlying performance of the mortgage.

EU’s 2018 Bank Stress Test Will Be Tougher, but Has Limitations

From Moody’s

Last Wednesday, the European Banking Authority (EBA) began the process  of stress testing Europe’s largest banks in an effort to assess their individual capital adequacy under stressed conditions. The publication of a draft stress test methodology coincided with the announcement of the resolution of Spain’s Banco Popular Espanol, a bank that fared relatively well in the 2016 stress test results published 10 months ago.

The draft stress test methodology and the timing of its publication convey two key messages for European Union (EU) banks andinvestors. First, the stress test for 2017-18 will be tougher, given that it will include the new accounting rule known as International Financial Reporting Standard (IFRS) No. 9, which requires that banks set aside provisions on all loans in advance of default. Second, notwithstanding EU supervisors’ efforts to harmonise rules and enhance stress testing, Banco Popular’s failure has revealed once more the principal limitations of stress testing in signalling potential failures, which has resulted in scepticism toward the exercise.

The 2018 stress test will once again look at the effect of macroeconomic stress on a bank’s viability, taking into account market risk and litigation risk. Additionally, the test will include simulations of risk charges under IFRS 9 of expected credit losses. IFRS 9 addresses the issue of loan-loss provisions being “too little and too late,” something regulators identified as a shortcoming that amplified the 2007-09 banking crisis. The accounting change will require banks to model credit risk losses for loans even before they have defaulted, and increase the level of provisions as they start to deteriorate.

Considering that banks must use IFRS 9 starting in January 2018, the inclusion of the new rule in the next stress test is not surprising. However, its potential effect on banks’ capital in the stress test is opaque given the difficulty in estimating stressed simulated risk provisions that must be based on a new accounting concept ahead of its implementation deadline. However, incremental risk provisioning under IFRS 9 will focus on loans that show deterioration in borrowers’ credit quality since inception of the loan. Therefore, we expect banks that are challenged by low growth and persistent asset quality pressures will be more affected. Although the stress test again will not involve a pass-or-fail decision benchmarked against a hurdle rate, the 2018 stress test is still likely to force some banks to hold more capital.

With the resolution of Banco Popular, whose subordinated creditors were bailed-in and their investment effectively wiped out, we expect that the EBA’s 2018 stress test again will single out weak candidates, but the results still may not reliably predict the next failure. Although the 2016 stress test formally identified Banco Popular as the weakest among the six participating Spanish banks, it was by no means among the most vulnerable candidate when taking into account a capital measure undertaken shortly after the year-end 2015 cut-off date for the test. The bank reported a relatively weak common equity Tier 1 ratio of 7.0% in the adverse scenario, but, adjusted for a €2.5 billion rights issue that had been concluded by the time the results were published, the bank’s result ranked second-best in the Spanish peer group, with a solid 10% pro forma result.

Tightening Is Toxic

From Moody’s.

The FOMC is expected to announce a 25 bp hike in the federal funds rate’s midpoint to 1.125% on Wednesday, June 14. Despite March 14’s 25 bp hiking of fed funds to a 0.875% midpoint, the 10-year Treasury yield fell from March 13’s 2.62% to a recent 2.20%. If the 10-year Treasury yield does not climb higher following June 14’s likely rate hike, the scope for future rate hikes should narrow.

At each of its end-of-quarter meetings, the FOMC updates its median projections for economic activity, inflation, and the federal funds rate. At the March 2017 meeting, the FOMC’s median projections for the year-end federal funds rate were 1.375% for 2017, 2.125% for 2018, and 3.0% for 2019 and beyond. However, the recent 10-year Treasury yield of 2.20% implicitly reflects doubts concerning whether the fed funds rate’s long-run equilibrium will be as high as 3.0%.

Perhaps, the FOMC will supply a lower long-run projection for fed funds. Nevertheless, in order to ward off speculative excess in the equity and corporate credit markets, the FOMC may wisely decide to overestimate the likely path of fed funds. The last thing the FOMC wants to do is help further inflate an already overvalued equity market.

Moreover, equity market overvaluation has pumped up systemic liquidity by enough to narrow high-yield bond spreads to widths that now under-compensate creditors for default risk. According to a multi-variable regression model that explains the high-yield bond spread in terms of (1) the VIX index, (2) the average EDF (expected default frequency) metric of non-investment grade companies, (3) the Chicago Fed’s national activity index, and (4) the three-month trend of nonfarm payrolls, the high-yield spread’s recent projected midpoint of 410 bp exceeds the actual spread of 380 bp. Moreover, after excluding the VIX index from the model, the predicted midpoint widens to 500 bp. The 90 bp jump by the predicted spread after excluding the VIX index is the biggest such difference for a sample that commences in 1996. The considerable downward bias imparted to the predicted high-yield spread by the recent ultra-low VIX of 10.2 points highlights the degree to which a richly priced and highly confident equity market has narrowed the high-yield bond spread. (Figure 1.)

High-yield spreads can narrow amid Fed rate hikes

There is absolutely nothing unusual about financial market conditions easing amid Fed rate hikes. When the fed funds’ midpoint was hiked from 0.125% to 0.375% in December 2015, the high-yield bond spread quickly swelled from a November 2015 average of 697 bp to February 2016’s 839 bp. However, though the midpoint is likely to reach 1.125% at the FOMC’s upcoming meeting of June 14, the high-yield spread has since narrowed to a recent 380 bp. (Figure 2.)

Early on, Fed rate hikes often were followed by thinner corporate bond yield spreads. For example at the start of the first tightening cycle of 1991-2000’s economic upturn, fed funds was hiked from year-end 1993’s 3.0% to 5.5% by year-end 1994. Despite that 2.5 percentage point hiking of fed funds, the high-yield bond spread managed to narrow from Q4-1993’s 439 bp to Q4-1994’s 350 bp. Not until the 10-year Treasury yield dipped under August 1998’s 5.5% fed funds rate did the high-yield spread widen beyond 600 bp.

It’s also worth recalling how the market value of US common stock soared higher by 19.4% annualized, on average, from January 1994 through March 2000 despite a hiking of fed funds from 3.00% to 5.75%. However, once fed funds reached 6.00% in March 2000, a grossly overvalued equity market finally crested and began a descent that would slash the market value of US common stock by a cumulative -43% from March 2000’s top to October 2002’s bottom. (Figure 3.)

The series of Fed rate hikes that occurred during 2002-2007’s recovery told a similar story. Notwithstanding a steep and rapid ascent by fed funds from the 1% of June 2004 to 5.25% by June 2006, the high-yield bond spread averaged an extraordinarily thin 340 bp from July 2004 through July 2007. At the same time, the VIX index averaged a very low 13.2 points despite the span’s 425 bp hiking of fed funds. Moreover, from June 2004 through October 2007, the market value of US common stock advanced by nearly 11% annualized, on average.


Hong Kong Tightens Mortgage Lending Standards

Another country takes steps to cool their housing market.

Moody’s reports that changes to lending standards by the Hong Kong Monetary Authority (HKMA) will reduce the risks in the Hong Kong housing market which has been buoyant in recent years.

Current elevated property prices pose latent risks to the banking system and make banks increasingly vulnerable to a property price decline. According to Hong Kong’s Rating and Valuation department, residential property prices in the territory have risen for 12 consecutive months since March 2016. Average residential prices rose 4.0% in March 2017 from the end of 2016 and were 4.5% above the previous peak in September 2015.

Hong Kong’s housing affordability is among the lowest in the world, with a price-to-income ratio of more than 20x. The household debt-to-GDP ratio is also at a historical high (see Exhibit 3), raising the specter of a substantial rise in household debt-servicing burden as interest rates rise.

One mitigating factor for these risks is that Hong Kong banks maintain very low loan-to-value (LTV) ratios. The average LTV ratio for new mortgage loans was 51% in March 2017. The new measures will help banks build up more buffers against potential property prices decline.

The measures are credit positive for Hong Kong banks and enhance their resilience in a potential property downturn. The new measures target non-first-time home buyers and borrowers whose income is mainly derived from outside of Hong Kong (see Exhibit 1). These measures will temper credit demands from property investors with high leverage and limit the growth of residential mortgages loans, which increased in March to record year-on-year growth of 5.3%, compared with 4.2% year-on-year growth in December 2016.

Hong Kong banks’ intense competition in the mortgage business has squeezed their interest margins. Pricing for most mortgages has come down to Hong Kong Interbank Offered Rate (HIBOR) plus 1.28% from HIBOR plus 1.7% 18 months ago. HKMA’s requirement to raise the risk weight for new residential mortgage loans to 25% from 15% should deter banks from competing for mortgage business through further price cuts.

Worth reflecting on the fact that Australia’s household debt to GDP ratio is 123, significantly higher than Hong Kong, once again highlighting the issues we have locally!