
Westpac released their 1H18 results today. It was an interesting counterpoint to recent announcements, with stronger NIM, including from Treasury. They CET1 ratio fell a little, but they are still well placed. There were no signs of particular stress in their mortgage books, and they also were able to lift margin by reducing rates on some deposits, though they did signal higher funding at the moment. They also underscored the migration to digital channels which is well in hand, and customer led.
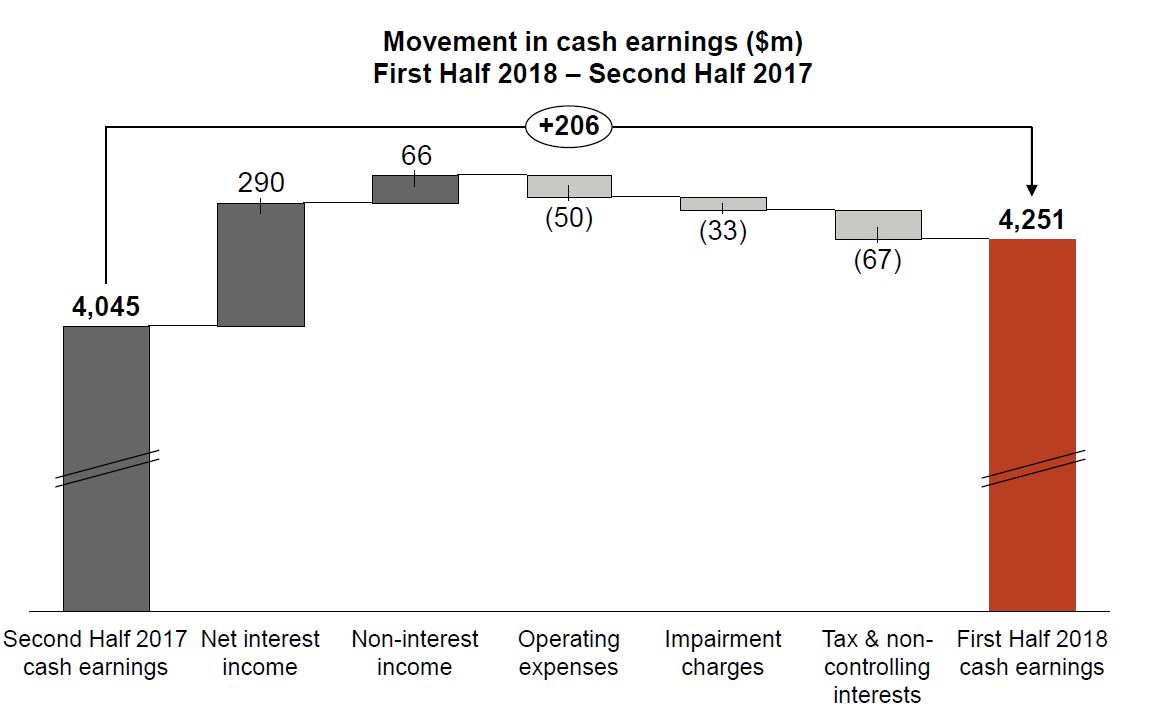
Statuary profit net profit was $4,198m up 7%, on the prior corresponding period (1H17), and cash earnings was up 6% to $4,251m.
 Cash return on equity (ROE) 14.0%, at top end of the 13 – 14% range Westpac is seeking to achieve. The dividend was unchanged at 94 cents per share,
The Federal Government bank levy cost Westpac $186 million pre-tax for the six months. The levy will be paid out of retained earnings and is equivalent to 4 cents per share.
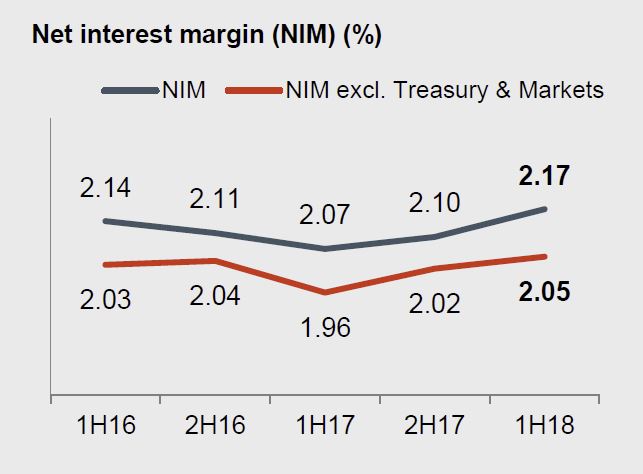
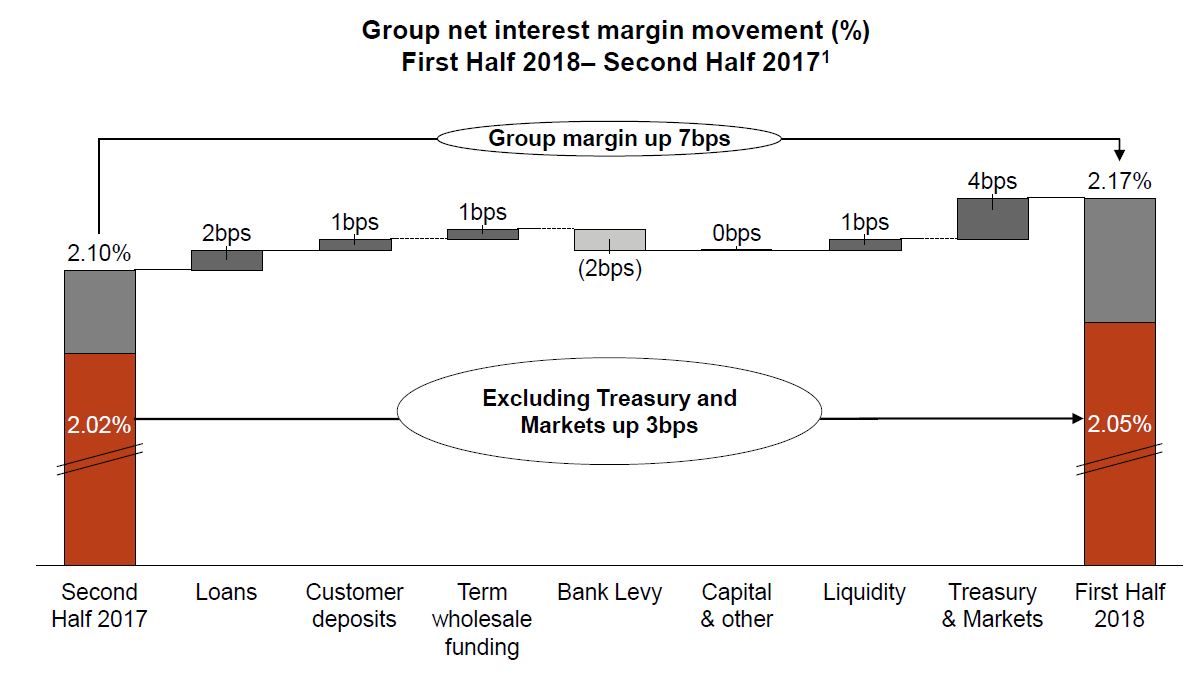
The Net Interest margin was up 7% from the prior period, and a rise in Treasury and Markets income contributed 4 basis points while margins excluding Treasury and Markets increased 3 basis points.
 Net interest income increased $665 million or 9% compared to First Half 2017, with total loan growth of 5%, mostly from Australian housing which grew 6%. Reported net interest margin increased 11 basis points to 2.16%, reflecting higher spreads on certain mortgage types (including investor lending and loans with an interest-only feature), and increased deposit spreads. These were partly offset by the Bank Levy which was effective from July 2017.
 Non-interest income decreased $281 million or 9% compared to First Half 2017 primarily due to a decrease in trading income of $226 million and the impact of economic hedges on New Zealand earnings ($63 million lower).
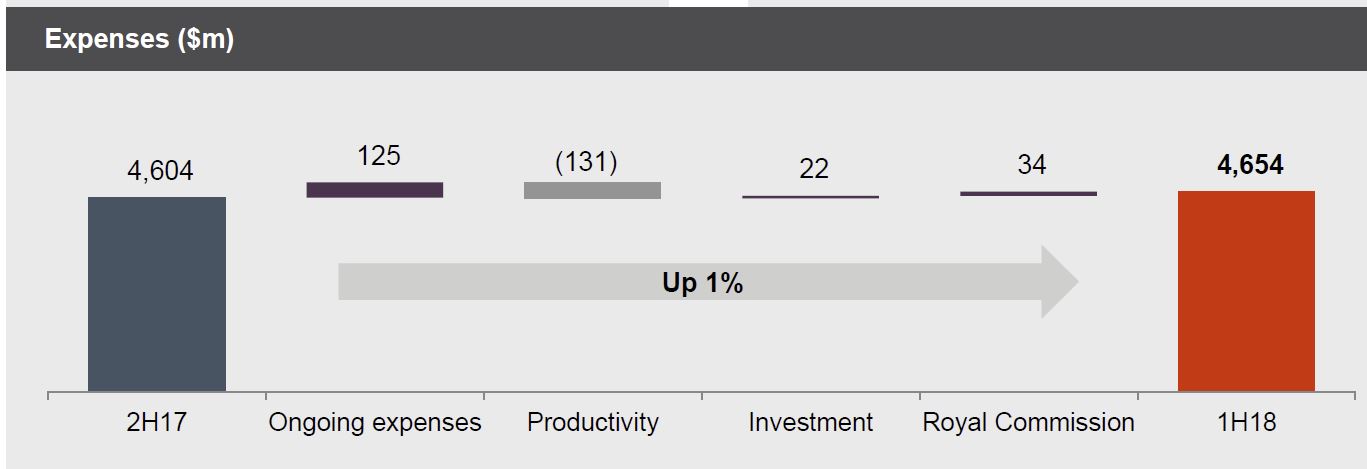
Expenses were up 1%, and included $34 million relating to the Royal Commission. They benefited from $131m productivity savings.
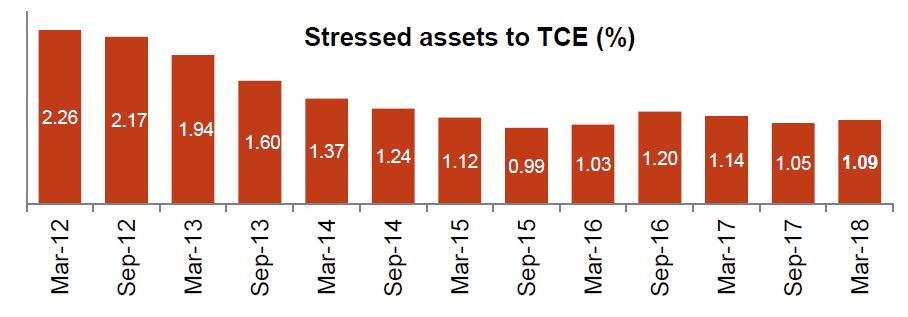
 Stressed assets to total committed exposure were down 5 basis points over the year, but moved from 1.05% in September to 1.09% in March, up 4 basis points.
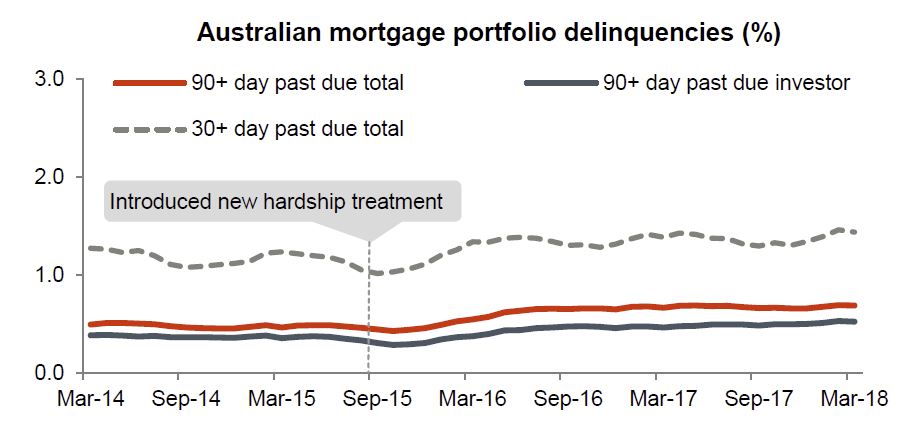
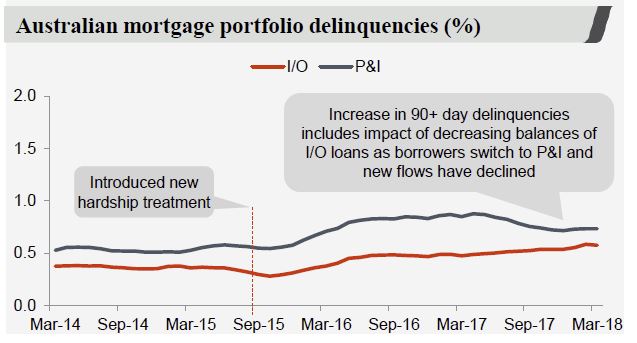
 Mortgage delinquencies were a little higher, but from a low base.
 The CET1 capital ratio was 10.5%, and the liquidity coverage ratio was 134% and the net stable funding ratio 112%.
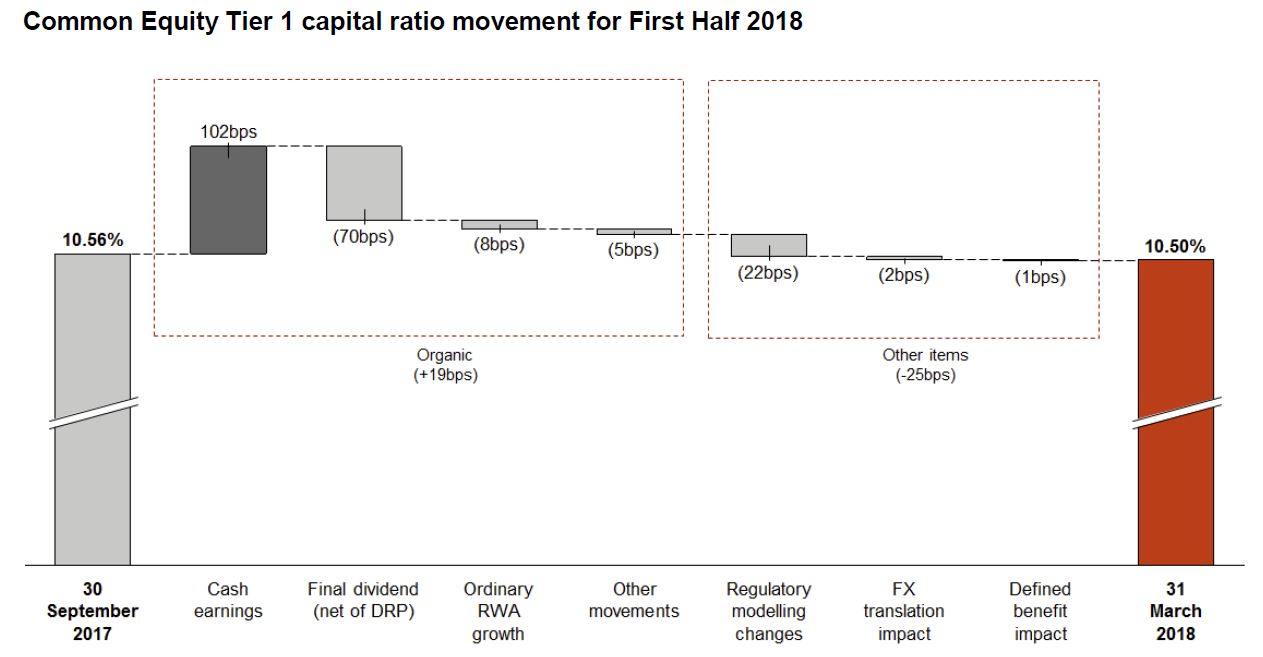
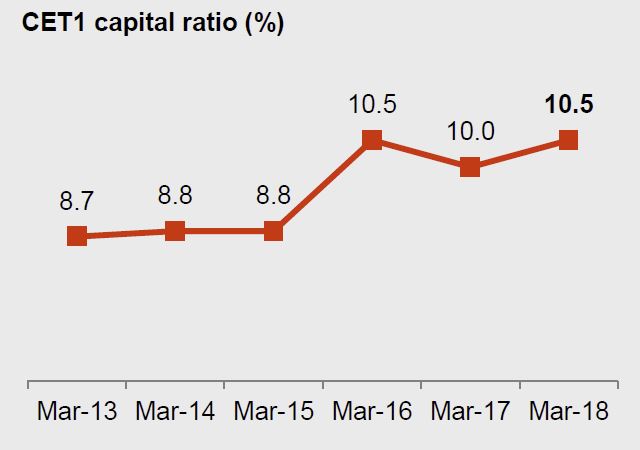 Westpac’s CET1 capital ratio was 10.50% at 31 March 2018, 6 basis points lower than 30 September 2017.
 Looking at the divisional summaries:
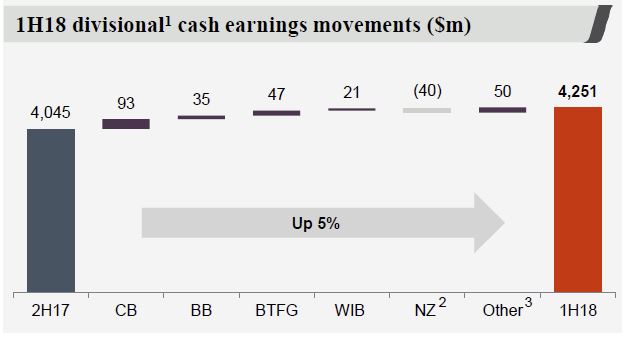 Consumer Bank (CB) has continued to be a key driver of the Group’s growth, lifting cash earnings by 6%. Disciplined balance sheet growth, flat operating expenses and a $60 million reduction in impairment charges were the key drivers of performance. Net interest income increased from a 2% rise in mortgages, a 1% increase in deposits and a 1 basis point improvement in margins. Margins benefited from lower funding costs, including improved spreads on term deposits, and prior period loan repricing although this was partly offset by the full period impact of the Bank Levy and from customers switching to lower rate loans. Non-interest income was lower, mostly due to the elimination and reduction of certain transaction and account keeping fees and lower credit card interchange fees. This was partly offset by the non-repeat of customer refunds and payments that occurred in Second Half 2017. Expenses were little changed (up $3 million) as the division continues to transform itself via digital while enhancing service. More customers migrating to digital channels has supported a 4% decrease in branch transactions and a reduction of 21 branches in the last six months. The reduction in impairment charges reflects the lower seasonal unsecured personal lending write-offs.
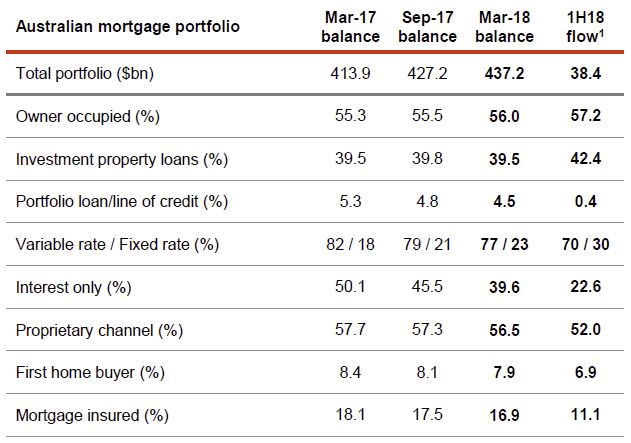
Looking in more detail at the Australian Mortgage portfolio, we see a reduction in interest only loan flow, and a rise in loans from brokers. They have been growing their relative share of investor loans in terms of flow.
 They showed that delinquencies on interest only loans are LOWER than for P&I loans.
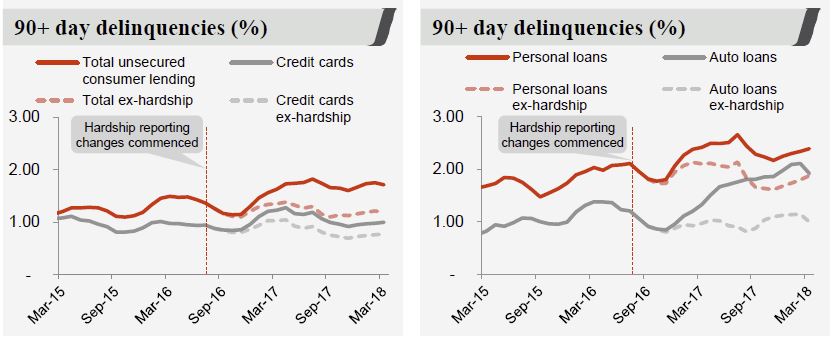
 Personal loan delinquencies have risen.
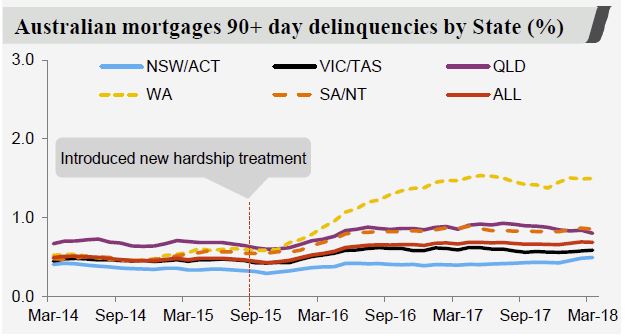
 Mortgage delinquencies are a little higher with WA significantly above, though it now represents just 9% of the portfolio, compared with system 1t 12%.
 Business Bank (BB) delivered a 3% increase in cash earnings. Lending increased 2% with SME business lending up 2%, and commercial lending increasing 2%. Deposits rose 1% over the half, mostly in term deposits. The net interest margin was up 4 basis points, from repricing on certain mortgages in Second Half 2017 and improved term deposit spreads partially offset by the full period impact of the Bank Levy. Non-interest income was up 1% with higher business line fees. Expenses were 1% higher, mostly from higher investment related costs, and regulatory and compliance costs. Credit quality has been sound, although stressed assets to TCE were up 35 basis points, mostly due to commercial customers moving into the watchlist category. Impairment charges decreased $6 million from lower impaired downgrades in the commercial portfolio.
BT Financial Group (Australia) lifted cash earnings 13% with higher funds, an increase in life insurance premiums and a stronger contribution from Private Wealth. Growth was also supported by provisions for customer refunds and payments raised in the Second Half 2017 that were not repeated. Partially offsetting these gains were lower advice income and seasonally higher general insurance claims. Superannuation balances and platform funds were both up 3% while packaged funds increased 4%. Growth was supported by stronger investment markets and $2.6 billion of net flows onto Panorama. Fund margins were lower including from the migration of customers into MySuper accounts which has now been completed. Expenses were well managed, down 1%. The decline was consistent with normal seasonal patterns (higher costs are incurred around the end of the June financial year) and continued productivity gains. Investment spending was a little higher including from the launch of the new super product, “BT Super Invest”. Regulatory and compliance costs were little changed but remain elevated.
Westpac Institutional Bank (WIB) delivered a 4% lift in cash earnings to $551 million. The $21 million rise was due to a 1% rise in core earnings and a $9 million benefit from impairment charges. Supporting core earnings, lending increased by 3% and deposits were 7% higher while markets related income also increased. These gains were partially offset by lower net interest margins and a reduction in Hastings fees. While investing more, particularly in payments, expenses were lower from the full period impact of productivity initiatives. Continuing good credit quality and the workout of further impaired assets led to another impairment benefit in First Half 2018.
Westpac New Zealand delivered cash earnings of NZ$482 million, down 5%, compared to the prior half. The business generated 3% core earnings growth although this was more than offset by a small impairment charge which followed a NZ$40 million impairment benefit in the Second Half 2017. A 3% lift in net interest income was the main driver of core earnings growth with lending up 2%, deposits rising 5% and margins increasing 6 basis points. The rise in margins followed some repricing of mortgage and business lending and improved deposit spreads. Expenses were 1% lower as the benefits from the division’s transformation program flowed through. The program has led to a reduction in the size of the branch network and increased self-serve via digital channels. Impairment charges increased NZ$67 million over the half, as Second Half 2017 benefited from the improvement in the dairy industry and from the increase in consumer delinquencies in First Half 2018.
The Group Businesses delivered cash earnings of $58 million in First Half 2018, up $50 million on the prior half. The increase was due to a higher Treasury contribution (from interest rate risk management) partially offset by higher expenses and an increased impairment charge. Higher expenses were mainly due to increased investment and a rise in regulatory and compliance costs, including expenses associated with the Royal Commission and higher employee costs. The impairment charge in Group Businesses was mostly related to movements in centrally held impairment overlays. The impairment charge was $13 million in First Half 2018 compared to a $32 million benefit in Second Half 2017 – a $45 million turnaround.
They made specific comments on the need to restore their reputation.
The First Half 2018 has continued to see the industry (including Westpac) under intense scrutiny including from the Royal Commission into Financial Services.
Restoring the Group’s reputation has remained a focus and the Group has continued to implement a number of programs aimed at improving trust. In particular, Westpac has largely completed the implementation of the Australian Banking Association’s “Six point plan” with the Group waiting for finalisation of the industry Code of Banking Practice to complete implementation. In 2017 the Group also commenced a broader program to reduce complexity and resolve prior issues that have the potential to impact customers and the Group’s reputation. These reviews have identified some previous instances where the Group has not met industry or community standards and Westpac is taking action to put things right so that customers are not at a disadvantage from past practices. Work on this program over the last 12 months included:
- Progressing the review of products to reassess their features and how the Group had engaged with customers. As part of these reviews, 150 changes were made including more than halving the number of consumer products on offer;
- Cutting transaction fees for 1.3 million customers, removing ATM fees, and introducing a new low rate credit card; and
- Continuing remediation of previous issues, paying out $39 million to customers from our 2017 provision for customer refunds and payments.