
Ratings Agencies are a funny breed, and I am not going to enter the debate as to whether they are ahead of the curve – some will say their track record around the time of the GFC was appalling – and whether they are truly independent; but they are taken seriously by the markets, which reacts when they publish their reports. So today we look at Moody’s assessment of Australia, and Standard and Poor’s Mortgage Delinquency Reports.

So first, to Moody’s who confirmed their rating of Aaa and which puts Australia in an exclusive club alongside United States, Switzerland, Sweden, Norway, Denmark, Netherlands and New Zealand.
They just reviewed the rating (some other agencies still have a negative watch on Australia, meaning they are more concerned about the outlook, given our exposure to foreign trade and debt) and Moody’s concluded that thanks to good GDP numbers, relatively low (on an international basis) Government debt – at only 42% of GDP, though up from 26.5% five years ago and strong institutions (RBA and APRA), the rating is confirmed. The bonus income from higher resources prices also helped.
This rating is important because it directly translates to the cost of government debt, and is a signal to the international community of the economic strength of the country.
Now Moody’s did highlight some concerns about the Government needing to control spending in order to bring the budget back into balance as forecast, against a fraught political background – by which I assume they mean the independents in the Senate and their perchance for blocking the passage of legislation; and also the risks from high levels of household debt in a flat wage environment. But they make the point that on a relative basis Australian Households are still enjoying a high per capital income ($50,334 in 2017) is in line with other Aaa economies, and this they say, offers capacity to absorb income shocks, and a base to support taxes as needed.
They suggest that household income growth will be lower than government forecasts, but they are still looking for GDP growth around 2.75%. They also suggest that Government spending will remain under pressure given the expected 6% rise in social welfare programmes including health and NDIS.
In terms of risks, they see two first is rising household debt, which they say exposes the economy and government finances. Second is Australia’s reliance on overseas funding, which may be impacted by changes in internal investor sentiment. Rate rises abroad might lift the cost of government and bank borrowing, adding extra pressure on the economy. But their judgement is, these risks are not sufficient to dent the prized Aaa ratings.
But, now square this with S&P Global Ratings RMBS Performance Watch to 31st March 2018. They revised arrears data for February and March 2018 to reflect an originators’ revisions to arrears data for these months. As a result, the prime 30 day SPIN including noncapital market issuance was 1.37% in Q1 2018, up from 1.07% the previous quarter.
They say that loans more than 90 days in arrears were at a historically high level at the end of Q1, indicating that mortgage stress has increased for some borrowers.
In addition, the major banks which account for around 43% of total prime RMBS loans outstanding recorded the largest movement in arrears during Q1 and are now trending above the prime SPIN. On the other hand, nonbank financial institutions saw their loans more than 30 days in arrears fall to 0.50% in Q1 2018 from 0.60% in Q4 2017.
Arrears for nonconforming RMBS increased to 4.19% in Q1 2018 from 4.08% in Q4 2017. Some of this increase is off the back of a decline in outstanding loan balances. Arrears on investment loan arrears reached 1.19% in Q1. Owner-occupier loan arrears were 1.56% at the end of Q1.
Half of all interest-only loans in Australian RMBS transactions will reach their interest-only maturity date by 2019. We expect this transition to be more pronounced for investor loans, of which 46% have an interest-only period compared with 12% of owner-occupier loans underlying RMBS transactions.
Prepayment rates are declining. The average prepayment rate for March is 19.58% and they believe some borrowers could be facing refinancing difficulties in the face of tougher lending conditions. A slowdown in refinancing activity can precipitate a rise in arrears, particularly in the nonconforming sector because borrowers have fewer options available to manage their way out of financial difficulty.
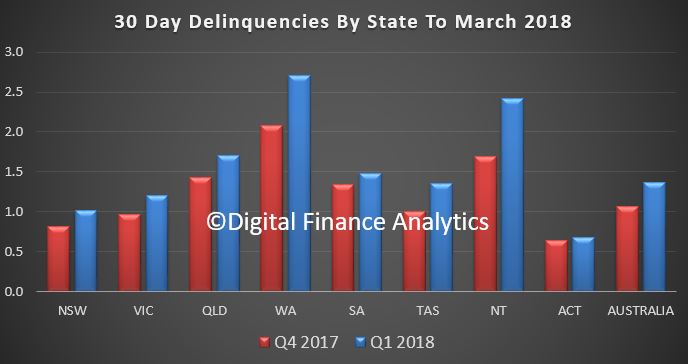
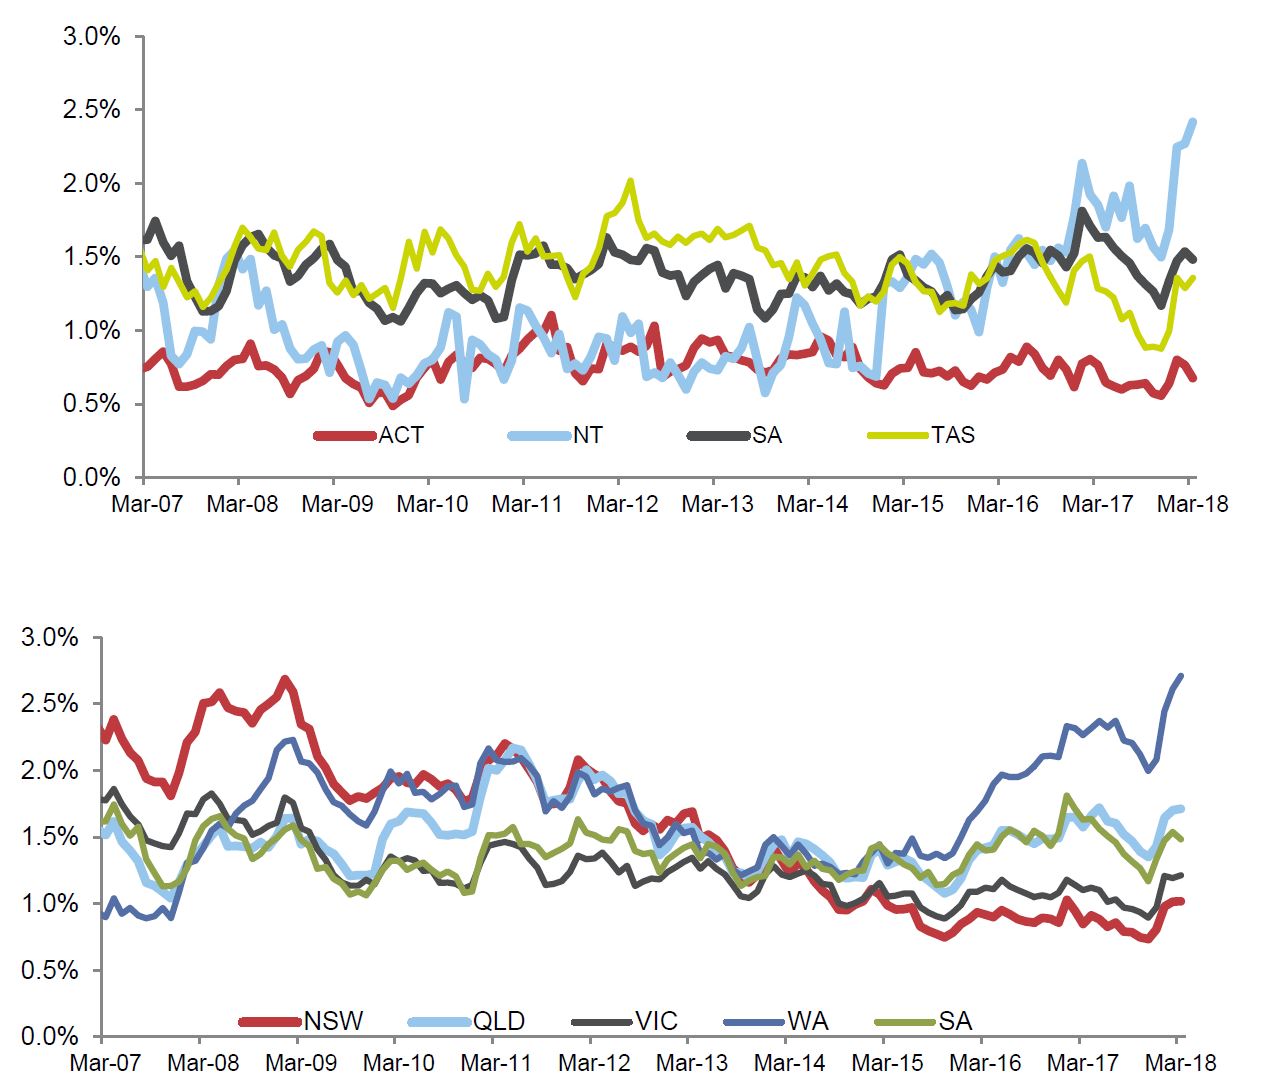 Across the states, the Australian Capital Territory in Q1 2018 again had the lowest arrears of all the states and territories, at 0.68%. Western Australia meanwhile again recorded the nation’s highest arrears, at 2.71%. Arrears rose during Q1 in most parts of the country. South Australia recorded the biggest year-on-year improvement in arrears, with loans more than 30 days in arrears declining to 1.48% in Q1 2018 from 1.63% in Q1 2017.
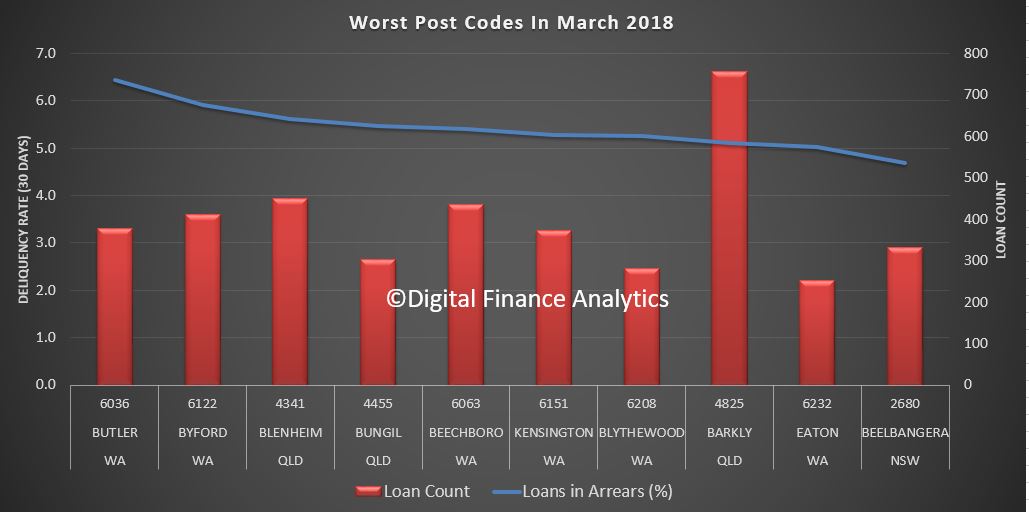
Nine of the 10 worst-performing postcodes in Q1 2018 are in Queensland and Western Australia. These included Butler, and 6036, Byford 6122, both in Western Australia, Blenheim 4341 and Bungil 4455 in Queensland, Beechboro 6063, Kensington 6151 and Blythewood 6208 in Western Australia, Barkly 4825 in Queensland, Eaton in Western Australia and Beelbangera 2680 in New South Wales.
 They called out some important risk factors around interest rate rises and debt servicing.
Household indebtedness in Australia is high, particularly by international standards. This does not provide much headroom if the economic situation deteriorates or when interest rates start rise. Low interest rates and improving employment conditions are keeping mortgage arrears low in the Australian mortgage sector, but Australian borrowers’ sensitivity to rate rises has increased. A rapid ratcheting up of interest rates, as occurred between September 2009 and October 2011, when rates went up by around 2 percentage points, would see arrears go beyond their previous peaks, given household indebtedness has continued to increase during the past five years.
Debt serviceability issues are exacerbated in more subdued economic climates when refinancing opportunities are limited, particularly for borrowers of a higher credit risk, because lenders invariably tighten their lending criteria. In this scenario, some borrowers will find it harder to manage their way out of their financial situation, leading to higher arrears and potential losses. In our opinion, self-employed borrowers, nonconforming borrowers, and borrowers with high LTV loans are more likely to face greater refinancing difficulties in more subdued economic climates.
Property prices affect the level of net losses in the event of borrower default. From an RMBS perspective, the strong appreciation in property prices has increased borrowers’ equity for well-seasoned loans, and this helps to minimize the level of losses in the event of a borrower default. While property price growth is slowing, most loans underlying Australian RMBS transactions are reasonably well insulated from a moderate decline in prices. Given the high seasoning of the Australian RMBS sector of around 64 months, most borrowers have built up a reasonable degree of equity, as evidenced by the sector’s weighted-average LTV ratio of 60%. This provides a buffer against a moderate property price decline. Higher LTV ratio loans are more exposed to a decline in property prices because they have not built up as much equity to absorb potential losses. Around 14 % of total RMBS loans have high LTV ratios of more than 80%.
They conclude that arrears to trend higher if interest rates rise. Improving employment conditions and historically low interest rates will keep defaults low in the short to medium term, however. Economic headwinds such as softening property prices, rising interest rates, and tougher refinancing conditions will create cash-flow pressures for some borrowers.
So, two agencies with different perspectives. Personally, based on the data we have from our surveys, and as we discussed in our recent posts on both mortgage stress and household financial confidence, we suspect the SPIN data is closer to the mark – but bear in mind that RMBS mortgage pools are carefully selected, and many not contain higher risk loans. So even this may be understating the real state of play.
And in a way that nicely highlights the uncomfortable juxtaposition between the top level macroeconomic picture, and real life among Australian households. The trouble is, the state of the latter is very likely to impinge on the former as mortgage debt grinds on. And this could certainly lead to more issues down the track