The RBA released an important report today on The Changing Way We Pay: Trends in Consumer Payments. Their paper contains the results of the third Survey of Consumers’ Use of Payment Methods which was conducted in November 2013. The survey used a diary and end-of-survey questionnaire to collect data on the use of cash, cards and a range of other payment methods, both at the point of sale and via remote channels (online, mail and telephone). They say that 2013 data show that cash and cheque use has continued to fall. The use of cards has risen significantly, and there has also been an increase in the use of PayPal. The growth in the use of cards and the reduction in cash use are evident across households in all age and household income groups. The strong growth in remote payments is one contributor to the observed change in the use of cash and cards. However, the main contribution is from the increased use of cards at the point of sale, which is likely to reflect both growth in the availability of card terminals at merchants and changing consumer preferences as authentication methods have evolved.
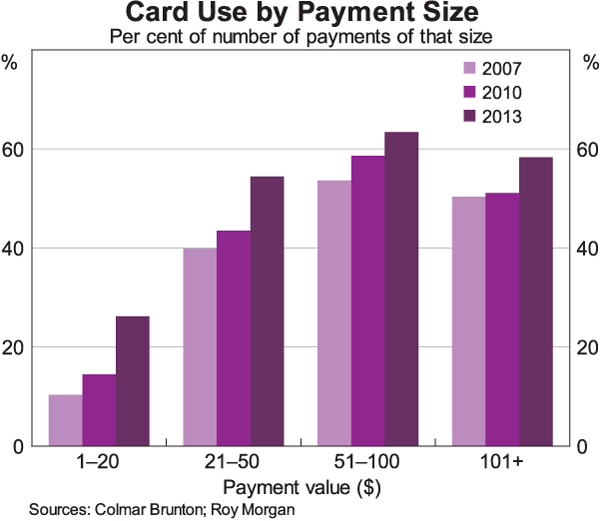
In an accompanying speech, The Way We Pay: Now and in the Future, Tony Richards, the Head of Payments Policy Department outlined the main findings from the report. Here are some of the main points. First, lower-value payments were typically made with cash, while card payments became more common for larger payment values and other electronic payments were typically used for only for higher-value payments. Over time, electronic payments have increasingly been used for lower-value payments.
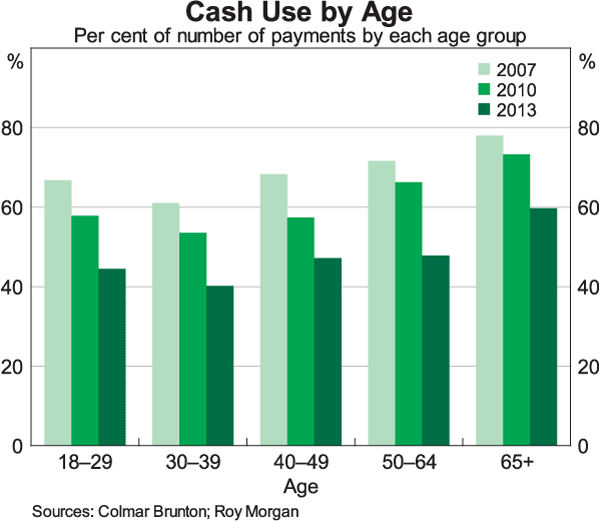
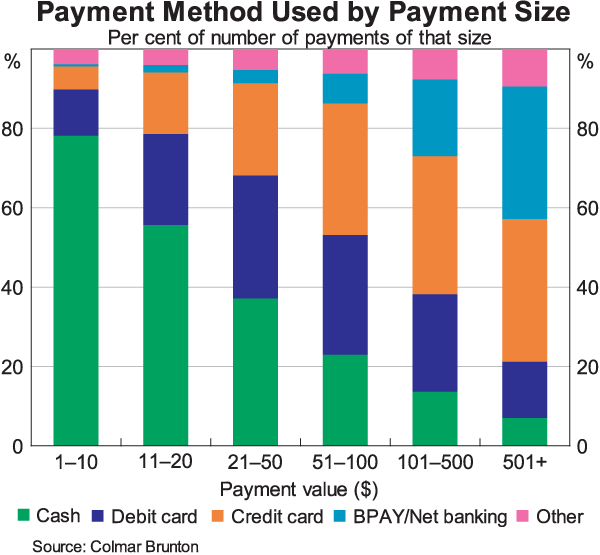 Looking across age groups, cash is used more by older individuals than by younger ones. But the decline in its share of all transactions is evident across respondents in all age-groups. The decline is also fairly broad-based across different types of merchants. It can be partly explained by the fact that the mix of transactions in the economy is gradually shifting from in-person to online, where cash is essentially not used. However, it is mostly a function of the decline in cash use in the traditional point-of-sale environment and the development of newer electronic technologies that can match or surpass the convenience and speed of cash in some types of transactions and transfers.
 The flip-side to the declining use of cash has obviously been the rise in the use of payment cards for transactions of all sizes. This has been associated with continuing growth in the number of card terminals in Australia (up by around 35 per cent over the six years to 2013), and advances in card technologies and authentication methods. The ongoing shift to the use of PINs in card transactions and the sharp pick-up in the use of contactless payments have both resulted in a reduction in the typical time needed to complete a card transaction.
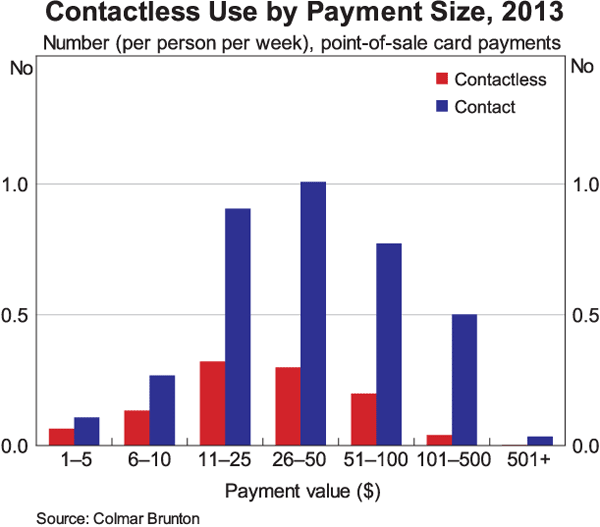
 In the latest survey, two-thirds of respondents reported that they had a card with contactless functionality and almost half of these reported a contactless transaction in the week of the study. Contactless transactions accounted for 22 per cent of all face-to-face card transactions. This share was significantly higher for payments under $20
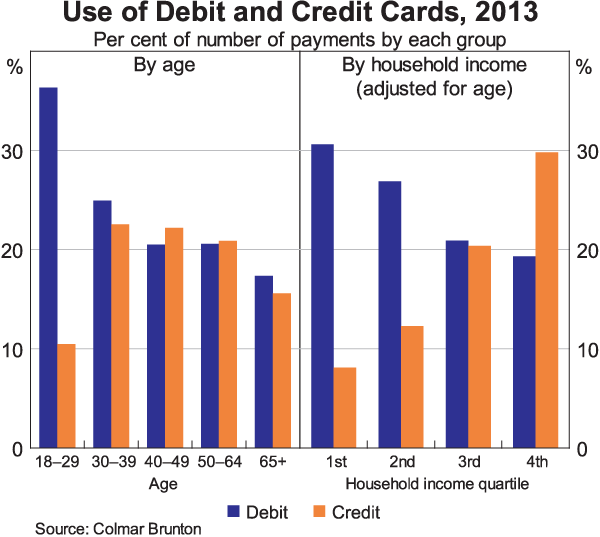
 The survey shows that there are significant differences in the use of debit and credit cards across demographic groups. Younger households are much more likely to use debit cards than credit cards, presumably reflecting reduced access to credit cards and a preference to ‘use their own money’. Lower income households also use debit more frequently than credit, most likely for similar reasons. However, those in the highest income quartile use their credit card significantly more than their debit card. This may well reflect the greater desire to get reward points associated with credit card use. The survey shows that an individual in the highest income quartile is six times more likely to have a premium credit card than a household in the lowest income quartile.
 The survey shows a significant decline in the use of cheques. Around 80 percent of respondents reported that they had not written a cheque over the previous year. Cheque use is especially low in younger age groups. However, it is also declining significantly in older age groups. We can expect the decline in the use of cheques to continue as other payment methods became available to meet either the needs of households that currently still prefer to use cheques or the needs of businesses that find there are few alternatives for some specific uses.
The survey also provides evidence on the growth of some relatively new means of making payments or transfers.
- For example, it shows that PayPal was used for around 3 percent of transactions in 2013, up from around 1 per cent in 2010. This mostly reflects an increase in the share of transactions occurring online and an increase in PayPal’s share of that market.
- Smartphone payments are an area of strong innovation in the payments system. The survey shows that there is a shift toward making more person-to-person transfers using smartphones, with around 9 per cent of transfers to family and friends made via smartphone. However, the use of smartphones for payments was still low, at less than 1 per cent of consumer payments to businesses. It appears that, for the time being, smartphones are mostly a convenient alternative method of internet access, rather than a means of payment in their own right. This clearly has the potential to change as new near-field communications (NFC) or Bluetooth technologies for point-of-sale smartphone payments emerge.
So overall we see a significant and continued migration away from cash and cheques to cards and electronic payments. This is consistent with our recent research on consumer banking channel preferences, the Quiet Revolution. The UK is further ahead with new mobile payment mechanisms. Next time we will discuss the current initiatives in Australia to migrate payments onto a new payments platform (NPP) by 2016.

