The Current State Of Play In The Property Market

An extract from the latest edition of the DFA report, the Property Imperative, released last week.

The Australian Residential Property market is valued at over $5.2 trillion and includes houses, semi-detached dwellings, townhouses, terrace houses, flats, units and apartments. In the past 10 years the total value has more than doubled. It is one of the most significant elements driving the economy, and as a result it is influenced by state and federal policy makers, the Reserve Bank, Banking Competition and Regulation and other factors. Residential Property is therefore in the cross-hairs of many players who wish to influence the economic fiscal and social outcomes of Australia.
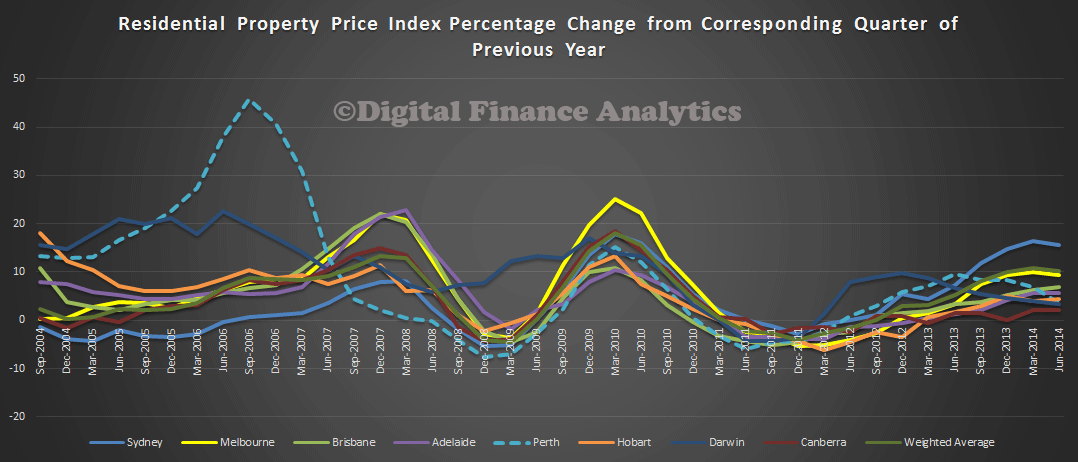
ResidentialPricesYOYJune2014
According to the Reserve Bank (RBA), as at July 2014, total ADI housing loans were a record $1.382 trillion , an increase of 8.5% in investor loans and 4.8% in owner occupied loans over the past year. There were more than 5.08 million housing loans outstanding with an average balance of about $237,000 . Approximately two-thirds of total loans were for owner-occupied housing, while one-third was for investment purposes. 43.2% of new loans issued were interest-only loans , this is a record.

After a significant credit fueled boom in 2002-2007, momentum slowed after 2007 as a result of the Global Financial Crisis (GFC). The RBA dropped rates directly after the immediate crisis, but then lifted them again to a peak of 4.5% in 2011 in response of a property rebound and the mining sector investment sector boom. In 2013 its benchmark rate was cut to an all-time low of 2.5% which has stimulated further property demand, as the resource sector transitions from an investment to exploit phase. Through 2014, rates have remained at 2.5%, and in the latest RBA minutes, they suggest a continuation for some time at this level .

The Australian Bureau of Statistics says property prices have risen in every capital city in the past year to June 2014. Annually, residential property prices rose in Sydney (+15.6%), Melbourne (+9.3%), Brisbane (+6.8%), Adelaide (+5.6%), Hobart (+4.3%), Perth (+3.6), Darwin (+3.4%), and Canberra (+2.2%) . The Residential Property Price Index (RPPI), a measure including houses and attached dwellings, for the weighted average of the eight capital cities rose 1.8% this quarter, for a total rise of 10.1% over the last year.

More Evidence That House Prices Are Too High

The Economist has just published its latest interactive house price comparison tool. It enables comparisons to be made across multiple countries, comparing absolute prices, real prices, rental ratios and prices against income. It is a powerful tool and highlights some interesting facts. One nice thing is you can select the range of dates also. Here are a few examples. First the trend in prices for selected countries. It shows Australia near the top of the list.

EconomistAug2014-TrendAll

The trend since 2000 shows Australia clearly out in front amongst the countries I selected.

EconomistAug2014-Trend2000sTurning to price relative to income, we see Australia again featuring near the top

EconomistAug2014-IncomeTrendAllLooking at the trends since 2000, we see how rentals are tracking. High, but not as high a house price movements suggesting perhaps linkages to interest rates and income growth?

EconomistAug2014-RentTrend2000sBut the most stunning chart in my view shows the change in values since 1975. We lead the way in Australia, leaving New Zealand, Canada and the UK in our wake. Also its worth noting the Japan story, no upward growth since 1975, that’s a different world.

EconomistAug2014-ChangeAllFinally, in real terms, after correcting for inflation, Australia is way, way out in front looking at the long run from 1975. The trend since 2000 is not quite so stark.

EconomistAug2014-PriceRealTrendAll EconomistAug2014-PriceRealTrend2000sWe like the tool, and recommend it if you want further proof that Australian property on an international basis looks expensive, on nearly any measure you care to select. But there is a broader question to reflect on. What is driving sky high property prices in a number of countries, including New Zealand, Canada and UK? Could the ultra low interest rates and quantitative easing in Europe and US simply be the root cause, inflating stock prices and property prices? The mega-economic experiment we are in the midst of is a path never before trod. So the outcome is not certain.


Latest DFA/JP Morgan Mortgage Industry Report Launched Today

The latest report, volume 20 of the Mortgage Industry Report series was released today. As well as over viewing current industry trends, this time we focus on some of the mortgage pricing issues in the light of the FSI interim report, capital and funding.

JPM authored their report using DFA research data as detailed in the Property Imperative which is available on request from DFA. Because of compliance issues the final JPM version of the report is only available direct from them.

Go here for more details of our research programmes, and for media requests, go here.

MortgageReport20Face

RBA Leaves Rate Unchanged Again!

At its meeting today, the Board decided to leave the cash rate unchanged at 2.5 per cent.

Monetary policy remains accommodative. Interest rates are very low and have continued to edge lower over recent months as competition to lend has increased. Investors continue to look for higher returns in response to low rates on safe instruments. Credit growth has picked up a little, including most recently to businesses. The increase in dwelling prices continues. The exchange rate, on the other hand, remains above most estimates of its fundamental value, particularly given the declines in key commodity prices. It is offering less assistance than would normally be expected in achieving balanced growth in the economy.


Building Approvals Up in July – ABS

The ABS released their Building Approvals data series today to July 2014. The seasonally adjusted figures show a lift on the previous month, although the original data shows a slight fall. The trend estimate for total dwellings approved fell 0.5% in July and has fallen for seven months, however the seasonally adjusted estimate for total dwellings approved rose 2.5% in July following a fall of 3.8% in the previous month.

ValueDwellingsJuly2014The trend estimate for private sector houses approved fell 0.2% in July after being flat in the previous month. The seasonally adjusted estimate for private sector houses rose 1.4% in July following a fall of 1.0% in the previous month. The trend estimate for private sector dwellings excluding houses fell 1.0% in July and has fallen for eight months. The seasonally adjusted estimate for private sector dwellings excluding houses rose 5.9% in July following a fall of 9.4% in the previous month. The mix between units and houses continues the trend, which commenced in 2009, where we see more units being approved. As we commented previously, this reflects the impact of high prices and strong demand, especially for investment property.

NumberDwellingsPCJuly2014Turning to the value of building approvals,  the value of residential building rose 0.2% and has risen for two months. However, the seasonally adjusted estimate of the value of residential building rose 0.8% following a fall of 3.2% in the previous month. In comparison, the value of non-residential building fell 26.5% after rising for two months.

NumberDwellingsJuly2014

Capital City Dwelling Values Strongest Capital Gain since 2007 – RP Data

RP Data released their August Hedonic Home Value Index showing that capital city dwelling values moved 4.2% higher over the three months to the end of August, the strongest capital gain over the three months of winter since 2007. You can read the full release here.

RPDATAAugust2014RPDATAAugust22014