ASIC Updates Responsible Lending Guidance

ASIC has updated its guidance for credit licensees on their responsible lending obligations.

Credit licensees cannot rely solely on benchmark living expense figures rather than taking separate steps to inquire into borrowers’ actual living expenses.

The updated guidance reflects:

  • a recent Federal Court decision that is relevant to all credit licensees regarding their responsible lending obligations
  • changes to statutory restrictions on charges for small amount credit contracts, and
  • clarification of existing guidance, and removal of some material that we consider to be repetitive or no longer necessary.

On 26 August 2014, the Federal Court handed down its first decision on the responsible lending obligations: ASIC v The Cash Store (in liquidation) [2014] FCA 926 (refer: 14-220MR).

The Federal Court ruled that The Cash Store Pty Ltd (in liquidation) and loan funder Assistive Finance Australia Pty Ltd had failed to comply with their responsible lending obligations in relation to their customers, the majority of whom were on low incomes or in receipt of Centrelink benefits.

The Federal Court’s decision makes it clear credit licensees must, at a minimum, inquire about the consumer’s current income and living expenses to comply with the responsible lending obligations. Further inquiries may be needed depending on the circumstances of the particular consumer.

ASIC has updated Regulatory Guide 209 Credit licensing: Responsible lending conduct (RG 209) to incorporate the general findings of the Federal Court on the responsible lending obligations for credit licensees.

APRA Releases Final Mortgage Lending Guidance

Following its earlier draft, APRA today released a final prudential practice guide for authorised deposit-taking institutions (ADIs) on sound risk management practices for residential mortgage lending.

Prudential Practice Guide APG 223 Residential mortgage lending (APG 223) provides guidance to ADIs on addressing housing credit risk within their risk management framework, applying sound loan origination criteria and appropriate security valuation methods, managing hardship loans and establishing a robust stress-testing framework.

There are a number of tweaks made in response to submissions they received. The intent remains unchanged.

Draft APG 223 has been amended to clarify APRA’s intention that senior management would review risk targets and internal controls, as appropriate, with Board oversight.

APRA has amended draft APG 223 to be consistent with CPS 220. That is, an ADI would set risk limits for various aspects of residential mortgage lending, so that the ADI operates well within its tolerance for credit risk.

APRA accepts that an ADI should seek to ensure that the portfolio in aggregate, and not the individual loan, is able to absorb substantial stress (such as in an economic downturn) without producing unexpectedly high loan default losses for the lender; and APRA has also clarified that the interest rate buffer would factor in increases over several years rather than the full term of the loan.

APRA expects ADIs to assess and verify a borrower’s income and expenses having regards to the particular circumstances of the borrower. In view of the uncertainty and challenges in estimating living expenses, APRA supports ADIs adopting a prudent approach. This would include the use of margins when benchmarks like HEM or HPI are incorporated into the assessment. Furthermore, consistent with the updated RG 209, APRA advises that the use of benchmarks such as HEM or HPI is not a replacement for verification and assessment of the borrower’s declared expenses. The APG 223 has been amended to ensure consistency with ASIC’s updated RG 209.

It is not APRA’s intention to restrict access to finance for impending retirees. However, it is not prudent for ADIs to rely on superannuation lump sums for repayment unless their quantum is verifiable and timing reasonably known, which is likely to be the case closer to retirement. Consequently APRA does not propose to amend the guidance in draft APG 223.

APRA’s industry-wide data on residential mortgage lending indicates that, over the past several years, both direct and broker originated home loan loss rates have been quite low, due to low default rates and continued growth in home loan collateral values. APRA’s data also indicates, however, that there is a significantly higher default rate for broker-originated loans compared to loans originated through proprietary channels. This higher default rate would be expected to translate to higher loss rates, particularly in adverse  circumstances. APRA has, however, made some amendments to APG 223 to address some of the specific comments made in submissions, e.g. the sections on risk appetite and remuneration.

The application of the remuneration requirements to all ‘persons whose activities may affect the financial soundness of the regulated institution’ is an existing requirement of CPS 510. Therefore,including brokers in an ADI’s remuneration policy is not new and APG 223 aligns remuneration and risk management in the important area of residential mortgage lending origination. For the avoidance of doubt, APG 223 is intend ed to capture an ADI’s engagement with its brokers, not how a broker firm pays its staff.

APRA considers it appropriate to retain references in APG 223 to the claw back of commissions; however, some amendments have been made to the guidance in this area. References to specific circumstances under which claw backs should occur have been removed; APG 223 instead refers to the importance of ensuring remuneration arrangements ‘discourage conflicts of interest and inappropriate behaviour’. In addition, APRA continues to encourage ADIs to monitor the performance of third – party originators, with a view to restricting or terminating relationships with originators who have unexpectedly elevated levels of loan defaults or materially deficient loan documentation and processing.

APRA considers that it is appropriate for ADIs to pay particular attention to potentially riskier loan types. The guidance identifies several types of loans that may fall into this category, but the examples are not intended to be exhaustive or definitive. Each type of loan may be appropriate in certain circumstances, and ultimately the need for specific portfolio limits should be assessed by each ADI with respect to its own portfolio.

The type of valuation undertaken may depend on the level of risk involved; however, the valuation approach should ensure adequate provisioning where required. APRA has amended the guidance to indicate that valuations other than a full revaluation may be appropriate in certain circumstances, e.g. for loans with a very low LVR.

Appropriate stress testing should be tailored to the particular risk exposures of an individual ADI. APRA’s supervisory experience is that serviceability data collected at loan origination remains useful for ongoing stress testing and portfolio risk management, and good practice suggests that this data should be retained while it possesses material value.

APRA has amended the section on LMI to acknowledge its use by ADIs as a risk mitigant, to smooth out the normal variability of losses that occurs over time and to diversify regional concentrations of risk.

CBA Trading Update Solid

The CBA advised that its unaudited cash earnings for the three months ended 30 September 2014 were approximately $2.3 billion. Statutory net profit on an unaudited basis for the same period was approximately $2.4 billion, with non – cash items treated on a consistent basis to prior periods.

Overall business momentum was maintained. In home lending, focus remains on profitable growth in a competitive market, with strong new business levels balanced by higher repayment activity in a low interest rate environment. In commercial lending, system credit growth remained subdued, with the Group growing relatively strongly in priority markets. Household deposit growth continued in the quarter, with the Group growing slightly ahead of system. In Wealth Management, net flows,
investment performance and FX impacts contributed to Assets under Management growing by 3.5 per cent over the three months, notwithstanding equity markets ending the quarter lower. Insurance inforce premiums increased by 2 per cent.

Credit quality remained sound, with retail arrears flat to slightly improved and impaired assets lower at $3.1 billion. Total loan impairment expense was $198 million in the quarter (that’s around 13 basis points of the loan book), with strong provisioning levels maintained and the economic overlay unchanged.

Funding and liquidity positions remained strong, with liquid assets of $145 billion, customer deposit funding at 63 per cent and the average tenor of the wholesale funding portfolio at 3.8 years. The Group completed $12 billion of new term issuance in the quarter.

The Group’s Basel III CET1 (APRA) ratio as at 30 September 2014 was 8.6 per cent, down from 9.3 per cent at 30 June 2014. The Group’s Basel III Internationally Comparable Common Equity Tier 1 (CET1) ratio as at 30 September 2014 was 12.9 per cent.

Like the other banks, margins are under some pressure, thanks to a fall in funding costs being more than offset by competitive pricing.

The data shows CBA’s strong position and franchise, and they are well positioned to handle any change in capital rules, or other factors. We believe they are also best positioned with regards to the transition to digital channels.

RBA Leaves Rate On Hold Once More

At its meeting today, the Board decided to leave the cash rate unchanged at 2.5 per cent.

Growth in the global economy is continuing at a moderate pace. China’s growth has generally been in line with policymakers’ objectives, though weakening property markets there present a challenge in the near term. Commodity prices in historical terms remain high, but some of those important to Australia have declined further in recent months.

Volatility in some financial markets has picked up over the past couple of months. Overall, however, financial conditions remain very accommodative. Long-term interest rates and risk spreads remain very low. Markets still appear to be attaching a low probability to any rise in global interest rates or other adverse event over the period ahead.

In Australia, most data are consistent with moderate growth in the economy. Resources sector investment spending is starting to decline significantly, while some other areas of private demand are seeing expansion, at varying rates. Public spending is scheduled to be subdued. Overall, the Bank still expects growth to be a little below trend for the next several quarters.

Recent data on prices confirmed that inflation is running between 2 and 3 per cent, as expected, and this is likely to continue. Although some forward indicators of employment have been firming this year, the labour market has a degree of spare capacity and it will probably be some time yet before unemployment declines consistently. Hence, growth in wages is expected to remain relatively modest over the period ahead, which should keep inflation consistent with the target even with lower levels of the exchange rate.

Monetary policy remains accommodative. Interest rates are very low and have continued to edge lower over the past year or so as competition to lend has increased. Investors continue to look for higher returns in response to low rates on safe instruments. Credit growth is moderate overall, but with a further pick-up in recent months in lending to investors in housing assets. Dwelling prices have continued to rise.

The exchange rate has traded at lower levels recently, in large part reflecting the strengthening US dollar. But the Australian dollar remains above most estimates of its fundamental value, particularly given the further declines in key commodity prices in recent months. It is offering less assistance than would normally be expected in achieving balanced growth in the economy.

Looking ahead, continued accommodative monetary policy should provide support to demand and help growth to strengthen over time. Inflation is expected to be consistent with the 2–3 per cent target over the next two years.

In the Board’s judgement, monetary policy is appropriately configured to foster sustainable growth in demand and inflation outcomes consistent with the target. On present indications, the most prudent course is likely to be a period of stability in interest rates.

ABS Adjust Labour Force Stats Again

The ABS have now reworked the seasonally adjusted numbers, which effectively lifts the unemployment rate slightly.

In the time since the September 2014 labour force estimates were released, the ABS has systematically assessed the effects of each supplementary survey on the labour force estimates. Significant effects have been found for some supplementary surveys, with little or no measurable impact caused by others. As a result of this analysis, an approach has been developed to re-estimate the seasonality of the labour force data with specific adjustments made for the changed pattern of supplementary surveys. This approach will be adopted for the October 2014 labour force release and will result in revisions to the previously-estimated seasonally adjusted (and consequently the trend) results.

In practice, the new seasonal methods should be used to revise the seasonally adjusted estimates for every month in the labour force estimates (i.e. from February 1978 to October 2014). However, checking the consistency of every series from 1978 is not possible in the short time available (the seasonal adjustment process is based on adjusting at a detailed level and aggregating the component series to the totals for persons employed and unemployed) even though the impacts will be small for most months.

The most urgent need has been to resolve the problems in the last few months in the time series. Therefore, as an interim measure, the new approach has been used only from December 2013 to October 2014. In practice, the impact of this interim measure on the percentage changes in seasonally adjusted persons employed and unemployed between November and December 2013 is minimal.

The revised methodology will be applied in future months. In addition, work will continue on refining the methodology and verifying the changed seasonal factors for the full length of the monthly series. The ABS expects to revise all the seasonally adjusted data in conjunction with the annual seasonal reanalysis in early 2015.

The Labour Force Survey uses the concurrent seasonal adjustment method to derive seasonal factors. Concurrent seasonal adjustment uses data up to the current month to estimate seasonal factors for the current and all previous months. This process can result in revisions each month to estimates for earlier periods. However, in most instances, the only noticeable revisions will be to the seasonally adjusted estimates for the previous month and one year prior to the current month. Concurrent seasonal adjustment will continue to be used during the next few months. However, as an interim measure, any revisions to seasonally adjusted estimates will be restricted to the period from December 2013 onwards until the annual seasonal reanalysis is completed in early 2015.

Setting the seasonal factors to one for the seasonally adjusted unemployment estimates for July, August and September 2014 published on 9 October resulted in a slight downward bias in the number of persons unemployed and the unemployment rate for those three months. This was not observed in other series and has been rectified by the new seasonal analysis.

UNEMPLOYMENT RATE (TOTAL PERSONS) – SEASONALLY ADJUSTED

Month
Revised to be used in October 2014 publication
Presented in the September 2014 publication
%
%

June 2013
5.7
5.7
July 2013
5.6
5.7
August 2013
5.7
5.8
September 2013
5.7
5.7
October 2013
5.7
5.8
November 2013
5.8
5.8
December 2013
5.9
5.9
January 2014
6.0
6.0
February 2014
5.9
6.0
March 2014
5.8
5.8
April 2014
5.9
5.8
May 2014
5.9
5.9
June 2014
6.1
6.0
July 2014
6.1
6.0
August 2014
6.1
6.0
September 2014
6.2
6.1


Interest Only Loans – The UK Experience

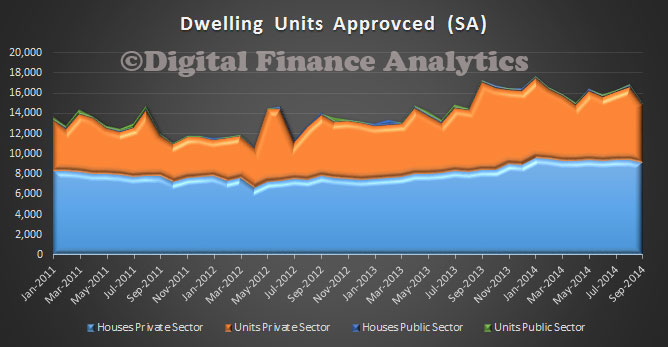
According to APRA, interest only loans continue to grow as a proportion of all home loans. Recently Moodys warned about the increased risks which may stem from this type of loan. So the question is, should we be concerned, bearing in mind the recent RBA commentsindicative of speculative demand motivating a rising share of housing purchases. Consistent with mortgage interest payments being tax-deductible for investors, the interest-only share of approvals to investors remains substantially higher than to owner-occupiers”?

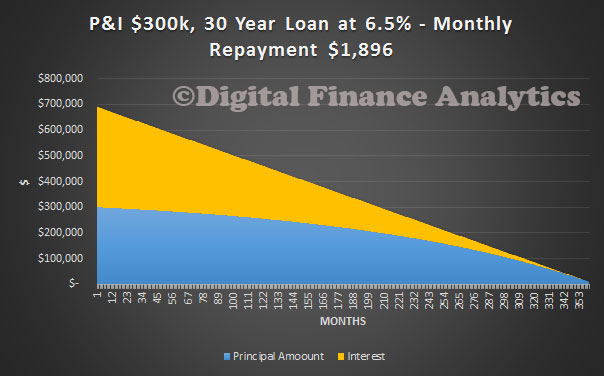
There are a number of reasons why interest only loans are attractive, especially for those using negative gearing. But the main reason is that the monthly payment are lower, thus improving servicability. Here is an example, of a $300,000 Principal and Interest Loan, at a nominal 6.5%. The monthly repayment over 30 years is $1,896.

P&I1
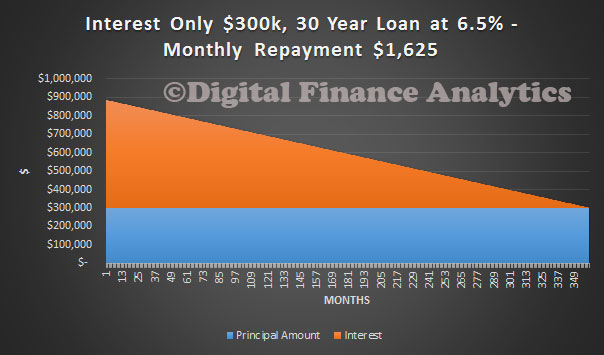
However, on an interest only basis, using the same values, the repayment drops to $1,625, more than $250 a month lower. The small problem though is that in 30 years time, you still have to repay the capital balance. Now of course, in real terms the value will be eroded by inflation, and house prices are likely to rise, so the assumption is that the value generated in the property can then be realised, repaying the loan, (or from other sources e.g. superannuation?). In practice, interest rates may move, and sometimes people switch to P&I after a period of time.

P&I2

So, now lets look at the UK experience. There are 11.3 million mortgages in the UK, with loans worth over £1.2 trillion. At the end of 2013 there were an estimated 2.2 million pure interest-only loans outstanding, and a further 620,000 part interest-only, part repayment mortgages outstanding on lenders’ books. Compared to 2012 this represents a fall of around 300,000 pure interest-only mortgages (down 12%), and around 90,000 part-and-part mortgages (down 13%).

According to the Council for Mortgage Lenders, at the peak of their popularity in the late 1980s, interest-only mortgages accounted for more than 80% of all loans taken out. This year, however, lenders are likely to advance only around 40,000 new interest-only loans for residential house purchase, less than 10% of the total.

Among first-time buyers, the decline in interest-only borrowing has been particularly pronounced. CML data shows that only 2% are taking out interest-only mortgages, with 98% opting for repayment loans. Interest-only accounts for a higher proportion of new borrowing by existing owner-occupiers who are moving (10%) and those remortgaging (13%).

Most new interest-only borrowing is in the buy-to-let market (aka investment mortgage), where this option remains the norm for very good reasons. Fixed-rate interest-only mortgages minimise costs for landlords and are more likely to produce a profitable margin. Interest-only mortgages also enable landlords to meet lenders’ requirements that their rental income produces an average minimum cover of 125% of their borrowing costs.

A couple of years back, there were concerns in the UK that interest only loans may be a problem, and alongside regulatory commentary, CML produced an “interest-only toolkit” designed to help mortgage lenders to work with their interest only mortgage customers, especially those loans due for repayment before 2020.

The regulators reached the conclusion that 90% of interest-only mortgage holders have a repayment strategy in place. Lenders made a commitment with the regulator (the Financial Conduct Authority) to contact interest-only loan holders and ask about their repayment plans.  The CML via it lender members found that Lenders have been using a variety of contact strategies. In addition to reminders and mailings requesting the customer’s written response (including questionnaire responses), telephone calls, face-to-face meetings and even home visits are also used by some lenders. Overall, around 30% of customers contacted have so far responded.

Among those borrowers who have responded, around four out of five already had a clear plan. Among those who did not, the survey found that the solutions and approaches lenders are offering typically include term extensions, permanent conversions to capital and interest, and overpayments.

There has also been a positive set of changes in the loan-to-value profile of outstanding interest-only mortgages. Two-thirds of outstanding interest-only mortgages have loan-to-value (LTV) ratios of less than 75% – and the vast majority of these are not due to mature until after 2020.

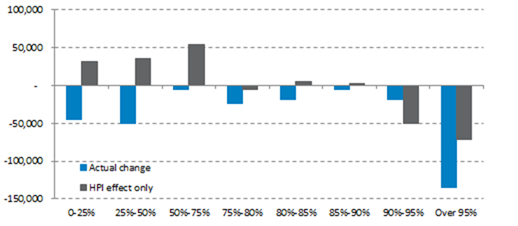
The chart shows that a large number of loans would have moved into a lower LTV band as a result of house price inflation alone. However, it also shows that borrowers are taking additional action to reduce their mortgage balances, as the effect of house price inflation alone would not have resulted in the improvements in outstanding LTVs that have been seen over the past year. Indeed, the number of loans in every LTV band below 75% would have seen an increase on the basis of house price inflation alone (as loans moved down from higher LTV bands) – but, in fact, every band saw a decrease.

Changes in interest-only loans outstanding, September 2012-December 2013, by LTV

01.05.14-changes-in-interest-only-loans-outstanding-by-ltvUnder the new mortgage regulations now in force in the UK, lenders may offer interest only loans, but only if a borrower has a credible repayment plan, at the time of application.

So some points to ponder.

1. How many interest only loans in Australia have a credible repayment strategy? To what extent is this considered by borrowers and lenders at the time of application?

2. Will rising house prices be the solution to interest-only loan repayment?

3. Are the review processes (on average each 5 years in Australia, even if the loan term is 25/30 years) sufficiently robust to identify potential issues?

4. Does Negative Gearing lead to a greater dependence on interest-only loans?

Big Four Serve Up $28.6bn Profit

The results are now in for the last year from the major banks, and combined they delivered more than $28bn in cash profit, higher than the $27bn last year.

There are several key drivers of profitability, the first is housing lending. Rises in property prices inflates new loans, and the banks’ balance sheets. If the property market takes a turn down, this will have an impact. Net interest margin is down a little (thanks to discounting) but is now being offset by lower deposit rates.

The second is efficiency and some players are doing a lot better than others in excellence of execution, thanks to technology investments, and cultural transformation. This will continue as new technology and channels become ever more mainstream. This may open the door on new competitors, as discussed in our Quiet Revolution report.

The profit contribution from wealth management will continue to grow, as superannuation balances increase thanks to the enforced savings scheme. This may be offset by a reduction in fees. Is FOFA another sleeper? Well, unless the Senate does something surprising, the FOFA regulation will work in the banks favour, so no.

The enigma factor with regards to continuing performance is whether via the FSI or directly, the regulators lift the capital requirements for the majors. There is a strong argument to do this, because as the concentration risks in the mortgage book become an ever larger share of the total book, the Basel III rules mean the banks can get away with ever lower capital reserves. Those within the banks will claim they already have more than enough capital, and would be put at a disadvantage compared to other international players. However, on an international comparison basis, Australian banks are relatively less well capitalised. The current rules also make lending to business less attractive in comparison to home loans. Capital rules may be selectively targetted at property investors and especially those signing up to interest only loans.

If capital requirements are lifted, the banks will have to raise their pricing to match, but on the other hand they can also trim their deposit margins, and tweak their discounting strategies. So, we believe that even if capital requirements were adjusted up, there is really little likely impact on bank profit. Margins and fees in Australia are still relatively high and competition works for the majors.

So, overall, we think that profit landscape is going to remain relatively benign, external economic shocks excepting. Those with a strong local franchise will be best positioned.

Building Approvals Flat In September – ABS

ABS Building Approvals show that the number of dwellings approved were flat in September 2014, in trend terms, holding steady for the last two months. Approvals of house dwellings has been declining slowly in trend terms for the last 6 months. The seasonally adjusted estimate for total dwellings approved fell 11.0% in September after rising for two months.

Dwelling approvals increased in September in the Australian Capital Territory (4.0 per cent), South Australia (1.3 per cent), Western Australia (0.9 per cent) and Queensland (0.7 per cent), but decreased in Tasmania (5.1 per cent), the Northern Territory (1.7 per cent), New South Wales (1.0 per cent) and Victoria (0.6 per cent) in trend terms.

In trend terms, approvals for private sector houses fell 0.2 per cent in September. Private sector house approvals fell in Victoria (1.8 per cent), South Australia (0.7 per cent) and Western Australia (0.3 per cent), but rose in Queensland (1.7 per cent) and New South Wales (0.9 per cent). The seasonally adjusted estimate for private sector houses fell 2.3% in September and has fallen for two months.

The value of total building approved rose 0.1 per cent in September, in trend terms, following a fall of 0.2 per cent in the previous month. The value of residential building fell 0.6 per cent and the value of non-residential building rose 1.4 per cent in trend terms. The seasonally adjusted estimate of the value of total building approved fell 9.5% in September following a rise of 1.9% in the previous month. The value of residential building fell 16.1% following a rise of 5.5% in the previous month. The value of non-residential building rose 5.3% after falling for two months.

BuildingApprovalsSept2014

The State Of House Price Movements

The RPData CoreLogic Home Value Index for October shows an average increase in prices of 1% across the capital cities. However, there are major variations. Although combined capital city home values were up by 1.0 per cent over the month, only Sydney (1.3%), Melbourne (1.9%) and Brisbane (0.6%) actually recorded value rises over the month.

Dwelling values rose by 2.2 per cent over the three months to October 2014 however, only half of the capital cities actually recorded an increase in values. The greatest value falls over the last three months were recorded in Hobart (-2.8%) and Canberra (-2.4%).

RPDataOct312014


Westpac Profit Up 12%

Westpac released their full year results today. Headline was a 12% uplift in statutory net profit, to $7,561 million for the 12 months to 30 September 2014, compared with 2013 results of $6,751 million. Continued focus on the Australian market is clearly paying off. “While all divisions performed well, Australian Financial Services (AFS) has had a particularly strong year. All businesses in AFS delivered double digit earnings growth, with well managed margins and a 6% increase in banking customer numbers. We provided more than $87 billion in new lending to Australian retail and business customers over the year, while growing in line or above system across all key markets in the second half.”

Looking at cash profit, WBC recorded $7.63 billion, an 8 per cent increase on the previous year and slightly ahead of analyst estimates at $7.62bn.

The Group grew at or above system in all key markets in the second half of 2014, including growing at system in Australian mortgages, 1.3x system in household deposits and 1.4x system in business lending.

Net interest income was $13,496 million, up 5%, with an 8% rise in average interest-earning assets and a 7bps decrease in net interest margin to 2.08%. The full year decline in net interest margin principally reflects a lower Treasury contribution, higher levels of liquid assets and lower interest rates impacting returns on capital.

Non-interest income was $6,324 million, a 7% increase, driven largely by another strong performance from the Australian wealth and insurance business, BT Financial Group.

WBC reported an expense to income ratio of 41.6%, which is sector leading; and a further decline in impairment charges which were 23% or $197 million lower.

WBC will pay a fully franked final dividend of 92c to shareholders on the register at November 12. Westpac’s total distribution for the year is$1.82, a 5 per cent lift on the previous year.

We note their continued focus on customer centricity, and the emerging digital strategy, both of which position well for future performance.