No Rate Change Today – RBA

At its meeting today, the Board decided to leave the cash rate unchanged at 2.25 per cent.

Moderate growth in the global economy is expected in 2015, with the US economy continuing to strengthen, even as China’s growth slows a little from last year’s outcome.

Commodity prices have declined over the past year, in some cases sharply. The price of oil in particular is much lower than it was a year ago. These trends appear to reflect a combination of lower growth in demand and, more importantly, significant increases in supply. The much lower levels of energy prices will act to strengthen global output and temporarily to lower CPI inflation rates. Prices for key Australian exports have also been falling and therefore Australia’s terms of trade are continuing to decline.

Financial conditions are very accommodative globally, with long-term borrowing rates for several major sovereigns at all-time lows. Financing costs for creditworthy borrowers remain remarkably low.

In Australia the available information suggests that growth is continuing at a below-trend pace, with overall domestic demand growth quite weak as business capital expenditure falls. As a result, the unemployment rate has gradually moved higher over the past year. The economy is likely to be operating with a degree of spare capacity for some time yet. With growth in labour costs subdued, it appears likely that inflation will remain consistent with the target over the next one to two years, even with a lower exchange rate.

Credit is recording moderate growth overall. Growth in lending to investors in housing assets is stronger than to owner-occupiers, though neither appears to be picking up further at present. Lending to businesses, on the other hand, has been strengthening recently. Dwelling prices continue to rise strongly in Sydney, though trends have been more varied in a number of other cities. The Bank is working with other regulators to assess and contain risks that may arise from the housing market. In other asset markets, prices for equities and commercial property have risen, in part as a result of declining long-term interest rates.

The Australian dollar has declined noticeably against a rising US dollar over the past year, though less so against a basket of currencies. Further depreciation seems likely, particularly given the significant declines in key commodity prices. A lower exchange rate is likely to be needed to achieve balanced growth in the economy.

At today’s meeting the Board judged that it was appropriate to hold interest rates steady for the time being. Further easing of policy may be appropriate over the period ahead, in order to foster sustainable growth in demand and inflation consistent with the target. The Board will continue to assess the case for such action at forthcoming meetings.

A Deep Dive Into Mortgage Discounts

We have been highlighting the battle for market share, and the varying discounts which are available to some. Today we deep dive into the world of discounts, drawing data from our market model. We conclude that households, on average, get better discounts which using  a broker, discounts for investment loans are more generous, and reconfirm that more affluent households get the best deals. We also see that competition and deep discounts are making many loans unprofitable to the banks who make them (taking fully absorbed costs into account). As such, the current deep discounts are unsustainable.

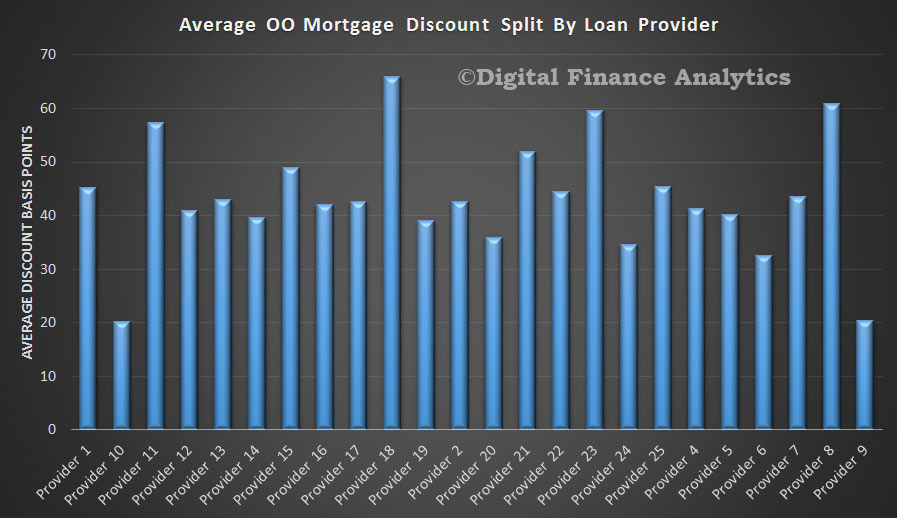
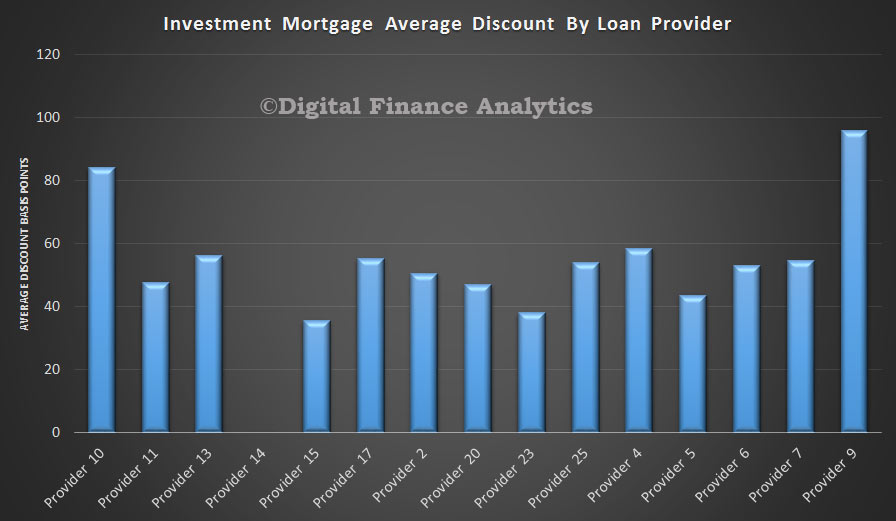
We start by looking at the average discounts in basis points individual loan providers are offering. Some are significantly more aggressive than others. We have hidden the real names of the lenders concerned. We see that there are more banks offering owner occupied loans than investment loans. The best average discount for an investment loan is from provider 9.

Invetsment-Loans-Discount-By-Provider

Some of the owner occupied providers are quite generous in their discounts, but generally investment loans get bigger discounts at the moment.

OO-Discounts-By-Provider

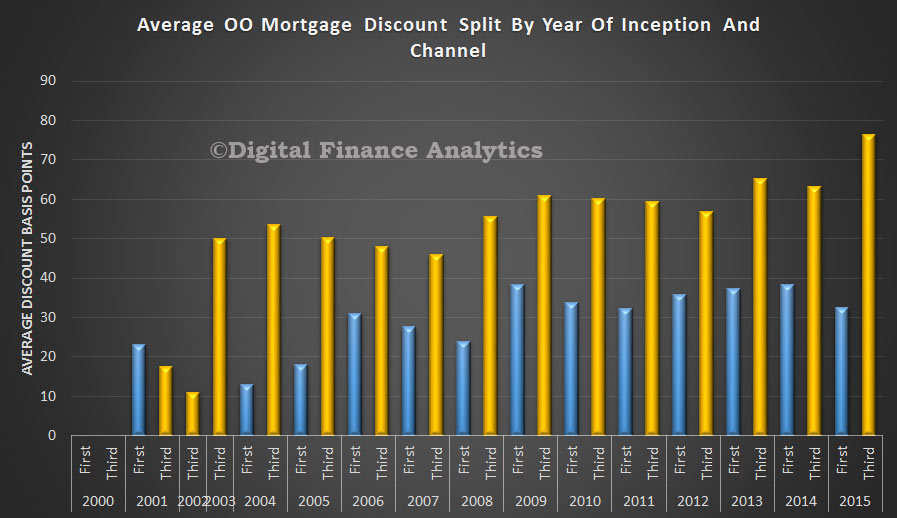
Looking at channel of origination, and year of inception of the loans, we see that consistently third party (broker) loans get bigger discounts, and that the discounts have been growing in recent years.  In the owner occupied sector, discounts for loans via the branch (first party) are slightly lower in 2015.

OO-Mortgage-Discount-By-Year-and-Channel-APr-2015

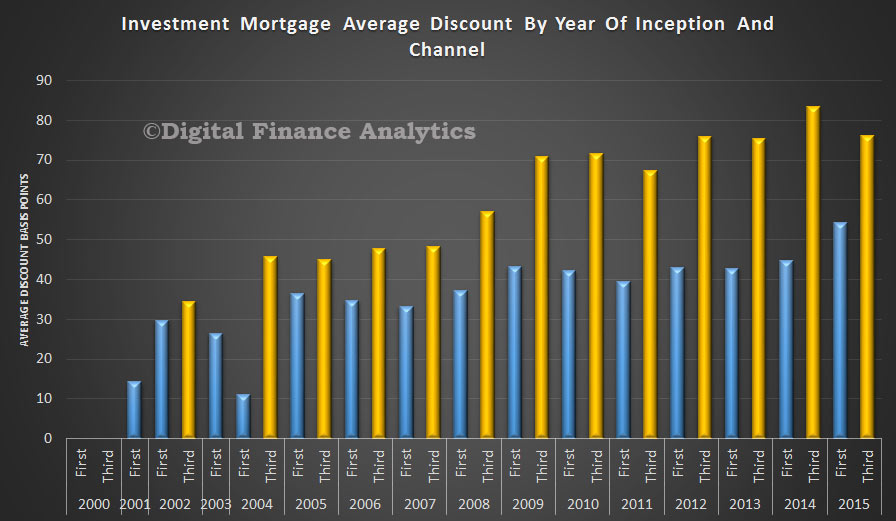
In the investment loan sector, we see a trend of growing discounts in recent years, with third party originated loans getting a better deal.

INvestment-Discounts-By-Year-and-Channel

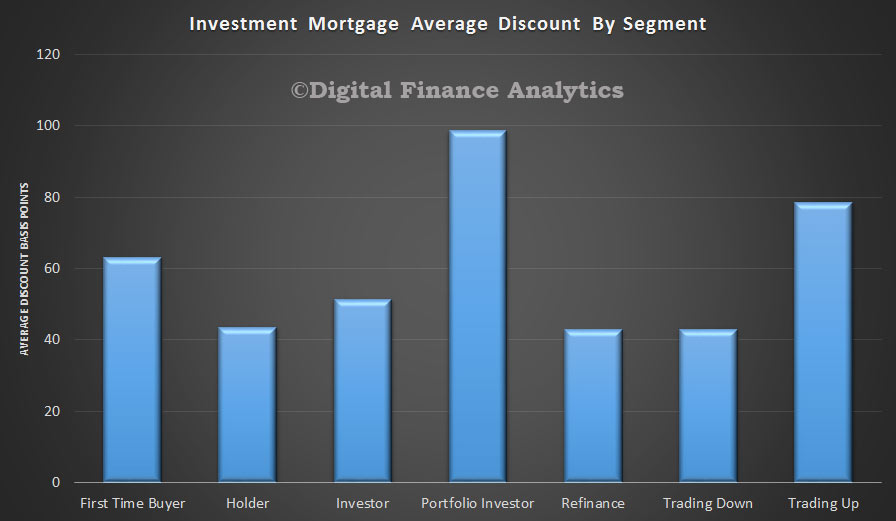
Turning to the DFA property segments, in the investment loan category, we see that portfolio investors are getting the very best discounts, whilst first time buyers are not doing so well, but they are slightly ahead of holders, refinance and trading down households.

Investment-DIscount-By-Pry-Segment-Apr-2015

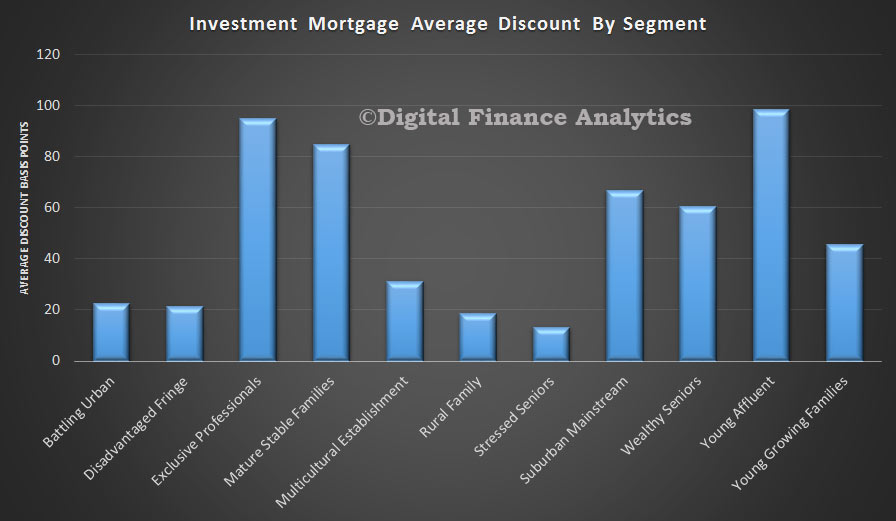
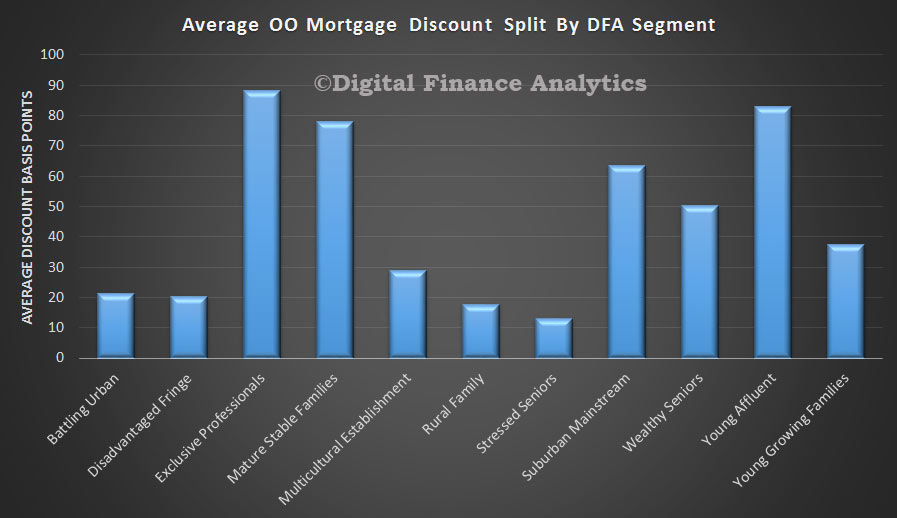
Looking at our master household segments, we see that the wealthy – professionals and young affluent get the best deals. Those with less bargaining power do not do so well.

Investment-Discounts-By-Segment-Apr-2015

This is true of both investment mortgages (above) and owner occupied mortgages below, though we see that in the latter case, the discounts are slightly less generous.

OO-Discounts-By-Segment-Apr-2015

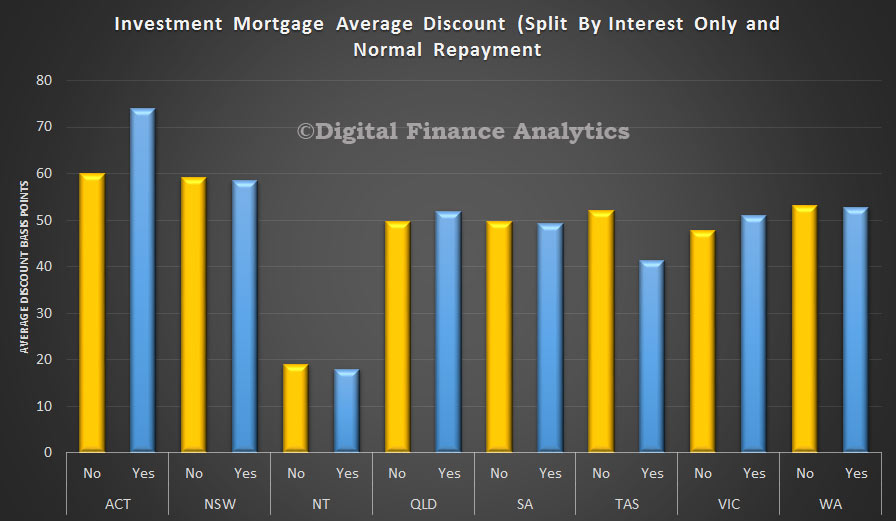
We also see that interest only loans command a larger discount in some states, especially in ACT. Others are more line ball.

Investment-Discounts-Apr-2015

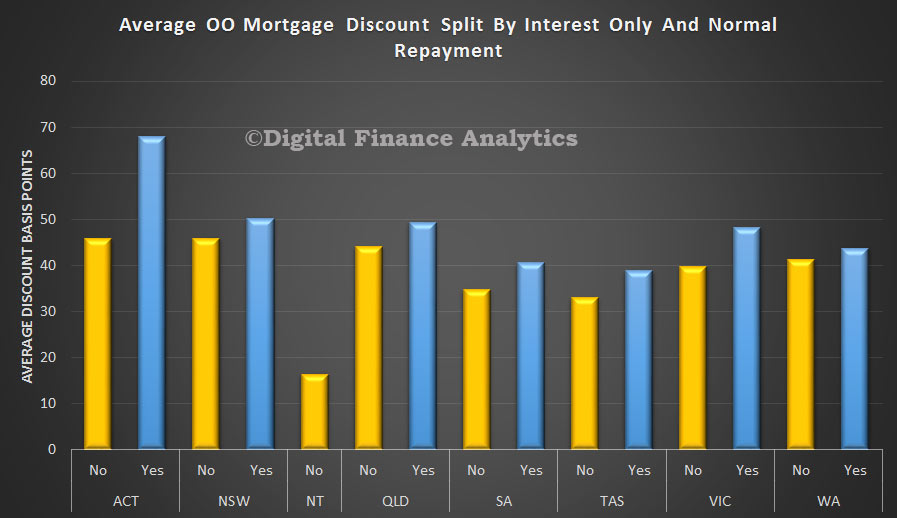
In comparison interest only owner occupied loans can consistently command a larger discount, than normal repayment loans, but as highlighted already these discounts are on average a little lower than in the investment sector.

OO-Discounts-Apr-2015So what is the profit impact of these discounts? DFA has calculated the relative profit of each loan and using an index we can display the relative profit contribution in cash terms. For owner occupied loans, up until 2013, most years were net profitable to the lenders. We note that this changed in 2014 and 2015 as discounts expanded, and competition increased. Overall in cash terms they are making a slight net loss on some loans written now.  This is partly explained by the one off costs of setting up a new loan, and initial broker commissions. As loans age, they on average become more profitable.

The investment loan profit footprint is very interesting, as here we see a consistent fall in the profit index since 2010, with the largest drops in 2014 and 2015. This is explained partly by the significant growth in volumes, and the deeper discounting. Again, older loans become more valuable. Most banks would calculate an amortised cost of origination, spread over a number of years, but we prefer a true cash view.

We conclude from this that recent loans for many providers (especially those less efficient) will be loosing money initially, and the portfolio will be supported by the older more profitable loans. We also think that discounts are unsustainable at current levels, and will see them come off over the next few months.

Retail Turnover Rises 0.7 per cent in February 2015

The latest Australian Bureau of Statistics (ABS) Retail Trade figures show that Australian retail turnover rose 0.7 per cent in February following a rise of 0.5 per cent in January 2015, seasonally adjusted.

In seasonally adjusted terms the largest contributor to the rise was food retailing (1.2 per cent). Household goods retailing (1.8 per cent) and other retailing (1.3 per cent) also recorded rises in February 2015. There were falls in department stores (-3.2 per cent), cafes, restaurants and takeaway food services (-0.4 per cent) and clothing, footwear and personal accessory retailing (-0.2 per cent).

In seasonally adjusted terms there were rises in all states and territories in February 2015. The largest contributor was New South Wales (0.7 per cent) followed by Victoria (0.8 per cent), South Australia (1.7 per cent), Western Australia (0.7 per cent), Queensland (0.2 per cent), the Australian Capital Territory (1.6 per cent), the Northern Territory (2.3 per cent.) and Tasmania (0.7 per cent).

The trend estimate for Australian retail turnover rose 0.3 per cent in February 2015 following a 0.3 per cent rise in January 2015. Through the year, the trend estimate rose 4.0 per cent in February 2015 compared to February 2014.

Online retail turnover contributed 2.8 per cent to total retail turnover in original terms.

The Problems with Relying on the Bank of Mum and Dad

DFA recently highlighted the rise of the bank of Mum and Dad. In The conversation, there is an article highlighting some of the potential risks, especially with formal bank guarantees.

Ask a parent how far they would go to support the financial aspirations of their children, and chances are they will say: “Yes, if I had the money I would be happy to act as a guarantor for my children to purchase a property.”

Australian capital city house prices rose by 7.9% in 2014, while the number of first home buyer commitments as a percentage of total owner occupied housing finance commitments is near record lows – 14.2% in January 2015, compared to 20.4% in December 2012.

Many family-assisted first-home purchases are not being counted in the first home buyer data collected by the Australian Bureau of Statistics, but it’s likely the growing cost of owning a home is encouraging an increasing number of parents to help out via a guarantee, interest-free loan, initial deposit or simply making a monetary gift to their children. This financial support can change an individual’s decision to buy or rent a house or unit. Parental support can also help first home buyers avoid mortgage insurance charges that can easily exceed A$15,000 for a family home in a desirable suburb.

The risk to parents

Consumer advocates cite “lots of cases” where guarantors have been faced with the prospect of losing their home.

Since 2004 Australian banks have offered specific “family pledge” or “family guarantee” loans, allowing parents to provide both equity support and income support. These products are driving growth in the sector, adding to the risk for parents.

In the current economic climate with rising unemployment and costs of living, parents need to understand the risks of acting as guarantor, and all the legal responsibilities that come with it. The guarantor has a legal responsibility to repay the loan (along with any fees, charges and interest) if the borrower defaults. If the guarantee is tied against assets such as the family home, guarantors may end up losing their home, particularly if the parents’ financial position or health conditions have changed over the years. Often the lenders can sue the guarantor if the loan obligations are not met by the debtor. If parents have concerns, it may be a good idea to contribute towards the deposit so that a guarantee is not required.

It is equally important for parents to be educated with regard to the purpose of the loan, amount of the guarantee, to know in detail if their children have stable incomes, and the kind of loan they are guaranteeing (such as lines of credit or overdraft which have no specific time to maturity).

The risk to the banking sector

Family-pledged loans can be categorised as non-conforming loans, an area where lenders seek to minimise the level of risk as much as possible. The Australian Prudential Regulatory Authority has outlined some guidelines for ADIs with regard to loans including a guarantor relationship (e.g. from a parent of the borrower) to cover shortfalls in minimum deposit requirements. APRA acknowledges these loans carry a high risk and ADIs should carefully assess the guarantor’s income, credit worthiness, enforceability of potential claims and the value of any collateral pledged by the guarantor. APRA also emphasises that as a risk management strategy a prudent ADI should establish portfolio limits within its risk appetite for such lending. Such limits can be stress tested.

Since the 1997 Wallis Inquiry, household leverage has almost doubled. This has been accompanied by a significant increase in house prices relative to income over the past decade. Australian home prices are 50% higher than usual relative to rents, and around 40% higher than usual when compared to incomes. The Bank of International Settlements has already warned that a price correction may be coming.

The Financial System Inquiry is seeking measures to ease the effects of the housing market on the economy along with ways that these measures can be implemented.

Inadequate bank supervision and poorly underwritten home mortgages led to the financial crisis. Easing credit constraints, delivering innovative products (along with fee generating activities) without considering the associated risks, and a lack of internal and external monitoring and supervision, can increase non-performing loans and threaten the financial system and its stability.

Is P2P Lending Becoming Banks Outsourcing Their Loan Process…and Risk?

From The Conversation (UK)

By bringing together savers and borrowers directly, peer-to-peer lending, or P2P for short, bypasses the banks. The cumulative total of loans is forecast to reach £2.5 billion in the UK this year, according to the trade body, Peer2Peer Finance Association. Although these totals are as yet still a tiny proportion of the UK’s £170 billion consumer credit market, this could change fast.

Its credentials as a game-changing industry prompted the Bank of England’s Andrew Haldane to suggest: “The banking middle men may in time become the surplus links in the chain.” However, following news that the giant investment bank Goldman Sachs may be poised to back peer-to-peer lender, Aztec Money, it is clear that the very nature of P2P lending is changing. Banks and other big institutions are quietly recasting themselves as new links in the chain.

Banks are themselves becoming major lenders on some P2P platforms. For example, Forbes estimates that in the US, 80-90% of the capital lent through the two largest P2P lenders, Prosper and LendingClub, is now institutional money.

This means that when you take out a P2P loan, you are now less likely to be borrowing from individuals who often combine a social approach to lending with their desire for investment returns. As an investor, you might find it harder to compete for the best value loans.

Some banks and big institutions are buying up bundles of loans originated on P2P platforms, in some cases repackaging them and selling them on as asset-backed securities. Those with all but the sketchiest memories will immediately recall the way US mortgages were repackaged and traded prior to the 2007 global financial crisis.

What Happens After QE?

Interesting comments from FitchRatings in their Global Perspective series.

There has long been a sense of finality about quantitative easing (QE): when policy interest rates are at or near zero, it seems the last option available to central banks in countering deflation. But this ignores other monetary and exchange rate policies implemented in the past, those recently considered implausible but being deployed at present, and additional creative ideas that may – by necessity and where possible – receive more widespread use in the future.

Ultimately, central banks control the quantity of money (narrowly defined) and exert influence over its price (the interest rate). With this in mind, it is logical to conclude that once the price of money is at its minimum, and further accommodation is desirable, central banks are left with only the quantity of money to consider. However, there are a few other policy options, although they would be likely to prove contentious and subject to questions about their effectiveness.

In the Past: Exchange Rate Interventions

Another way to express the price of money that central banks, including those in advanced economies, have at times tried to influence is the price of foreign currency, the exchange rate.

In September 1985 finance ministers and central bank governors of France, Germany, Japan, the UK and US announced in the Plaza Accord that “exchange rates should play a role in adjusting external imbalances” and that “an orderly appreciation of the main non-dollar currencies against the dollar is desirable”. This was directed primarily at the Japanese yen/US dollar exchange rate, to reduce the US-Japan trade imbalance and the broader US current account deficit. A year later the US dollar had depreciated by 35% against the yen (see chart), and two years later US inflation was more than 4%, where it remained until mid-1991.

There are two common objections to exchange rate intervention. First, it is a zero-sum game: one country’s beneficial depreciation is at the expense of others’ appreciations. Second, intervention is ineffective in the longer term when market forces take hold.

One counter to these objections is that they are inconsistent with each other, at least over time. More importantly, policymakers may eventually conclude that it is not a zero-sum game if countries in deflation represent a broader global risk to growth. And, as with QE, doubts about the effectiveness of currency intervention may be shelved when other policy options appear to have been exhausted and policymakers need to be seen to be taking all necessary steps.

In the Present: Doing the “Unthinkable”

It seems sensible that nominal interest rates have a zero lower bound, as investors would be unlikely to buy assets that, if held to maturity, deliver a nominal loss. It also seems sensible that central banks would want to avoid pushing policy rates below zero. They have long argued that the proper functioning of financial markets would be impaired by negative nominal rates.

Nevertheless, the zero lower bound has been breached by both policymakers and the market. At end-March, the Swedish central bank repo rate, the Swiss central bank three-month LIBOR (Swiss franc) target range, and the Danish central bank certificate of deposit rate were below zero. A number of European government bond yields were also negative.

At least some objections to breaching the zero lower bound on policy interest rates have clearly been set aside, and – assuming deflationary conditions warrant it – the rationale for doing so may become more appealing. From a central bank perspective, two risks associated with negative yields are that they encourage a greater reliance on cash, taking funds outside the financial system, and there could be a run-up in credit, portending asset bubbles and financial instability.

A shift towards large-scale cash holdings in advanced economies appears improbable, if for no reason other than it being impractical. Asset price bubbles and future financial instability may present a bigger problem, but the calculus of central banks could change. If faced with the choice of immediate, intractable deflation and potential financial instability, policymakers may opt to first address the more pressing challenge.

The Future: Policy Creativity

Negative interest rates and a return of more active exchange rate policies might not be the only options to consider. The government and Nationalbank of Denmark have developed another strategy to provide additional monetary accommodation. The government is issuing no bonds until further notice, and will draw on its deposits at the central bank as needed, effectively adding to base money. This may not be an option for many countries (Danish government deposits at the Natioanlbank were large), but it underscores the potential for policy creativity.


Job Vacancies Up, But Rotating

The ABS released their data to February 2015 today. Total job vacancies in February 2015 were 151,600, an increase of 1.1% from November 2014. The number of job vacancies in the private sector was 138,400 in February 2015, an increase of 1.0% from November 2014. The number of job vacancies in the public sector was 13,200 in February 2015, an increase of 2.4% from November 2014. The rolling 12 month average was up 1.5%.

However, of more significant note are the state by state changes. We have calculated the rolling 12 month average, based on the state original data (no seasonal or trend adjustments). We see that whilst the percentage of vacancies rose in VIC (8.6%), TAS (7.1%), NSW (2.8%) and SA (2.7%), they fell in QLD (down 2.1%), WA (down 2.8%) and NT (down 9.3%). Looking back over previous quarters, we see a rotation towards the eastern states, and away from WA and NT. Another data point highlighting the transition underway from the mining states.

JobVacFeb2015

Sydney Dwelling Values Surged 3% Higher in March – CoreLogic RP Data

Home values across the combined capital cities increased by 1.4 per cent in March 2015 according to the CoreLogic RP Data Home Value Index, driven by an exceptionally strong Sydney result where dwelling values were 3.0 per cent higher over the month. The latest indices reading shows capital city dwelling values moved 3.0 per cent higher over the first quarter of the year. CoreLogic RP Data head of research Tim Lawless said, “although value growth has started 2015 on a strong note, the annual rate of growth has moderated back to 7.4 per cent, which is
the slowest annual growth rate since September 2013.”

Sydney remains the standout capital growth performer, with values rising by 3.0 per cent over the month, 5.8 per cent over the quarter and 13.9 per cent over the year. With stronger housing market conditions over the first three months of the year, annual home value growth across the Sydney market has rebounded after slowing to 12.4 per cent in December 2014. Sydney is the only housing market where dwelling value growth remains in double digits, with the next strongest performer, Melbourne, showing a much lower rate of annual capital gain at just 5.6 per cent.

RPDataFeb2015Each of the remaining capital cities have recorded an annual rate of growth which is less than three per cent, with values having declined across Perth, Darwin and Hobart over the year. Since home values began their current growth phase in June 2012, dwelling values across the combined capital cities have increased by 24.3 per cent. “Most of this growth is emanating from Sydney,” Mr Lawless said. “Over the current growth phase, Sydney dwelling values have increased by 38.8 per cent with Melbourne second strongest at 23.6 per cent. On the other hand, total dwelling value growth over the current cycle has been less than 10 per cent in Adelaide, Hobart and Canberra. “Combined capital city home values have increased by 3.0 per cent over the first quarter of 2015. While that rate of growth is strong it is important to note that it is lower than the 3.5 per cent increase in home values over the first quarter of 2014,” he said.

Based on the March results, Sydney’s growth trend appears to have disengaged from the rest of the capital city housing markets in terms of demand and subsequently in terms of value growth. The 5.8 per cent growth in Sydney dwelling values over the first quarter is the strongest quarterly growth rate since home values increased by 6.2 per cent over the three months to April 2009. The strength of the Sydney housing market currently is further highlighted by the fact that since the Reserve Bank cut official interest rates to 2.25 per cent at the beginning of February, auction clearance rates have been above 80 per cent each week.

Building Approvals Up In February, Thanks To NSW

Australian Bureau of Statistics (ABS) Building Approvals show that the number of dwellings approved rose 1.6 per cent in February 2015, in trend terms, and has risen for nine months.

Dwelling approvals increased in February in New South Wales (5.4 per cent), Queensland (2.1 per cent) and Victoria (1.3 per cent) but decreased in Australian Capital Territory (16.2 per cent), Northern Territory (2.7 per cent), Western Australia (2.5 per cent), South Australia (2.4 per cent) and Tasmania (0.7 per cent) in trend terms.

In trend terms, approvals for private sector houses was flat in February. Private sector houses rose in New South Wales (1.8 per cent) and Victoria (0.7 per cent) but fell in South Australia (1.5 per cent), Western Australia (1.4 per cent) and Queensland (0.9 per cent).

The value of total building approved rose 1.0 per cent in February, in trend terms, and has risen for eight months. The value of residential building rose 2.1 per cent while non-residential building fell 1.4 per cent in trend terms.