Does Easing Monetary Policy Increase Financial Instability?

An IMF working paper “Does Easing Monetary Policy Increase Financial Instability?” looks at the interaction between monetary and macro-prudential policies.

Using modelling, they show that that real interest rate rigidities have a different impact on financial stability depending on the sign of the shock hitting the economy. In response to positive shocks to the risk-free interest rate, real interest rate rigidity acts as an automatic macro-prudential stabilizer. This is because higher debt today associated with lower interest rates (relative to the flexible interest rate case) is offset by lower interest repayments, resulting in higher net worth and lower probability of a crisis in the future. In contrast, when the risk-free rate is hit by a negative shock, real interest rate rigidity leads to a relatively higher crisis probability through the same mechanisms working in reverse (borrowing and consumption are relatively lower today, but they are offset by relatively higher debt service tomorrow, resulting in lower future net-worth and higher crisis probability).

In addition, they show that when the interest rate is the only policy instrument to address both the macroeconomic and the financial friction, and a shock that lowers interest rates hits the economy, a policy trade-off emerges. This is because the two frictions require interventions of opposite direction on the same instrument. Other instruments, however, may be at the policy-maker’s disposal in order to achieve and maintain financial stability.

An implication of their analysis is that the weak link in the U.S. policy framework in the run up to the Global Recession was not excessively lax monetary policy after 2002, but rather the absence of an effective regulatory framework aimed at preserving financial stability.

Note that IMF Working Papers describe research in progress by the author(s) and are published to elicit comments and to encourage debate. The views expressed in IMF Working Papers are those of the author(s) and do not necessarily represent the views of the IMF, its Executive Board, or IMF management.


Affordable housing crisis is hurting all of us (except the well-heeled)

From The Conversation. Until recently, affordable housing was mentioned only in conversations involving low-wage or unemployed workers – or the homeless. The only groups that focused on rising rental costs were low-income housing advocacy groups.

That has now changed.

For the first time since possibly the Great Depression, the lack of affordable housing is being viewed as a crisis that affects Americans of all ages, races and income groups.

While the US Supreme Court spotlighted the issue in Thursday’s ruling allowing parties to challenge housing practices even if they do not (or cannot) prove there was intentional bias or discrimination, the mainstream media is finally catching on as well.

In the last three weeks, the Washington Post, New York Times and Wall Street Journal have all sounded the alarm about the country’s looming affordable housing crisis. In addition, well-heeled non-profit groups – like the foundation recently formed by the former CEO of the nation’s largest apartment developer – have begun urging politicians to address the growing problem of rental housing unaffordability.

Growing more somber

Some of the recent media attention on the unaffordability of housing was triggered by the 2015 State of the Nation’s Housing report, just released by the Harvard Joint Center for Housing Studies (JCHS). While the JCHS has issued a similar report every year since 1988, the latest edition opens with an unusually somber tone about the state of housing in this country.

“Homeownership at 20-Year Lows,” bellows the opening line of the 2015 report.

By comparison, the first line in 2013 highlighted the “Housing Market Revival,” while the 2014 report only hinted at the growing problems with “Single-Family Slowdown.”

This change in tone was very slow in coming. The 2013 report optimistically reported that “the long-awaited housing recovery finally took hold in 2012.” The 2014 report, while less rose-tinted, still noted that “the housing market gained steam in early 2013.”

The 2015 report strikes a decidedly different and more alarmist tone by emphasizing that the housing recovery “lost momentum” as homeownership rates continued to fall. This report then chronicles the increase in the number of renters who are “cost-burdened” and cannot find affordable housing and the number of minority neighborhoods that still have not recovered from the recession.

Who’s struggling

While news sources have intermittently reported on housing affordability issues since the recession, what is new about the current affordable housing reports is who is struggling to find affordable housing. It’s no longer just millennials or the poor or homeless people.

Prior accounts have described the low homeownership rates of cash-starved millennials who live with their parents because of high student loan debt and low-wage jobs.

The recent New York Times article discusses former homeowners who are now forced to rent because they lost their homes to foreclosure and cannot qualify for a mortgage loan because of blemished credit. Likewise, the Washington Post article discusses middle- and even upper-income renters and the fact that many parents of millennials are now struggling to find affordable housing.

The JCHS report explains that homeownership rates for Americans aged 35 to 44 have now dropped to levels not seen since the 1960s. In describing the housing affordability crisis for renters, the report shows that from 2004 to 2014, older Americans (aged 45 to 64) became renters at greater rates than millennials households under the age of 35.

Today’s rental crisis

Housing affordability is no longer limited to the lowest-paid workers. The JCHS report stresses that renters whose earnings place them in the highest-income quartile now account for more than 20% of new renters.

Renters are no longer the low-income, working-class Americans typically featured in news reports. Today’s rental crisis is now affecting just about everyone but the really rich.

The Wall Street Journal article assumes that policymakers are either blissfully unaware of the affordable housing crisis, or they are unwilling to do anything about it.

Politicians have not been willing to make changes to popular housing laws or policies that benefit upper-income homeowners, like the mortgage interest deduction. And they haven’t been willing to provide additional relief to lower-income renters by, for example, expanding the low income tax credit.

Politicians may be unwilling to do anything to solve the affordable housing crisis. But, after these recent reports, they can no longer say they don’t know the crisis exists.

Author: Mechele Dickerson, Professor of Law at University of Texas at Austin

The State of the Internet – Australia Slips Further Behind

Akamai’s [state of the internet] Q1 2015 report records that globally the number of Internet users has more than doubled to an estimated 3.2 billion in 2015 and the number of Internet-connected devices will outnumber the human connected population three times by 2019. In parallel with Internet usage, Internet connection speeds have improved as well. In the US, the FCC updated the broadband definition from a benchmark of 4 Mbps to 25 Mbps for downloads. Looking at connection speeds, the global average connection speed increased 10% quarter over quarter, to 5.0 Mbps, while the global average peak connection speed grew 8.2% to 29.1 Mbps.

Turning to mobile connectivity, In the first quarter, average mobile connection speeds (aggregated at a country/region level) ranged from a high of 20.4 Mbps in the United Kingdom — a 27% increase over the fourth quarter — to a low of 1.3 Mbps in Vietnam. Average peak mobile connection speeds ranged from 149.3 Mbps in Australia to 8.2 Mbps in Indonesia. Apple Mobile Safari accounted for roughly 35% of requests, down slightly from 36% in the fourth quarter, while Android Webkit and Chrome for mobile (the two primary Android browser bases) accounted for 23% and 16% of requests, respectively — giving a total of 39% for the Android platform.

Delving into the Australian landscape, it is clear we are still hampered by the recent political ructions regarding the NBN, and consequential uncertainty which has slowed commercial investment. The report suggests that more countries are migrating to a  fiber to the premises model, whilst we are backpedaling to a multi-technology solution. We are being overtaken. Demand will continue to rise as VOD services such as Netflix become mainstream.

Looking at fixed line broadband connectivity, the report says at 71% of all broadband connections were above the benchmark 4bps, and this reflected a 4.1 % increase on last quarter, and a 29% lift from last year. We are now sitting at 50th globally in terms of broadband connectivity (defined as above 4Mbps). This is a drop of six places in the last quarter. We are marching more slowly than others. Turning to high speed broadband, Australia came in 44th on the global ranking, slipping three notches from last quarter at 17%. That said, there was a lift in connections above 10 Mbps by 8.8% quarter-on-quarter, and 60% year-on-year.

INternet-UseThe truth is that the future of broadband is more linked to mobile than ever. The report highlighted that Australia achieved the highest average peak mobile connection speeds globally in Q1 2015 at 149.3 Mbps. In addition, whilst Denmark led the field with 98% mobile internet penetration, Australia recorded the highest mobile broadband take-up rates in the Asia Pacific region at 96%. Maybe we do not need the NBN at all?

Households Necks In The Debt Noose

The ABS data released yesterday, highlights that overall household debt is sky high, much of it linked to mortgage borrowing. Whilst household net worth is over $8 trillion, its mainly thanks to house price inflation (and stock market holdings inflated by ultra low interest rates and QE). The RBA data tells the story. Using their data, (E2 HOUSEHOLD FINANCES – SELECTED RATIOS) we see that the ratio of housing debt to income is rising, in fact both the ratio covering owner occupied housing, and that covering both owner occupied housing and investment housing has risen significantly.

Household-Debt-Ratio-1Of course, interest rates are low, so the ratio of interest payments to income are lower than when interest rates were at their peak in 2008. So the common assumption is that whilst debt is high, households can service it, and those with higher incomes have the greatest debt exposure.

Household-Debt-Ratio-2 In addition, banks are now “required” by APRA to use an interest rate of 7% when considering a loan application, higher than the common practice of a number of banks. APRA highlighted recently the range of rates banks were using for serviceability testing.

Chart 4: Existing mortgage debt shows interest rate used in investor serviceability assessment between 4%-9%

Some banks were underwriting loans with a very small serviceability buffer, so will have loans on book at greater risk, but at the moment serviceability is not required to be marked to market on an ongoing basis (though that may change under Basel IV).

This takes us to mortgage stress. Now, DFA has been tracking mortgage stress for year. Low interest rates have got many out of difficulty.

Mortgage stress is a poorly defined term. The RBA tends to equate stress with defaults (which remain at low levels on an international basis). A wider definition is 30% of income going on mortgage repayments (not consistently pre-or post tax). This stems from the guidelines of affordability some banks used in 1980’s and 1990’s, when economic conditions were different from today. This is a blunt instrument. DFA does not think there is a good indicator of mortgage stress, so we use a series of questions to diagnose mortgage stress focusing on owner occupied households. Through these questions we identify two levels of stress – Mild and Severe.

  • Mild = households maintaining repayments, but by reprioritising expenditure, borrowing more on loans or cards, and refinancing
  • Severe = households who are behind with their repayments, or are trying to sell, or are trying to refinance, or who are being foreclosed

In our latest data on stress we have noted some concerning trends. Despite the ultra-low interest rates, the proportion of households in some degree of mortgage stress is rising. This is because incomes are static, household expenses are rising and the average mortgage is larger, especially in some centres like Sydney. So if we look at segmented data we see that for some borrowing households, as many as 10% are registering in the severe category, and many more in the mild category. Many are just, and only just keeping their heads above water. Larger loans means they are more leveraged.

Stress-June-2015If we look at the severe stress by segment, by when the loan was last drawn down, we see significant peaks in more recent years (when loans were larger) than older loans. Typically in in years 2 and 3 of a loans life that stress is highest.

Loan-Age-and-StressNow consider this. Assuming an average $350,000 mortgage over 30 years, if rates were to rise 1%, the average monthly costs for a p&i loan would rise by $220 and for an interest only loan $291. Such a rise would likely lift the proportion of households with mortgage stress from 35% of all borrowing households to close to 50% in our modelling.  Interest only loans are more sensitive to rises.

We conclude that many households are a hair’s breadth away from difficulty. Another way of asking a similar question is how much free cash is available at the end of the month. For many households with large mortgages and average incomes, the short answer is nothing. No flex. No safety net.  Whilst in the early 2000’s incomes were rising fast there is not easy exit this time. Many households are in the debt noose. Let’s hope no-one pulls the rope.

Repayment-Table

Supervisory Stress Testing of Large Systemic Financial Institutions – The Fed

Interesting speech by Fed Vice Chairman Fischer on supervisory stress testing of large systemic financial institutions.

Stress testing has become a cornerstone of a new approach to regulation and supervision of the largest financial institutions in the United States. The Federal Reserve’s first supervisory stress test was the Supervisory Capital Assessment Program, known as the SCAP. Conducted in 2009 during the depths of the financial crisis, the SCAP marked the first time the U.S. bank regulatory agencies had conducted a supervisory stress test simultaneously across the largest banking firms. The results clearly demonstrated the value of simultaneous, forward-looking supervisory assessments of capital adequacy under stressed conditions. The SCAP was also a key contributor to the relatively rapid restoration of the financial health of the U.S. banking system.

The Fed’s approach to stress testing of the largest and most systemic financial institutions has evolved since the SCAP, but several key elements persist to this day. These elements include, first, supervisory stress scenarios applicable to all firms; second, defined consequences for firms deemed to be insufficiently capitalized; and third, public disclosure of the results.

The Fed has subsequently conducted five stress test exercises that built on the success of SCAP, while making some important improvements to the stress test processes. The first key innovation was the development of supervisory models and processes that allow the Fed to evaluate independently whether banks are sufficiently resilient to continue to lend to consumers and to businesses under adverse economic and financial conditions. This innovation took place over the course of several exercises and was made possible by the extensive collection of data from the banks. These data have allowed supervisors to build models that are more sensitive to stress scenarios and better define the riskiness of the firms’ different businesses and exposures.

The second innovation since the SCAP was the use of the supervisory stress test as a key input into the annual supervisory evaluation of capital adequacy at the largest bank holding companies. The crisis demonstrated the importance of forward-looking supervision that accounted for the possibility of negative outcomes. By focusing on forward-looking post-stress capital ratios, stress testing provides an assessment of a firm’s capital adequacy that is complementary to regulatory capital ratios, which reflect the firm’s performance to date. Although we view this new approach to capital assessment as a significant improvement over previous practices, we are aware that the true test of this new regime will come only if another period of significant financial or economic stress were to materialize–which is to say that we will not have a strong test of the effectiveness of stress testing until the stress tests undergo a real world stress test. The same comment, mutatis mutandis, applies to the overall changes in methods of bank regulation and supervision made since September 15, 2008.

Third, supervisory stress testing has been on the leading edge of a movement toward greater supervisory transparency. Since the SCAP, the Fed has steadily increased the transparency around its stress testing processes, methodologies, and results. Before the crisis, releasing unfavorable supervisory information about particular firms was unthinkable–for fear of setting off runs on banks. However, the release of the SCAP results helped to calm markets during the crisis by reducing uncertainty about firm solvency. Indeed, only one of the 10 firms deemed to have a capital shortfall was unable to close the identified gap on the private markets. Our experience to date has been that transparency around the stress testing exercise improves the credibility of the exercise and creates accountability both for firms and supervisors. That said, too much transparency can also have potentially negative consequences, an idea to which I will turn shortly.

With the benefit of five years of experience, the Fed is continuing to assess its stress testing program, and to make appropriate changes. Examples of such changes to date include the assumption of default by each firm’s largest counterparty and the assumption that firms would not curtail lending to consumers and businesses, even under severely adverse conditions. As part of that assessment process, we are also currently seeking feedback from the industry, market analysts, and academics about the program.

Supervisory stress testing is not a static exercise and must adapt to a changing economic and financial environment and must incorporate innovations in modeling technology. Work is currently underway on adapting the stress testing framework to accommodate firms that have not traditionally been subject to these tests. The Dodd-Frank Act requires the Fed to conduct stress tests on non-bank financial institutions that have been designated as systemically important by the FSOC–the Financial Stability Oversight Council. Three of the currently designated financial institutions are global insurance companies. While distress at these firms poses risks to financial stability, particularly during a stressful period, certain sources of risk to these firms are distinct from the risks banking organizations face. A key aspect of this ongoing work includes adapting our current stress testing framework and scenarios to ensure that the tests for non-bank SIFIs–systemically important financial institutions–are appropriate.

Another area where work continues–and will likely always continue–is the Fed’s ongoing research aimed at improving our ability to estimate losses and revenues under stress. Supervisors have both to develop new approaches that push the state of the art in stress testing and to respond as new modeling techniques are developed or as firm activities and risk concentrations evolve over time. For example, forecasting how a particular bank’s revenue may respond to a severe macroeconomic recession can be challenging, and we continue to seek ways to enhance our ability to do so.

Supervisory stress testing models and methodologies have to evolve over time in order to better capture salient emerging risks to financial firms and the system as a whole. However, the framework cannot simply be expanded to include more and more aspects of reality. For example, incorporating feedback from financial system distress to the real economy is a complex and difficult modelling challenge. Whether we recognize it or not, the standard solution to a complex modeling challenge is to simplify–typically to the minimum extent possible–aspects of the overall modelling framework. However, incorporating feedback into the stress test framework may require simplifying aspects of the framework to a point where it is less able to capture the risks to individual institutions. Even so, one can imagine substantial gains from continued research on stress testing’s role in macroprudential supervision and our understanding of risks to the financial system, such as knock-on effects, contagion, fire sales, and the interaction between capital and liquidity during a crisis.

Finally, let me close by addressing a question that often arises about the use of a supervisory stress test, such as those conducted by the Fed, with common scenarios and models. Such a test may create the possibility of, in former Chairman Bernanke’s words, a “model monoculture,” in which all models are similar and all miss the same key risks. Such a culture could possibly create vulnerabilities in the financial system. At the Fed we try to address this issue, in part, through appropriate disclosure about the supervisory stress test. We have published information about the overall framework employed in various aspects of the supervisory stress test, but not the full details that banks could use to manage to the test. This–making it easier to game the test–is the potential negative consequence of transparency that I alluded to earlier.

We also value different approaches for designing scenarios and conducting stress tests. In the United States, in addition to supervisory stress testing, large financial firms are required to conduct their own stress tests, using their own models and stress scenarios that capture their unique risks. In evaluating each bank’s capital planning process, supervisors focus on how well banks’ internal scenarios and models capture their unique risks and business models. We expect firms to determine the risks inherent to their businesses, their risk-appetite, and to make business decisions on that basis.

Household Net Worth now over $8 Trillion, but Savings down

The ABS released the latest national accounts, to March 2015. The Household Finance and Wealth data confirms again what we know, overall household net worth is up (thanks to asset appreciation) but savings are down.

At the end of March quarter 2015, household net worth was $8,090.9b, made up predominantly of $5,451.8b of land and dwelling assets and $4,131.0b of financial assets, less $2,121.6b of household liabilities. During the quarter, household net worth increased by $231.5b, driven mainly by holding gains of $207.0b. Financial assets ($129.0b) and land and dwellings ($79.8b) were the drivers of holding gains this quarter, with financial assets seeing the largest quarterly holding gains on record. The large increase in holding gains from financial assets was driven by net equity in reserves ($90.6b) and equities ($36.2b).

The increase of $17.6b in transactions in net worth was driven by $9.7b increase in net capital formation of land and dwellings; and net financial transactions of $7.3b, of which transactions in financial assets were $30.8b and liabilities were $23.5b. The March quarter 2015 transactions in financial assets were driven by $13.8b of transactions in net equity in reserves of pension funds and $11.2b of transactions in deposits. Transactions in liabilities in March quarter 2015 were driven by transactions of $24.3b in long term loan borrowing.

ABS-HousholdsBoth household assets and liabilities continued to grow over March quarter 2015, resulting in 2.9% growth in household net worth. Net worth has continued to grow over the last eight quarters, passing the $8 trillion mark in March quarter 2015.

ABS Household 1
Household financial assets grew faster than both residential land and dwelling assets and liabilities, growing by 4.0% ($159.8b), 1.9% ($96.1b) and 1.4% ($30.2b) respectively. Insurance technical reserves – superannuation, and shares and other equities were the key drivers of growth in financial assets this quarter. Insurance technical reserves – superannuation grew by 4.8% ($104.9b), recording its highest quarterly percentage growth since the June quarter 2012 growth of 8.4% ($131.4b). Shares and other equity grew 5.7% ($37.1b), recording its highest quarterly percentage growth since the March quarter 2013 growth of 6.1% ($32.4b).

The financial ratios graphs presented here are derived from the household balance sheet, financial account and income account. The interest payable to income ratio represents the proportion of household gross disposable income that is required to meet interest payments. Interest payable in the graph is the “adjusted interest payable”. It includes the financial intermediation services indirectly measured (FISIM) on the dwelling loan plus the dwelling interest payable from the household income account. It therefore represents the total nominal amounts paid as interest by the household sector. The interest payable to income ratio is relatively volatile in the short term, however some long term trends may be observed. After a period of volatility during the Global Financial Crisis, the ratio stabilised from March 2010 onwards, settling into a gradual downward trend. The ratio at March quarter 2015 was 11.1%, an increase of 0.6p.p from the December quarter ratio of 10.5%.

ABS Household 2The mortgage debt to residential land and dwellings ratio shows the extent that household residential real estate assets are geared. The ratio has declined since peaking at 30.6% in September quarter 2012, but has remained unchanged since December 2014 at 29.2%, indicating that household mortgage debt grew at the same rate as residential real estate owned by the household sector for the past two quarters.

The debt to assets ratio gives an indication of the extent that the overall household balance sheet is geared. That is the degree to which assets are dependent on debt. At 31 March 2015, household debt was equal to 20.8% of assets, dropping below 21% for the first time since December quarter 2010.

The debt to liquid assets ratio reflects the ability of the household sector to extinguish debts in a short period of time using their readily available, or liquid, assets. The following are classified as liquid assets: currency and deposits, short and long term debt securities, and equities. The ratio of household debt to liquid assets fell from 134.1% at 31 December 2014 to 131.8% per cent at 31 March 2015, the third consecutive quarter of decline and the lowest ratio since September quarter 2008.

ABS Household 3Household net saving was $16.4b for the quarter, decreasing from $22.8b in the December quarter. Despite the decrease in net saving, household net worth increased by $231.5b to $8,090.9b in March quarter 2015. With the inclusion of real net wealth effects, net saving increased to $215.9b for the quarter. The largest driver of the increase in other changes in real net wealth was real holding gains, which made up $192.2b of the $199.6b increase. Real holding gains for financial assets was $121.4b, which overtook land and dwellings as the biggest driver of real holding gains this quarter, and is the highest recorded holding gain for financial assets in the series.

ABS Household 4

RBNZ Updates On Basel III

The NZ Reserve Bank today published an article in the Reserve Bank Bulletin that describes the Reserve Bank’s implementation of the Basel III capital requirements. It is one of the clearest articulation of Basel III that we have read, and is recommended to those seeking to get to grips with the complexity of the evolving capital requirements. In addition, you can read our article on Basel IV (the next iteration) here.

The GFC highlighted several shortcomings in the policies and practices of some financial institutions, particularly in North America and Europe, and in the regulatory requirements for banks in respect of capital. In the lead-up to the GFC, some financial institutions were highly leveraged (that is, their assets were funded by high levels of debt as compared to equity), with capital that proved insufficient to absorb the losses that they incurred. In several countries, governments provided funds to support failing banks, effectively protecting holders of certain capital instruments from bearing losses, which came at a cost to taxpayers. The complexity of capital rules, interaction with national accounting standards, and differences in application resulted in inconsistencies in the definition of regulatory capital across jurisdictions. Further, insufficient capital was held in respect of certain risks. This made it difficult for the market to assess the true quality of banks’ regulatory capital and led some market participants to turn to simpler solvency assessment methods.

The BCBS responded with new requirements for bank capital, collectively known as Basel III, which built on the existing frameworks of Basel I and Basel II. Basel III strengthens the minimum standards for the quality and quantity of banks’ capital, and aims to reduce bank leverage and improve the risk coverage of the Basel Capital Accords. One of the purposes of Basel III is to make it more likely that banks have sufficient capital to absorb the losses they might incur, thus reducing the likelihood that a bank will fail, or that a government will be called on to use taxpayer funds to bail out a bank. Basel III also introduced an international standard on bank liquidity. Overall, these requirements increase resilience in the financial sector and reduce the probability of future systemic collapses of the financial sector.

The RBNZ Bulletin article explains the rationale behind the Basel III capital requirements, identifies and discusses their significant features, explains how the Reserve Bank has applied the requirements in New Zealand, and examines the development of the New Zealand market for instruments meeting the Basel III definition of capital.

The changes to the Capital Accord brought into effect by Basel III included: enhancing the requirements for the quality of the capital base;increasing the minimum amount of capital required to be held against risk exposures; requiring capital buffers to be built up in good times that can be drawn down in times of economic stress; introducing a leverage ratio requirement; and enhancing the risk coverage of the capital framework. Draft international minimum standards for liquidity were also proposed for the first time as part of the Basel III package. The liquidity requirements are not discussed in this article. The Basel III capital standards have been widely adopted worldwide. The Reserve Bank has largely adopted the Basel III capital requirements. As New Zealand banks were well capitalised at the time Basel III was issued, the Reserve Bank was able to put the Basel III capital requirements in place in New Zealand ahead of the timetable set by the BCBS for Basel III implementation.


When monetary policy reaches its limits, what of fiscal policy?

From The Conversation. In a recent address to the Economic Society of Australia, the Reserve Bank Governor Glenn Stevens hit the nail on the head when he remarked that “monetary policy alone can’t deliver everything we need and expecting too much from it can lead, in time, to much bigger problems”.

What was particularly important in this address was the (implicit) suggestion that the answer goes hand in hand with another question; what should we expect from fiscal policy?

Though at first sight it might appear to be a rather tenuous link, a decent review of the taxation system and more generally of the revenue side of the fiscal equation, may be a big help in taking some of the burden off monetary policy from its current constraints.

Stevens is not alone in suggesting that too much might be being expected of central bankers in promoting growth and reducing unemployment. Similar sentiments have come from former Federal Reserve Chairman, Ben Bernanke.

It is useful to distinguish two aspects to the question of whether we expect too much of monetary policy. The first is whether we can expect it to work when the economy is on the downswing in the same degree as when it is on the upswing. In particular, can we expect an easing of monetary policy to stimulate growth as effectively as a tightening of monetary policy can choke it off.

Central banks for the most part have a brief of keeping inflation within a certain range and, with that done, to assist in keeping the economy’s growth rate near to trend; in the best of worlds, consistent with full employment.

Expectations about what more accommodating monetary policy can do for a sluggish economy have at times had to take a reality check here and in other parts of the world. Bringing interest rates down and making the assets side of bank balance sheets more liquid via “quantitative easing” can stimulate the real economy only to the extent that the binding constraint on spending by consumers and business is a financial one.

But in an environment where producers expect sluggish or even falling domestic or export demand, one would also expect to see sluggish investment demand, regardless of interest rates or the willingness of banks to lend. In other words, slow growth in demand may well mean expected rates of return from investment in new plant are revised down as much as interest rates.

As Stevens noted in his address, lower interest rates may not help consumption expenditure much either in present circumstances, since household sector’s debt burden means that it “has the least scope [compared with government and corporations] to expand their balance sheets to drive spending”.

And, as plenty of commentators have noted, injections of liquidity and easing credit conditions may be channelled into financial assets which don’t have significant stimulatory effects on the real side of the economy, which is where we need it for growth and reduced unemployment.

Some have even argued that a lengthy period of easy monetary policy has adverse distributional effects benefiting owners of stock and property. However the precise distributional effects of seem rather complex and less than clear cut, and will depend in part on whether or not accommodatory monetary policy stimulates the economy and hence employment growth.

The second and perhaps broader aspect related to expectations about what monetary policy can and should do is that it is often asked to effectively make use of a limited toolbox to deal with conflicting objectives. One could be forgiven for thinking that in this country we have only one macro policy instrument – interest rates – to both control inflation and manipulate growth in economic activity.

The obvious elephant in the room here is fiscal policy.

In his address Stevens actually raises an old and interesting idea about fiscal policy: that it can have a stimulatory role perfectly consistent with “sound financing” (to borrow a perverted phrase with which Keynes’ was forced to do battle); where stimulatory expenditure and any increased debt are on the capital or investment side of the budget.

Such fiscal stimulus may even have what some economists refer to as a “crowding-in” effect: a positive impact on expectations about growth, as Stevens notes. This idea also provides a bulwark against the nonsense about fiscal contraction or consolidation (as it’s euphemistically called) being necessary to stimulate the economy.

The caution here from the Governor is also sound it seems; that capital expenditure is not overnight, so the confidence boost is probably more important for the short-term than the actual direct impact on government expenditure.

In any case, if fiscal policy in general and government expenditure in particular is to come back into its own as a macro policy instrument, reform of the revenue base and thus the tax system is paramount.

But note here, a significant driver of tax reform should be the sustainable funding of an expenditure side which fulfils its macro economic role as a generator of demand growth and its social role in generating infrastructure.

Tax reform should not be seen exclusively as code for a lower taxes, this being an end, the means to which to point of is government withdrawing from its expenditure responsibilities. Unfortunately, this latter view seems to dominate much discussion in this country.

From a macro policy standpoint, looking at tax or more appropriately at the revenue side of the fiscal equation may well have a positive spin-off for monetary policy, leaving it to focus, if that is the continued wish of the political masters, on inflation.

And if one is worried about complex adverse distributional effects of monetary policy, expenditure on infrastructure, done properly, would surely help redress inequality by lifting the social wage.

Author: Graham White, Associate Professor, School of Economics at University of Sydney

Australians Flock To Netflix

Data from Roy Morgan Research shows that within two months of its local launch, over a million Australians across 400,000 households had signed up to Netflix, the latest Streaming Video On Demand (SVOD).

Netflix launched in Australia on March 24, although some estimates say over 200,000 of us may have previously signed up to the service, using geo-blocks to stream US or UK content. Officially, in April, 766,000 Australians in 296,000 homes were subscribed. By May, this had grown to 1,039,000 in 408,000 households.

The $40 billion US giant has clearly taken an early—and perhaps insurmountable—lead in the new world of on-demand subscription television in Australia, securing over ten times more subscriptions than its nearest (and locally owned) competitors.

By May, just 97,000 Australians were subscribed to Presto, from Foxtel and Seven West Media; 91,000 had Stan, which Nine Entertainment and Fairfax Media launched in January; 43,000 had Quickflix, the long-established ASX-listed former DVD-delivery service (just like Netflix once was); and 40,000 had Foxtel Play, the streaming version of its Pay TV.

Number of Australians in May 2015 with streaming TV subscription service

Source: Roy Morgan Single Source, May 2015 n = 2,088 Australians 14+

The question is will the numbers flatten or decline as the introductory free trials end—or really rocket up now the latest season of Game of Thrones has finished on Foxtel? On the other hand the anti-piracy legislation now passed by the Government may just accelerate the rate of take-up.

IMF Warning To Australia – Ambitious Reform Needed

The IMF released their Concluding Statement of the 2015 Article IV Mission today.

Australians have enjoyed exceptionally strong income growth for the last couple of decades. But the waning of the resource investment boom and the recent sharp fall in the terms of trade have brought this to a halt. Incomes should start rising again as the terms of trade stabilize, but likely more slowly than in the past. Improving this outlook requires policymakers being on the front foot to enable Australia to make the most of its considerable potential. This means supporting aggregate demand in the shorter term and boosting productivity in the longer term. And ensuring banks are unquestionably strong would reduce vulnerabilities. Such an ambitious reform agenda would require strong and sustained commitment.

Outperformance fading

Australia has grown almost twice as fast as its peers in the last two decades. This reflected both strong policy frameworks (such as the floating exchange rate and flexible labor market) and the boom in global demand for its resources. But output growth has been below trend for two years, unemployment has risen to six percent, and real incomes have declined. While moving from the investment to the production phase of the resource boom was always going to be bumpy and the economy is handling this transition relatively well, the recent sharp fall in resource prices has made it more difficult.

Weaker medium-term growth prospects

Over the next couple of years, activity should gradually pick up and narrow the output gap, supported by strong resource exports, accommodative monetary policy, and rising confidence. But over the medium term and without reform, growth is likely to converge to a slower potential rate, reflecting less capital accumulation and only modest productivity growth. This lower potential would still mean income growth in line with other advanced countries, but significantly slower than Australians have been used to over the last two decades. Slower growth would also make fiscal consolidation more difficult. The risks around this outlook seem somewhat skewed to the downside, in particular:

• On the downside, the envisaged pick up in non-resource business investment may remain elusive, a house price correction could knock confidence and demand, and China could slow more sharply.

• On the upside, domestic demand could respond more quickly to recent monetary policy stimulus, and the exchange rate could depreciate further, stimulating the tradable sector.

Policies to re-energize growth

This weaker outlook can be avoided. Australia has strong institutions, a flexible economy, and is well placed to seize opportunities created by Asia’s rapid growth and rising middle class, helped by the recent free trade agreements. Policymakers should build on these strengths by re-invigorating the reform agenda:

• Sustaining demand through the resource boom transition

• Lifting productivity to sustain strong income growth

• Building resilience to reduce the risk of financial disruption

Sustaining demand though the resource boom transition

Keeping monetary policy accommodative

A sizeable output gap, elevated unemployment, subdued inflation pressure, and an exchange rate still on the strong side, call for supportive aggregate demand policies. While monetary policy is already accommodative and may have lost some effectiveness, it should still stand ready to ease further should the recovery fall short of expectations and provided the financial stability risks remain contained.

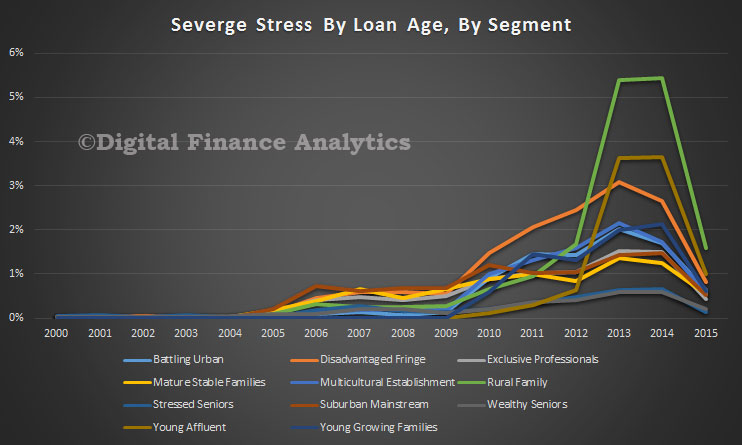
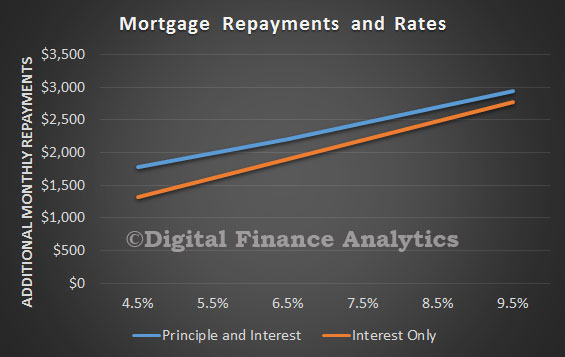
Prudential policy to address housing risks

APRA has appropriately been taking targeted and gradual action to address areas of risk in the housing market for some time. Banks, however, seem only to have responded more recently and the results are yet to be fully reflected in the lending data. We expect APRA’s approach to succeed, but it may need to be intensified, for example, if investor lending and house price growth do not slow appreciably in the second half of the year. Such intensification could include requiring banks with fast-growing investor lending to hold more capital, raising risk weights on investor lending, and restricting the duration of interest-only loans.

Boosting public investment

A small surplus should remain a medium-term anchor of fiscal policy and budget discipline should be maintained. But the planned pace of consolidation nationally (Commonwealth and States combined) towards this medium-term objective is somewhat more frontloaded than desirable given the weakness of the economy, the size and uncertainty around the resource boom transition, and the possible limits to monetary policy. Increasing public investment (financed by more borrowing rather than offsetting measures) would support aggregate demand and ensure against downside risks. It would also employ resources released by the mining sector, catalyze private investment, boost productivity, take advantage of record-low borrowing rates, and maintain the government’s net worth. Indeed, IMF research suggests that economies like Australia—with an output gap, accommodative monetary policy, and fiscal space—benefit most from debt-financed infrastructure investment, with the growth boost largely containing the impact on the (low) debt-to-GDP ratio.

Commonwealth-State coordination critical

Boosting public investment, especially in the short term given inherent lags, and without waste and compromising governance, will be difficult, not least as most investment is carried out by States whereas the Commonwealth has the most borrowing capacity. The Commonwealth is already doing much to encourage investment with recent initiatives, including co-financing. However, public investment has been a drag on growth in recent quarters and the outlook is not for a sharp pick-up. A strategy for boosting public investment could include:

• Broadening the scope of investments supported by the Commonwealth, for example, to include a wider range of projects, including repairs and maintenance.

• Continuing to establish a pipeline of quality larger projects with transparent cost-benefit analysis, such as that being prepared by Infrastructure Australia. Broad political support for such a pipeline would reduce uncertainty and boost confidence.

• In addition to direct funding arrangements, the Commonwealth could consider guaranteeing States’ borrowing for additional investment—this would keep the accountability with the States, but reduce their concerns about credit ratings and would not affect the Commonwealth’s deficit.

Maintaining budget discipline

While the capital budget should expand, the recurrent budget should not. The government should maintain its envisaged structural consolidation of the recurrent budget. Any slippage would reduce the government’s net worth and could undermine the credibility of the medium-term surplus objective, which continues to serve the country well. Indeed, we see risks that the envisaged consolidation of the recurrent budget will not be achieved (given the tight spending targets, strong revenue projections, and with some measures still unapproved), which may well require additional measures.

Lifting productivity to sustain strong income growth

No silver bullet, but many targets

Maintaining income growth at past rates requires raising total factor productivity growth substantially. This will be challenging as Australia has already undertaken comprehensive productivity-boosting reforms in the 1980-early 2000s and a number of sectors are at, or near, the global productivity frontier. But other sectors have gaps, and these provide an opportunity to catch up—the distribution (including retail, wholesale, and transport) sector suggests most scope. The Competition Policy Review recommended many reforms to strengthen competition and improve efficiency, including in human services and the retail sectors. Filling infrastructure gaps would relieve bottlenecks, as would reducing the long-standing constraints on housing supply (which, critically, requires more responsive planning and zoning). More generally, the Productivity Commission has identified a wide-ranging list of reforms and is a world-class resource that could help guide this policy agenda.

Tax reform—a key policy lever

Though politically challenging, a comprehensive tax reform could both increase growth and generate revenue over time to help return the budget to surplus. A comprehensive and decisive package would be needed to deliver tangible results. The on-going Tax and Federation reviews provide the opportunity to craft such a package, which should include the following inter-connected elements:

• Shifting towards more efficient and simple taxes. In particular: by preventing a large share of individual taxpayers from facing higher tax rates through unchecked bracket creep (which would affect those on lower and middle incomes most), reducing the corporate tax rate to international levels, and eliminating stamp duties and minor taxes. This would be paid for by broadening the base of the GST and possibly raising the rate—while at least fully compensating those on lower incomes—and relying more on a broad-based real-estate tax and excises.

• Ensuring fairness. A number of measures, such as reducing the concessional treatment of superannuation contributions and earnings for those on higher incomes, and the discount on capital gains, would be important for fairness. They would also enhance revenue and could improve housing affordability and financial stability. Adjusting any of these policies would need careful calibration and phasing, and should be introduced in tandem with the measures to enhance efficiency.

• Adjusting federal fiscal relations. Federal-State relations will likely need to be adjusted to facilitate the tax reform. There are many options—one could be for States to receive higher GST revenue and autonomy in return for greater spending responsibilities. This could also help increase spending efficiency.

Building resilience to reduce the risk of financial disruption

Ensuring unquestionably strong banks

Banks are highly rated and profitable, non-performing loans and funding costs are low, and wholesale funding reliance has declined and its maturity lengthened substantially since the global financial crisis. Nonetheless, the system is dominated by four large banks with similar business models which rely significantly on wholesale external borrowing, most lending is housing related, and household debt and house prices are elevated. And although capital ratios have risen since the global financial crisis, this largely reflects a shift towards mortgages and a lowering of risk weights. Implementing the recommendations of the Financial System Inquiry should be a priority.

Raising capital

While international comparisons are fraught with difficulty, Australian banks do not appear to have particularly high capital ratios and the global trend is upwards. More tangibly, the recent APRA stress test indicates that in a severe adverse scenario, bank capital would have to be substantially higher to ensure a fully-functioning system. Putting a floor of 25-30 percent on mortgage risk weights would help, but capital ratios would also need to rise substantially. Given major banks’ high profitability, such ratios can be achieved at little, if any, macroeconomic cost, especially if done gradually, and will make the financial system, the budget, and the economy stronger.