Digital Now The Default – ASIC

ASIC has released new guidance and waivers to further facilitate businesses providing disclosures through digital channels and to encourage innovative communication of information about financial products and services. It is essentially a ‘digital first’ option, meaning that consumers can expect electronic delivery as the default option. It recognises the significant online migration underway, and will be welcomed by many. Two points, this is a departure from “omnichannel” strategies, and it may not provide suffice protection for those who choose not to, or cannot use digital channels. The digital divide does still exist, and disadvantaged households will be least well served.

ASIC Commissioner John Price said, ‘The measures announced today respond to changing consumer preferences, with ever increasing numbers of people transacting digitally. Almost 15 million Australians now have a home internet connection and 68% of those online are using three or more devices to access the internet.

‘The changes mean product disclosure statements (PDS) and other financial services disclosure documents will be delivered to consumers digitally as the default option, unless the consumer opts out. This will reduce the costs of printing and mailing for businesses while preserving choice for those consumers who wish to receive paper.’

‘ASIC wants industry to harness the opportunities of digitisation and is encouraging the use of more engaging forms of communication using digital media – interactive, video and audio. This can boost consumer understanding of financial services and products,’ Mr Price said.

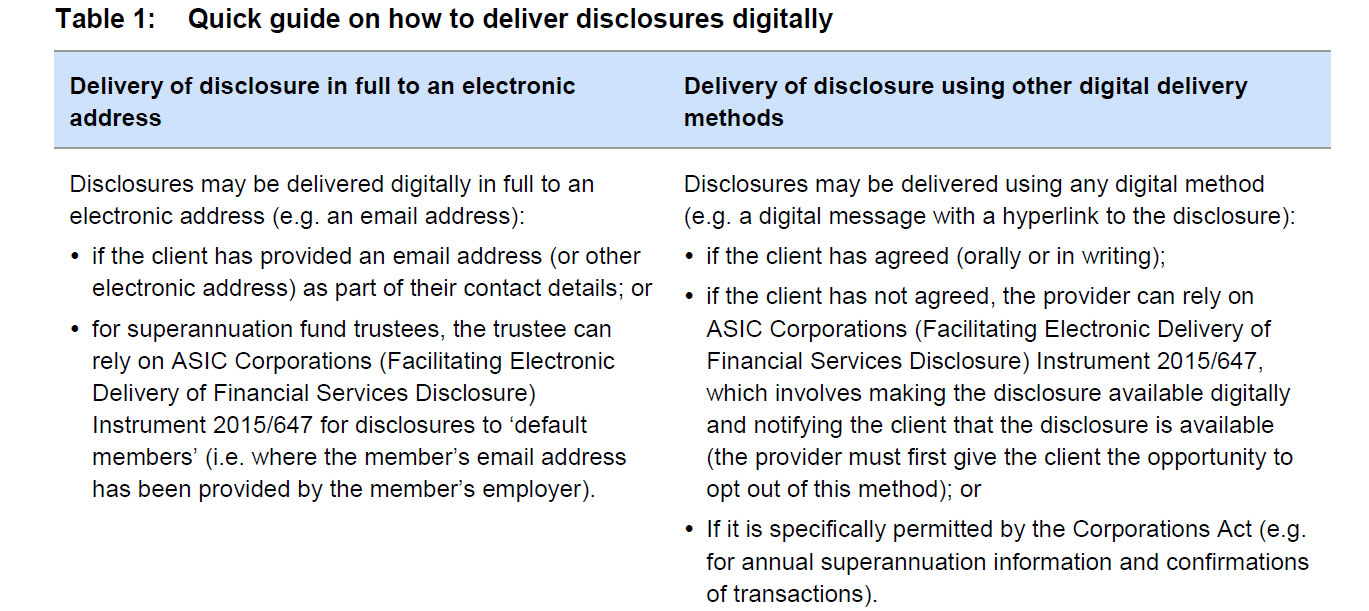
ASIC has given relief to enable providers to make many disclosures available digitally, and notify the client the disclosure is available, without the need for client agreement to receive the disclosures in that manner (‘publish and notify’ method). This relief allows for disclosure by, for example, sending clients:
(a) an email, SMS, app notification, social media notification or other digital message with a hyperlink or similar connection, or instruction to access the disclosure; or
(b) a notification that the disclosure is available digitally

The publish and notify method of delivery is available for the following disclosures:
(a) FSGs and SOAs;
(b) PDSs;
(c) ongoing disclosure of material changes and significant events;
(d) periodic statements; and
(e) information statements for CGS depository interests.

Rather than seeking agreement to deliver in this way, the provider must merely notify the client that they intend to make disclosures available digitally, and will notify the client when those disclosures are available. The client must then be given at least seven days to opt out of this publish and notify method, should they choose to do so

They say:

  1. An advantage of digital disclosure for clients is that it can incorporate more engaging forms of media and can be interactive. This can make the information more attractive and easier to understand for clients. It can also be more timely, convenient and reliable.
  2. Digital disclosure also has advantages for providers in reducing the costs of printing and mailing.
  3. ASIC has taken a technologically neutral approach to disclosures and do not mandate the delivery of disclosures digitally. It is for providers to determine the method of delivering disclosures that best suits their clients or their products and that will not expose those clients to undue risk of scams and fraud. For example, a margin-lending product might work particularly well online because clients are likely to be monitoring their investments online.
  4. While the Corporations Act expressly permits the electronic delivery of financial services disclosures, we understand that some providers have been discouraged from doing so because of uncertainty about what specific practices the law allows.
  5. Consumer protection under digital delivery still exists

ASIC-Digital-Disclosure

Further evidence of the digital revolution. As we said recently:

“DFA has just updated the 26,000 strong household survey examining their channel preferences. Our report summarises the main findings.

We conclude that the move towards digital channels continues apace, facilitated by new devices including smartphones and tablets, and the rise of “digital natives” – people who are naturally connected.

We outline the findings across each of our household segments, and also introduce our thought experiment, where we tested household’s attitudes to the various existing and emerging brands in the context of digital banking. We found a strong affinity between digital natives and the emerging electronic brands, and a relative swing away from the traditional terrestrial bank players.

These trends create both threat and opportunity. The threat is that traditional channels, especially the branch, become less relevant to digital natives, and becomes the ghetto of older, less connected, less profitable customers. The future lays in the digital channels, where the more profitable and digitally aware already live. Players need to migrate fast, or they will be overtaken by the next generation of digital brands who are looking towards becoming players in financial services. The game is on!”

Global House Price Index Up; Australia In The Middle Of The Pack

The IMF just released their Global House Price Index update. It is also worth noting that Australia, whilst experiencing significant house price growth and affordability issues, is in the middle of the pack. House prices are being impacted by significant international issues, not just local ones (factors such as financial globalisation, QE, low interest rates, low growth, rise of the Asian property investor).

Globally, house prices continue a slow recovery. The Global House Price Index, an equally weighted average of real house prices in nearly 60 countries, inched up slowly during the past two years but has not yet returned to pre-crisis levels.

http://www.imf.org/external/research/housing/images/globalhousepriceindex_lg.jpg

The overall index conceals divergent patterns: since 2007:Q3 house prices rose in a third of the countries included in the index and fell in the other two-thirds. However, the picture may be changing: over the past year, real house prices increased in two-thirds of the countries and fell in the other third.

Cumulative Real House Price Growth Since 2007:Q3

IMFJuly2Real House Price Growth Over the Past Year

IMFJuly3

Many countries in which house prices had been falling (such as Spain and the United Arab Emirates) have seen increases over the past year. Conversely, some countries where prices had been rising rapidly (as Brazil, China and Peru) have seen moderation in the rate of increase or a fall over the past year. As has been the case historically, house price growth and credit growth have gone hand-in-hand over the past five years. Clearly, however, credit growth is not the only predictor for the extent of house price growth; several other factors appear to be at play.

House Prices and Credit Growth

IMFJuly4 For OECD countries, house prices have grown faster than incomes and rents in almost half of the countries. These house price-to income and house price-to-rent ratios are highly correlated.

http://www.imf.org/external/research/housing/images/pricetoincome_lg.jpg

http://www.imf.org/external/research/housing/images/pricetorent_lg.jpg

House Price-to-Income vs. House Price-to-Rent Ratio, OECD Countries

IMFJuly7

Is 50% of all income tax in Australia paid by 10% of the working population?

From The Conversation Fact Check:

According to the 2015-16 Federal Budget, Australians paid around A$176 billion in personal income taxation in the 2014-15 financial year (Table 5 of Budget Paper 1). The Treasurer, Joe Hockey, claims that around 50% of this taxation is paid by the top 10% of the working age population as ranked by their income.

NATSEM’s STINMOD model of the Australian tax and transfer system can be used to evaluate the accuracy of such a claim.

STINMOD, which stands for Static Incomes Model, is NATSEM’s model of taxation and government benefits. It simulates the taxation and government benefits system and allows us to evaluate current and alternative policies and how they would affect different family types on various income levels.

STINMOD is based on ABS survey data (Survey of Income and Housing) which provides a statistically reliable and representative snapshot of household and personal incomes and demographics.

Since the survey is a few years old, NATSEM adjusts the population in accordance with population and economic changes since the survey.

STINMOD is not publicly available, but as a NATSEM researcher, I was able to use the model to check Hockey’s claim against the evidence. STINMOD is benchmarked to taxable incomes data from the latest Australian Tax Office taxation statistics on the distribution of tax payments by income.

When I restricted the STINMOD base population to the working age population only (aged 18 to 65) and rank these people by their taxable income, I found that the top 10% (those with taxable incomes beyond $102,000 per annum) do pay around 52% of all personal income taxation.

Tax1July2015

Different measures, similar result

Since high income earners usually have greater scope for minimising tax through deductions, such as negative gearing, we can use an alternative income measure called “total income from all sources” to rank personal incomes. On this ranking, the share of personal income taxation paid by the top 10% drops to 50.5%.

Australia’s personal income taxation system is strongly progressive, with higher income earners paying both a higher marginal tax rate and average tax rate compared to lower income earners. According to STINMOD, the 90th percentile of working age taxable income is $102,000 per year, while the median taxable income is $39,000 per year. The average tax rate of the 90th percentile is 26.7% while that of the median tax payer is less than half that at 12.3%.

This analysis does include a large number of people who are of a working age but not in the labour force – around 21% of this population (2.9 million persons). These people are not in the labour market for a range of reasons such as disabilities, students, young parents or through personal choice or a range of other reasons. Removing these people from the analysis reduces the tax share to 46% paid by the top 10%.

Tax2July2015

In 2014-15, personal income taxation made up around 47% of all tax received by the federal government. Other taxes are paid to state and local government. While personal income taxation is highly progressive, the incidence of these other taxes tend to be less progressive, or indeed mildly regressive. One example is the GST, which makes up around 14.4% of federal taxation receipts.

Verdict

The Treasurer’s statement that the top 10% of incomes from working age persons pay 50% of personal income tax is correct. This reflects the progressive nature of Australia’s personal income tax system, which is applied to a society that features significant income inequality.

The progressive nature of income taxation in Australia plays a very significant role in altering the distribution of disposable income (after-tax) and provides Australia with a more equal distribution of disposable income.


Review

The FactCheck seems reasonable and correct. It benchmarks the ABS household income and expenditure survey against the official ATO Taxation Statistics, and then confines to working age (18 to 65), to test the Treasurer’s claim.

There were about 12.8 million individuals filing tax returns in 2012-13. The ATO Statistics in its “100 persons” picture of Australian taxpayers, explains that the top three taxable incomes paid 27% of all net tax and the top nine taxable incomes paid 47% in total – pretty close to the working age estimate.

I agree with the author that the FactCheck demonstrates Australia’s progressive income tax system, which has long been considered fair.

Australia has a high tax-free threshold of $18,200 so many working age low earners pay very little income tax. In contrast, New Zealand taxes from the first dollar of income.

And many working age people pay no tax simply because they are unable to find a job – as Australia has an adjusted 6% unemployment rate.

Do Systems Limitations Hamper Mortgage Repricing?

Westpac, the bank with the largest share of Investment Home Loans will be the last of the big four to tweak their rates, following recent changes at NAB, ANZ and CBA. However, systems limitations may cramp their style according to reports today.

According to SMH Business Day,

“Westpac Banking Corp is missing out on $1 million a day that its competitors are now creaming from landlords because its computer systems will not allow it to charge differing interest rates.

Westpac, which is the largest lender to landlords, is the only one of the big four banks not to have increased interest rates for property investors in recent days.

National Australia Bank on Monday said it would raise rates by 0.29 percentage points on all interest-only loans following Commonwealth Bank of Australia and ANZ Banking Group, which last week raised rates for investors only.

Sources said NAB is constrained from charging different rates to investors and owner-occupiers because of technical problems. The bank declined to comment.

Westpac too is finding it challenging to distinguish between investors and owner-occupiers, sources said.

Westpac and NAB use a single “reference rate” for owner-occupier and investor borrowers, which means they cannot increase the standard variable rate for property investors without also hitting owner-occupiers.
Banking sources said it might take Westpac several months to work through systems issues to enable it to charge different rates. This could involve senior members of the IT team re-coding some of the banking systems to allow different reference rates even though the bank has created different home loan products for investors and owner-occupiers.

The pressure on Westpac to resolve its systems issues to enable it to charge different rates is growing because senior bankers tip a bifurcation of the home loan interest rate market, with owner-occupiers and investors expected to pay different rates in coming years.

Up to 1998, it was common for banks to offer owner-occupiers lower interest rates compared to property investors. The interest rate differential was around 1 percentage point”.

NAB Repricing Mortgage Strategy Has Different Tenor

NAB is the latest player to announce mortgage repricing changes, but with a focus in interest-only loans (whether owner-occupied or investment loans).

“National Australia Bank today announced it will increase variable interest rates on interest-only home loans and line of credit facilities by 29 basis points.

The changes are in response to industry concerns about the pace of investor growth, and NAB’s focus on delivering responsible lending practices into the Australian housing market.

Over the past three years, total housing loans have grown by 27 per cent across the industry.

During the same period, growth in housing investment loans and interest only loans has been 34 per cent and 44 per cent respectively. Interest only loans are the predominant structure for investors.

NAB Group Executive Personal Banking, Gavin Slater, said that the higher growth rates in investment and interest only loans had implications from a regulatory, industry and banking perspective.

In December last year, APRA announced a range of measures to reinforce sound lending practices across the industry. NAB has been working closely with the regulator to support these measures, including actions to restrict investor lending growth to no more than 10% p.a..

“In considering these and a range of other factors, NAB is confident the steps we are taking are the right approach to further support responsible lending practices,” Mr Slater said.

“In an environment of record low interest rates, NAB believes it is important to encourage our customers to pay down their home loan.”

NAB continually reviews its lending practices and remains committed to maintaining prudent lending standards and fulfilling its regulatory obligations.

For new loans, NAB’s interest only variable rate changes will be effective 10 August 2015.The change for existing interest only variable rate loans will be effective 10 September 2015. Additionally, changes to NAB’s fixed rate interest only loans will be effective 10 August 2015. Changes to NAB’s line of credit loans will be effective 10 September 2015.

Customers who want to know more about these changes and the impact on their circumstances are encouraged to talk to their banker about what works best for them”.

Our modelling suggests up to 35% of NAB mortgages may be impacted by these changes, creating a broader base of re-pricing than ANZ and CBA have announced. The quantum of the interest rise at 29 basis points is similar.  The net yield from this approach could well provide a higher return for NAB in terms of margins, unless owner-occupied interest-only borrowers decide to refinance to a competitor with a lower rate. Also NAB’s headline investor loan rate (not interest-only) will be more competitive than others, though of course headline rates are often discounted. We are noting some reduction in net average discounts on new loans being written across the industry.

In APRA’s recent reviews, they noted that some lenders were not adequately considering borrower repayment strategies on interest-only loans beyond the initial interest-only term. NAB’s repricing will reduce the relative attractiveness of interest-only loans.

Of note is the fact that Basel IV will likely lift the capital required for interest-only lending, so NAB’s move could be seen as preemptive positioning.

Resmiac announces key changes to prime alt doc loans

According to MPA, non-bank lender Resmiac has announced key policy changes to its prime alt doc product, aimed at giving self-employed borrowers even more choice.

Among the key policy changes announced is an increase in maximum loan amount to $1,500,000 for those borrowers seeking to borrow up to 75 per cent of the security value, the ability to access cash out for any worthwhile purpose and the removal of automated credit decisions.

Additionally, the non-bank says borrowers will now have more flexibility when it comes to verifying their income with the option of either an accountant’s letter, six months Business Activity Statements or three months business bank statements to support their declared income.

Higher Mortgage Risk-Weights First Step to Strengthen Australian Bank Capital – Fitch

Fitch Ratings states that an increase in the minimum average Australian residential mortgage risk-weight for banks accredited to use the internal ratings-based (IRB) approach for regulatory capital calculations was expected, and is only the first step in higher capital requirements for these banks. Greater levels of capital are likely to be required over the next 18-24 months as further measures from Australia’s 2014 Financial Services Inquiry (FSI) are implemented and adjustments to the global Basel framework are finalised.

The announced increase in minimum mortgage risk-weights is the first response to the final FSI report, published December 2014, which also recommended Australian banks’ capital positions be ‘unquestionably strong’. The latter recommendation is aimed at improving the resilience of the banking system given its reliance on offshore funding markets, its highly concentrated nature, and the similarity in the business models of most Australian banks. The change in mortgage risk-weights should provide a modest boost to the competitiveness of smaller Australian deposit takers that currently use the standardised approach for regulatory capital calculations.

The change announced by the Australian Prudential Regulation Authority (APRA) on 20 July 2015 is likely to be the first of a number of changes made to strengthen the capital positions of Australian banks. APRA referred to the higher risk-weights as an interim measure, with final calibration between IRB and standardised models expected once the Basel committee’s review of the framework is completed – this is unlikely to be before the end of 2015.

The move will result in minimum average risk-weights for Australian residential mortgage portfolios increasing to at least 25% from around 16% at the moment. APRA estimates this would increase minimum common equity tier 1 (CET1) requirements by about 80bps for Australia’s four major banks – Australia and New Zealand Banking Group Limited (ANZ; AA-/ Stable), Commonwealth Bank of Australia (CBA; AA-/ Stable), National Australia Bank Limited (NAB; AA-/ Stable), and Westpac Banking Corporation (Westpac; AA-/ Stable). This is equivalent to nearly AUD12bn for the four banks based on regulatory capital disclosures at 31 March 2015. The only other bank to be impacted is Macquarie Bank Limited (A/ Stable) which has estimated a CET1 impact of about 20bps, or AUD150m.

The higher risk weights will be implemented on 1 July 2016, giving the affected banks nearly 12 months to address capital shortfalls. Sound profitability means that shortfalls could be met through internal means – the AUD12bn is equivalent to about 40% of annualised 1H15 net profit after tax for the four major banks. Fitch expects the banks will look at increasing the discount on dividend reinvestment plans, and/or underwriting participation in these schemes to meet shortfalls. However, raising capital in equity markets is also an option to address both the requirement early and in anticipation of future increases in regulatory capital requirements. Banks have already begun increasing capital positions, with a number of the major banks announcing capital management activity at their 1H15 results.

The size of the increased capital requirement will vary across the banks based upon their loan portfolio compositions – CBA and Westpac have the largest Australian mortgage portfolios and therefore their minimum capital requirements are expected to be the most impacted.

CBA Follows The Mortgage Pricing Crowd

CBA has announced changes to its investment loan pricing.  Like ANZ, which we covered yesterday, the price rise applies to existing as well as new investment loans, which means that the move, whilst ostensibly connected with APRA’s 10% growth hurdle actually has more to do with the changing capital requirements which were announced this week and the ability to offer keen rates to attract new owner occupied loans (which are not caught by the 10% cap).

Commonwealth Bank has today taken further steps to moderate investor home loan growth and to manage its portfolio to address the Australian Prudential Regulation Authority’s concerns regarding investment home lending growth. The interest rate on investor home loans will increase by 27 basis points to 5.72% per annum. Fixed rates for 1,2,3,4 and 5 year new investor home loans will also increase by between 10 and 40 basis points. There are no increases to the SVR on owner occupied loans and fixed rates for some owner occupied loans have been reduced.

Demand for investor home loans across Australia has reached historic highs, with recent data noting that over 50% of new home loan approvals are for investment purposes. Last December, APRA introduced new regulatory measures to reinforce sound residential lending practices, including actions to restrict investor lending growth to no more than 10% p.a.

Matt Comyn, Group Executive for Retail Banking Services said: “As Australia’s largest home lender, we support the prudential regulator’s actions to ensure lending practices remain sustainable and we have been actively managing our investment home loan portfolio to remain below the 10% growth limit.

“Despite making a range of changes to our investor lending policies in the past few months we have witnessed ongoing investor lending growth, and at an industry level, investor lending approvals remain 22% higher than 12 months ago.”

Commonwealth Bank has moved to ensure it remains competitive for owner occupied loans and we have reduced rates on our 1,2,3, and 4 year fixed rate loans by up to 30 basis points. These fixed rate changes came into effect this week (22 July 2015).

“In the current market conditions, we believe these changes strike an appropriate balance in our portfolio between owner occupied home loans and those seeking investment loans,” Mr Comyn said.

Fixed rate loans for investors will increase by between 0.10% and 0.40% . This will apply to new loans only and will come into effect from 31 July 2015.

The new investment home loan rate of 5.72% remains one of the lowest rates offered by CBA and is 0.18% lower than the rate six months ago. It will apply to new and existing customers and will come into effect from 10 August 2015.

We expect the other majors to topple into line, so moving pricing of investment loans higher. Some fixed owner occupied rates are cut, so CBA is re-balancing its portfolio. Now of course the question will be, does this translate into dampening demand for investment property, as the RBA hopes, or does it simply lift the interest costs which can be set against tax, (remember many investment loans are interest only). Given the significant capital appreciation we have been seeing lately, and that fact that rates are low (as low as ever) we suspect demand will still be there. It is conceivable as this works through the RBA may have more wriggle room for another rate cut, but we are not so sure.

NAB Wealth refunds additional customers

Following an independent review, NAB has refunded customers who were impacted by errors dating back to 2001 and are centered on processes and controls relating to Navigator – a platform NAB inherited from the Aviva acquisition in 2009.

ASIC said National Australia Bank’s wealth management business (NAB Wealth) has announced the resolution of its compensation program due to issues with its Navigator Wrap platform, with $25 million in compensation to be paid to approximately 62,000 customers. The issues relate to tax estimation and income estimation errors on its Navigator Wrap platform.

Following ASIC’s request, NAB Wealth appointed PriceWaterhouse Coopers to independently review the payout process, systems integrity and breach reporting and governance.

Commissioner Greg Tanzer said, ‘ASIC expects banks to vigilantly monitor their platforms for issues such as this. Any issues identified should be swiftly and pro-actively reported to ASIC, with a view to promptly compensating customers.’

ASIC acknowledged NAB Wealth’s cooperation in this matter.

In NABs statement, they said as part of this review, NAB has identified errors and processes dating back to 2001, which was prior to NAB’s 2009 acquisition of Aviva, which included the Navigator platform, and when Aviva was eventually integrated into the NAB business in 2011.

These errors and processes relate to how income and tax was being allocated to customers’ accounts on closure. This resulted in surplus monies being held within the Navigator Platform Funds for the benefit of fund customers, rather than being attributed at the individual customer account level. At no stage have these monies been held by, or accounted for, as part of the assets of any NAB Group company.

The review undertaken by NAB over the past 12 months has now resolved this, with all affected customers to be paid their due allocations. In total, approximately 62,000 customers will receive funds to the value of approximately $25 million.

One-third (34%) of customers will receive a payment of $50 or less, 50% of customers will receive less than $100, and 75% of customers will receive less than $350. The average payment per customer is $400, which includes interest.

Group Executive, NAB Wealth and CEO of MLC, Andrew Hagger said that NAB will write to customers and advisers over the coming weeks to explain this legacy issue and what NAB has done to fix the problem.

“NAB Wealth has applied significant focus to our breach identification and reporting processes, which is what led to NAB originally reporting this legacy issue to ASIC,” Mr Hagger said.

“These errors date back to 2001 and are centred on processes and controls relating to Navigator – a platform NAB inherited when we acquired Aviva in 2009. Our teams have worked extensively, with oversight by PwC and ASIC, to ensure the right processes, systems and controls are now in place.

“While this is a legacy issue, we took deliberate steps to make absolutely sure we could get the fairest outcome for our customers.

“These errors are in no way related to the quality of NAB Wealth’s advice to its customers.”

The only customers impacted are customers who closed their accounts on the Navigator platform between 30 September 2001 and 30 April 2015. The majority of money now being distributed to customers is being distributed from within the Navigator Platform Funds to the entitled customers. Given that the majority of the $25 million is being reallocated from the Navigator Platform Funds, this payment is immaterial to NAB.

Truthy untruths: behind the facade of the Intergenerational Report

From The Conversation.

The ostensible purpose of the 2015 Intergenerational Report is to ensure Australia’s future prosperity in the face of demographic ageing over the next 40 years. Its real purpose is different.

The Coalition won the 2013 election as the party of economic management, a party that would balance the books after years of Labor profligacy, hence the 2014-15 budget cuts. The report uses the alleged ageing crisis to legitimate these budget cuts, as well as a high rate of immigration-fuelled population growth.

Thus it focuses on the costs of ageing. But our new research shows it makes three claims which are overstated to the point of being deliberately misleading. This is important as the IGR is being used as a basis for far-reaching policy decisions.

First, on page 1, the IGR says labour force participation will fall because the number of people aged 15-64 for every person 65 plus will drop from 4.5 today to just 2.7 in 2055. This fall will reduce per capita economic growth.

Second, the cost of providing health care, pensions and aged care for an older population will balloon.

Third, because migrants tend to be young, Australia must maintain high immigration. The authors project annual net overseas migration (NOM) of 215,000 from 2018-19 to 2054-55. This is a large number; from 1990-91 to 2005-06 the annual average was 95,000.

Together with natural increase, it will inflate the population from 23.8 million today to 39.7 million, an increase of 15.9 million, or 66.8%.

Claim 1: ageing and Australians’ future prosperity

Per capita economic growth is the product of the population, participation and productivity. The report’s calculations of their respective contribution are set out in in Figure 1. The main driver is productivity, projected to contribute 1.5 percentage points each year.

Source: ABS cat. no. 5206.0, 6202.0 and Treasury projections

The chart shows a slight fall in per capita economic growth from declining labour force participation of 0.1 percentage points a year. This is a big surprise. Despite the up-front assertion about ageing’s negative impact on participation, the effect turns out to be minimal.

An even bigger surprise is that the chart shows a 0.1 percentage point annual increase in per capita economic growth from population. This is because the proportion who are children will fall relative to all those aged 15 plus.

This positive effect is astonishing. Treasury’s own modelling shows that the ‘population’ effect cancels out the small labour-force participation effect.

Claim 2: budget costs

The report projects a substantial increase in health expenditure. But most of this is due to rising costs in providing health care for everyone. The online chart data for chart 2.11 makes this clear; only 16% of the projected increase is due to ageing.

Scares about pension costs and aged-care funding are similarly exaggerated. Pension payments currently equal 2.9% of GDP. Depending on policies, this percentage may fall to 2.7 by 2054-55 or rise to 3.6 (p. 69). And government expenditure on aged care may rise from 0.9% of GDP in 2014-15 to just 1.7% in 2054-55 (p. 71).

These two sets of figures are hardly startling. Indeed Australia spends a much lower proportion of GDP on age pensions than most OECD countries; in 2007 the OECD average was 7% of GDP.

Claim 3: the economic gains from high net migration

The report asserts that high migration results in a younger population than would be the case without it (p. 11). To bolster this claim it presents an arresting bar chart.

Source: ABS cat. no. 3101.0 and 3412.0.

But oddly the authors don’t quantify the difference and its long-term effects.

To fill this gap we used two ABS projections (with slightly different assumptions to those of the report) and estimated the difference that a NOM of 200,000 p.a. makes to the median age in 2055. We found that it produces a median age of 41.4. By comparison, no net migration over the next 40 years results in a median age of 46.1.

(The two projection series used here are series 38 (NOM 200,000 p.a, TFR 2.0, high life expectancy) and series 56 (Nom 0, TFR 2.0, high life expectancy). See data published online with Population Projections, Australia, 2012.

This minor “younging” effect is assumed to increase participation (page 20). But our research (p. 6) shows the report’s own data shows that this has a negligible impact on per capita economic growth. For example, an extra 70,000 net migrants per year until 2055 adds four million people but only increases per capita economic growth by 0.06%.

But the report’s goal is an extra 15.9 million, not four million. What about the infrastructure costs? Here it makes the bizarre claim that infrastructure costs “are not linked explicitly to demographic factors” (page 57).

Two hidden agendas

Demographic ageing does not impose heavy costs. Rather, the phony scare campaign has been used to justify the Coalition’s budget cuts, while the high NOM assumptions help justify its current immigration policy.

The government is desperate to find a short-term solution to the problem of lower economic activity post the resources boom. Population growth boosts the housing and city-building industries and this may help, not with per capita economic growth but with aggregate economic growth.

The latter is the key driver of tax revenue and, in the case of business, of growth in sales. The report does not say much about it, except to provide the results of its modelling. Here aggregate GDP is projected to grow by 2.8% per annum to 2054-55. (Page 27.) The IGR’s data shows that, while gains in productivity will make a substantial contribution to this, crude population growth accounts for nearly half.

Why worry?

The IGR does devote a few pages (See page 38) to the environmental implications of its population growth, conceding that careful management will be required. But it finds no serious costs for the Commonwealth as the “level of Commonwealth Government spending on the environment is not directly linked with demographic factors” (page 40).

So Treasury is off the hook. But all Australians will suffer from the impact of massive population growth on the environment and the alienation of agricultural land. (See contributions from Rhondda Dickson, Michael Jeffrey and Gary Jones in Sustainable Futures: Linking population, resources and the environment].

The other pressing concern for voters is jobs and the economy. What are the newly arrived migrants going to do, apart from build houses for each other?

The supposed economic ill-effects of ageing are trivial. They should be easily managed by future generations themselves, provided they are not overwhelmed by the costs of bloated cities and environmental decay.


Authors: Katharine Bett, Adjunct Associate Professor of Sociology at Swinburne University of Technology; Bob Birrel, Researcher, Centre for Population and Urban Research at Monash University