Macroprudential Policy in the U.S. Economy

Fed Vice Chairman Stanley Fischer spoke at the “Macroprudential Monetary Policy” conference. He remains concerned that the U.S. macroprudential toolkit is not large and is not yet battle tested. The contention that macroprudential measures would be a better approach to managing asset price bubbles than monetary policy, he says, is persuasive, except when there are no relevant macroprudential measures available. It also seems likely that monetary policy should be used for macroprudential purposes with an eye to the tradeoffs between reduced financial imbalances, price stability, and maximum employment.

This afternoon I would like to discuss the challenges to formulating macroprudential policy for the U.S. financial system.

The U.S. financial system is extremely complex. We have one of the largest nonbank sectors as a percentage of the overall financial system among advanced market economies. Since the crisis, changes in the regulation and supervision of the financial sector, most significantly those related to the Dodd-Frank Wall Street Reform and Consumer Protection Act of 2010 (Dodd-Frank Act) and the Basel III process, have addressed many of the weaknesses revealed by the crisis. Nonetheless, challenges to our efforts to preserve financial stability remain.

The Structure, Vulnerabilities, and Regulation of the U.S. Financial System
To set the stage, it is useful to start with a brief overview of the structure of the U.S. financial system. A diverse set of institutions provides credit to households and businesses, and others provide deposit-like services and facilitate transactions across the financial system. As can be seen from panel A of figure 1, banks currently supply about one-third of the credit in the U.S. system. In addition to banks, institutions thought of as long-term investors, such as insurance companies, pension funds, and mutual funds, provide anotherone-third of credit within the system, while the government-sponsored enterprises (GSEs), primarily Fannie Mae and Freddie Mac, supply 20 percent of credit. A final group, which I will refer to as other nonbanks and is often associated with substantial reliance on short-term wholesale funding, consists of broker-dealers, money market mutual funds (MMFs), finance companies, issuers of asset-backed securities, and mortgage real estate investment trusts, which together provide 14 percent of credit.

Fed-Fig-1In the first quarter of this year, U.S. financial firms held credit market debt equal to $38 trillion, or 2.2 times the gross domestic product (GDP) of the United States. As the figure shows, the size of the financial sector relative to GDP grew for nearly 50 years but declined after the financial crisis and has only started increasing again this year.

From the perspective of financial stability, there are two important dimensions along which the categories of institutions in figure 1 differ. First, banks, the GSEs, and most of what I have called other nonbanks tend to be more leveraged than other institutions. Second, some institutions are more reliant on short-term funding and hence vulnerable to runs. For example, MMFs were pressured during the recent crisis, as their deposit-like liabilities–held as assets by highly risk-averse investors and not backstopped by a deposit insurance system–led to a run dynamic after a large fund broke the buck. In addition, nearly half of the liabilities of broker-dealers consists–and consisted then–of short-term wholesale funding, which proved to be unstable in the crisis.

The pros and cons of a multifaceted financial system
The significant role of nonbanks in the U.S. financial system and the associated complex web of interconnections bring both advantages and challenges relative to the more bank-dependent systems of other advanced economies. A potential advantage of lower bank dependence is the possibility that a contraction in credit supply from banks can be offset by credit supply from other institutions or capital markets, thereby acting as a spare tire for credit supply. Historical evidence suggests that the credit provided by what I termed long-term investors–that is, insurance companies, pension funds, and mutual funds–has tended to offset movements in bank credit relative to GDP, as indicated by the strong negative correlation of credit held by these institutions with bank credit during recessions. In other words, these institutions have acted as a spare tire for the banking sector.

However, complexity also poses challenges. While the financial crisis arguably started in the nonbank sector, it quickly spread to the banking sector because of interconnections that were hard for regulators to detect and greatly underappreciated by investors and risk managers in the private sector.6 For example, when banks provide loans directly to households and businesses, the chain of intermediation is short and simple; in the nonbank sector, intermediation chains are long and often involve a multitude of both banks and other nonbank financial institutions.

Regulatory, supervisory, and financial industry reforms since the crisis
U.S. regulators have undertaken a number of reforms to address weaknesses revealed by the crisis. The most significant set of reforms has focused on the banking sector and, in particular, on regulation and supervision of the largest, most interconnected firms. Changes include significantly higher capital requirements, additional capital charges for global systemically important banks, macro-based stress testing, and requirements that improve the resilience of banks’ liquidity risk profile.

Changes for the nonbank sector have been more limited, but steps have been taken, including the final rule on risk retention in securitization, issued jointly by the Federal Reserve and five other agencies in October of last year, and the new MMF rules issued by the Securities and Exchange Commission (SEC) in July of last year, following a Section 120 recommendation by the Financial Stability Oversight Council (FSOC). More recently, the SEC has also proposed rules to modernize data reporting by investment companies and advisers, as well as to enhance liquidity risk management and disclosure by open-end mutual funds, including exchange-traded funds. Other provisions include the central clearing requirement for standardized over-the-counter derivatives and the designation by the FSOC of four nonbanks as systemically important financial institutions. The industry has also undertaken important changes to bolster the resilience of its practices, including notable improvements to internal risk-management processes.

Some challenges to macroprudential policy
The steps taken since the crisis have almost certainly improved the resilience of the U.S. financial system, but I would like to highlight two significant challenges that remain.

First, new regulations may lead to shifts in the institutional location of particular financial activities, which can potentially offset the expected effects of the regulatory reforms. The most significant changes in regulation have focused on large banks. This focus has been appropriate, as large banks are the most interconnected and complex institutions. Nonetheless, potential shifts of activity away from more regulated to less regulated institutions could lead to new risks.

It is still too early to gauge the degree to which such adaptations to regulatory changes may occur, although there are tentative signs. For example, we have seen notable growth in mortgage originations at independent mortgage companies as reflected in the striking increase in the share of home-purchase originations by independent mortgage companies from 35 percent in 2010 to 47 percent in 2014. This growth coincides with the timing of Basel III, stress testing, and banks’ renewed appreciation of the legal risks in mortgage originations. As another example, there have also been many reports of diminished liquidity in fixed-income markets. Some observers have linked this shift to new regulations that have raised the costs of market making, although the evidence for changes in market liquidity is far from conclusive and a range of factors related to market structure may have contributed to the reporting of such shifts.

Despite limited evidence to date, the possibility of activity relocating in response to regulation is a potential impediment to the effectiveness of macroprudential policy. This is clearly the case when activity moves from a regulated to an unregulated institution. But it may also be relevant even when activity moves from one regulated institution to an institution regulated by a different authority. This scenario can occur in the United States because different regulators are responsible for different institutions, and financial stability traditionally has not been, and in a number of cases is still not, a central component of these regulators’ mandates. To be sure, the situation has improved since the crisis, as the FSOC facilitates interagency dialogue and has a shared responsibility for identifying risks and reporting on these findings and actions taken in its annual report submitted to the Congress. In addition, FSOC members jointly identify systemically important nonbank financial institutions. Despite these improvements, it remains possible that the FSOC members’ different mandates, some of which do not include macroprudential regulation, may hinder coordination. By contrast, in the United Kingdom, fewer member agencies are represented on the Financial Policy Committee at the Bank of England, and each agency has an explicit macroprudential mandate. The committee has a number of tools to carry out this mandate, which currently are sectoral capital requirements, the countercyclical capital buffer, and limits on loan-to-value and debt-to-income ratios for mortgage lending.

A second significant challenge to macroprudential policy remains the relative lack of measures in the U.S. macroeconomic toolkit to address a cyclical buildup of financial stability risks. Since the crisis, frameworks have been or are currently being developed to deploy some countercyclical tools during periods when risks escalate, including the analysis of salient risks in annual stress tests for banks, the Basel III countercyclical capital buffer, and the Financial Stability Board (FSB) proposal for minimum margins on securities financing transactions. But the FSB proposal is far from being implemented, and a number of tools used in other countries are either not available to U.S. regulators or very far from being implemented. For example, several other countries have used tools such as time-varying risk weights and time-varying loan-to-value and debt-to-income caps on mortgages. Indeed, international experience points to the usefulness of these tools, whereas the efficacy of new tools in the United States, such as the countercyclical capital buffer, remains untested.

In considering the difficulties caused by the relative unavailability of macroprudential tools in the United States, we need to recognize that there may well be an interaction between the extent to which the entire financial system can be strengthened and made more robust through structural measures–such as those imposed on the banking system since the Dodd-Frank Act–and the extent to which a country needs to rely more on macroprudential measures. Inter alia, this recognition could provide an ex post rationalization for the United States having imposed stronger capital and other charges than most foreign countries.

Implications for monetary policy
Though I remain concerned that the U.S. macroprudential toolkit is not large and not yet battle tested, that does not imply that I see acute risks to financial stability in the near term. Indeed, banks are well capitalized and have sizable liquidity buffers, the housing market is not overheated, and borrowing by households and businesses has only begun to pick up after years of decline or very slow growth. Further, I believe that the careful monitoring of the financial system now carried out by Fed staff members, particularly those in the Office of Financial Stability Policy and Research, and by the FSOC contributes to the stability of the U.S. financial system–though we have always to remind ourselves that, historically, not even the best intelligence services have succeeded in identifying every significant potential threat accurately and in a timely manner. This is another reminder of the importance of building resilience in the financial system.

Nonetheless, the limited macroprudential toolkit in the United States leads me to conclude that there may be times when adjustments in monetary policy should be discussed as a means to curb risks to financial stability. The deployment of monetary policy comes with significant costs. A more restrictive monetary policy would, all else being equal, lead to deviations from price stability and full employment. Moreover, financial stability considerations can sometimes point to the need for accommodative monetary policy. For example, the accommodative U.S. monetary policy since 2008 has helped repair the balance sheets of households, nonfinancial firms, and the financial sector.

Given these considerations, how should monetary policy be deployed to foster financial stability? This topic is a matter for further research, some of which will look similar to the analysis in an earlier time of whether and how monetary policy should react to rapidly rising asset prices. That discussion reached the conclusion that monetary policy should be deployed to deal with errant asset prices (assuming, of course, that they could be identified) only to the extent that not doing so would result in a worse outcome for current and future output and inflation.

There are some calculations–for example, by Lars Svensson–that suggest it would hardly ever make sense to deploy monetary policy to deal with potential financial instability. The contention that macroprudential measures would be a better approach is persuasive, except when there are no relevant macroprudential measures available. I believe we need more research into the question. I also struggle in trying to find consistency between the certainty that many have that higher interest rates would have prevented the Global Financial Crisis and the view that the interest rate should not be used to deal with potential financial instabilities. Perhaps that problem can be solved by seeking to distinguish between a situation in which the interest rate is not at its short-run natural rate and one in which asset-pricing problems are sector specific.

Of course, we should not exaggerate. It is one thing to say we have no macroprudential tools and another to say that having more macroprudential measures–particularly in the area of housing finance–could provide major financial stability benefits. It also seems likely that monetary policy should be used for macroprudential purposes with an eye to the tradeoffs between reduced financial imbalances, price stability, and maximum employment. In this regard, a number of recent research papers have begun to frame the issue in terms of such tradeoffs, although this is a new area that deserves further research.

It may also be fruitful for researchers to continue investigating the deployment of new or little-used monetary policy tools. For example, it is arguable that reserve requirements–a traditional monetary policy instrument–can be viewed as a macroprudential tool. In addition, some research has begun to ask important questions about the size and structure of monetary authority liabilities in fostering financial stability.

Conclusion
To sum up: The need for coordination across different regulators with distinct mandates creates challenges to the timely deployment of macroprudential measures in the United States. Further, the toolkit to act countercyclically in the face of building financial stability risks is limited, requires more research on its efficacy, and may need to be enhanced. Given these challenges, we need to consider the potential role of monetary policy in fostering financial stability while recognizing that there is more research to be done in clarifying the potential costs and benefits of doing so when conditions appear so to warrant.

After all of the successful work that has been done to reform the financial system since the Global Financial Crisis, this summary may appear daunting and disappointing. But it is important to highlight these challenges now. Currently, the U.S. financial system appears resilient, reflecting the impressive progress made since the crisis. We need to address these questions now, before new risks emerge.

FactCheck Q&A: is Australia the most unequal it has been in 75 years?

The Conversation is fact-checking claims made on Q&A, broadcast Mondays on the ABC at 9:35pm. Thank you to everyone who sent us quotes for checking. Viewers can request statements to be FactChecked via Twitter using hashtags #FactCheck and #QandA, on Facebook or by email.

Excerpt from Q&A, September 21, 2015.

Australian statistics show that we are at the most unequal we’ve been in 75 years. – Leader of the Opposition, Bill Shorten, speaking on ABC TV’s Q&A program, September 21, 2015.

The complexity behind inequality is undeniable. Whole journals are dedicated to the topic and there are myriad ways of measuring it.

Members of the Opposition are fond of saying that inequality in Australia is at a 75-year high. That is, that inequality is worse now than it has been since about halfway through last century.

Is that statement supported by the research?

Checking the source

The source for Shorten’s stat is research by Shadow Assistant Treasurer Andrew Leigh, a former professor of economics at the Australian National University.

A spokesperson for Leigh directed The Conversation to the following graph, using data published in Leigh’s 2013 book, Battlers and Billionaires: The Story of Inequality in Australia.

Andrew Leigh, Battlers and Billionaires

The chart shows inequality since just after federation, defined as total income share held by the top earners. A higher figure is more unequal; lower means more equal, until one (when 1% hold 1% of total income).

Leigh says on his website that his analysis “is based on crunching tax data, national accounts figures, and population statistics.”

Leigh and fellow economist Tony Atkinson argued in a co-authored paper that inequality fell between the 1950s and the late 1970s. The same paper notes that for the top Australian earners:

There is a clear spike in 1950, mainly due to the peak wool prices which sheep farmers received in that year.

Commodity price anomalies aside, the overall trend in Leigh’s graph supports the narrative that income equality in Australia improved after the 1940s, began worsening in the 1980s, and is now back at levels not seen since the middle of last century.

So Shorten’s representation of Leigh’s data is perhaps a slight exaggeration but not a major one.

Technically, there was a spike in income inequality in 1950 so perhaps some sticklers will say Shorten should have said the most unequal in 65 years. Leigh’s data shows that apart from the spike, Australia is back to the level of top income shares of the 1940s (except for the war years 1944 and 1945).

What does other research say?

There is not much research on this issue going back as far as 75 years. Most other studies look at the last 20 years and most show that inequality is still a problem in Australia.

An Australia21 report released last year and launched by former politician John Hewson also warned of rising inequality. And a Parliamentary Committee recently reported Australia is more unequal.

Work by Professor Peter Whiteford, a researcher on inequality at the Australian National University, shows that higher average incomes do not benefit all Australians if gains are only held by the wealthy few.

And Whiteford wrote last year on The Conversation:

The most common measure of inequality is the Gini coefficient, which varies between zero and one. If everyone had exactly the same income then it would be zero (perfect equality). If one household had all the income then it would be one (complete inequality)… Research by economists David Johnson and Roger Wilkins found that the Gini coefficient increased from around 0.27 in 1981–82 to around 0.30 in 1997-98. Subsequently, the official ABS income statistics show that the Gini coefficient increased to 0.34 just before the global financial crisis in 2008, then fell to 0.32 in 2011-12.

Trends in income inequality (Gini coefficient) in Australia, 1981–82 to 2011-12. Author

The most recent income survey released by the ABS tracks, among other things, how Australia’s Gini coefficient has changed since the 1990s.

It shows that inequality peaked in 2007-08 and then fell, but in the most recent year went up again but not quite to the 2007-08 level. That suggests inequality was a little bit higher seven or eight years ago, compared to now.

A quick qualifier: tracking the Gini coefficient is valuable because it gives information on the bottom income earners as well as the top. However, the Gini can be constructed using broad or narrow income measures, different data sources, and can look at either household or individual incomes. So it is not a simple matter to compare Gini coefficient results. The ABS, in their Table 1.1 data release, urged caution in interpreting the recent changes in Gini coefficient results, saying:

Estimates presented for 2007–08 onwards are not directly comparable with estimates for previous cycles due to the improvements made to measuring income introduced in the 2007–08 cycle.

Much of the discussion of inequality is about the pattern of change over time – the trend, not the year-to-year differences. Many would argue insufficient consistent figures exist even since 2007-08 to identify a trend.

Finally, the ABS Gini estimate is based on surveys (which the tax based measure of the 1% share used by Leigh isn’t), with survey errors (see ABS explanatory note 78), and so each Gini is a mid-point and needs a window drawn around it, to reflect the possible range of the true value. This window might show that the very small differences in the estimates since 2007-8 actually aren’t statistically different.

We should be cautious not to draw conclusions from any sole figure; any single inequality measure provides only a partial picture. Looking at a broad range of inequality measures and trying to grasp the trend gives a better picture of inequality in Australia.

Verdict

It all depends on what figures you use.

Shorten’s representation of his ALP colleague Andrew Leigh’s data is perhaps slightly exaggerated but broadly correct – give or take a few years. There are not many inequality analyses going back as far as 75 years and most research supports the proposition that inequality has been rising in Australia.

There is data recently released by the ABS using the Gini coefficient that suggests inequality may have been a little bit higher seven or eight years ago than it is now. But there are strong doubts about whether this is true statistical difference or a trend. So it is too early to say whether inequality was stable or falling over the period from 2007-8 to now.


Review

The fact check is a good summary of the available data on income inequality and, importantly, the difficulty in measurement. The spike in the 1950s was probably due to one-off factors, so it is fair to discount it. What we should emphasise is that our choice of index matters. Different indices focus on different parts of the distribution. Do we care more about the middle compared to the bottom of the distribution, the top compare to the middle, or the very top of the distribution (the famous 1%)? Whatever index we use, it is reasonably clear that inequality is not falling over the long term in Australia, and is a key area of policy concern.

China Hard Landing Would Hit HK, Korea, Japan Hardest – Fitch

A Chinese “hard landing” would have a significant impact on global growth and economic stability, with economies in Asia and major emerging market commodities exporters among the hardest hit, says Fitch Ratings. Besides China itself, Hong Kong, Korea and Japan would be the most affected major economies in the event of a sharp slowdown in Chinese GDP growth.

Fitch’s base case forecasts China’s economy to expand by 6.8% and 6.3% in 2015 and 2016 respectively. But in the latest Global Economic Outlook report, Fitch assessed an alternative scenario in which China’s economic growth falls below 3% in 2016 driven by a collapse in public and private investment. Our assumptions in the shock scenario included a contraction in public investment of 4% in 2016 and deceleration in consumption growth to 5.6% in 2017 from 8.3% in 2014. This would result in asset-quality deterioration with a spike in the banking system NPL ratio to 8%, a cumulative 10% depreciation in CNY/USD, a double-digit percentage decrease in foreign direct investment and a peak to trough fall in home prices of over 4%.

According to the analysis, which used Oxford Economics’ global macroeconomic model, the impact would be greatest within Asia. The resulting decline in trade combined with the regional investment exposures to China would weigh most on the export-centred economies of Hong Kong and Korea, with the cumulative reduction in GDP from the 2017 baseline amounting to 4.5pp and 4.3pp respectively. Japan would enter a deep recession, with the economy contracting in both 2016 and 2017 and its GDP down by 3.6pp by 2017 versus our base case estimates. Taiwan and Singapore would also face significant slowdowns, though not as severe, with GDP falling by 3.3pp and 3.0pp from the baseline respectively.

GDP growth in the Association of Southeast Asian Nations (ASEAN) economies of Indonesia, Malaysia, Thailand and the Philippines would be less affected by the direct feedthroughs of a China hard landing, though they would still face a cumulative GDP effect of around -2pp.

Australia would be affected to a similar extent as the aforementioned ASEAN economies. Australia has large exposures through its direct trading relationship with China, but it would be able to offset some of the negative impact through counter-cyclical policy. As a ‘AAA’-rated developed economy, Australia benefits from sound fundamentals, which will help to stabilise the economy during a broader global downturn.

At the global level, a Chinese contraction would intensify deflation risks. This is especially the case for the euro zone, where demand has remained persistently weak and inflation low. That said, developed countries other than Japan would fare relatively better than their EM counterparts. Relative to the baseline, the cumulative effect on US and euro zone GDP would be -1.5pp and -1.7pp respectively, implying average annual growth rates of around 1.7% in the US and 0.8% in the euro zone for 2016-2017.

Major emerging markets outside Asia, especially the commodities exporters such as Brazil and Russia, would be doubly impacted by the effects on energy and materials prices and the risk premium shock that would raise borrowing costs and weigh on domestic demand. However, they would not be as heavily affected as the trade-reliant economies within Asia, with a Chinese hard landing likely to reduce GDP from the baseline by around 3pp for Brazil and 2.8pp for Russia.

Means of payments and SMEs – where are we heading?

Speech by Mr Yves Mersch, Member of the Executive Board of the European Central Bank.

No economy can prosper without healthy, competitive and flourishing small and medium-sized enterprises (SMEs). They are the foundation on which the European economy is built and constitute more than 99% of all firms in the euro area. They employ more than two-thirds of the workforce and generate around 60% of value added. According to recent research, SMEs accounted for around 85% of total employment growth between 2002 and 2010 and have much higher employment growth rates than large enterprises.

The financial crisis hit the financing of SMEs particularly hard. This explains why, in recent years, the ECB and the European Commission have strongly emphasised measures that support both bank and non-bank financing of the European SME sector. These measures and policy initiatives include strengthening bank financing by facilitating longer-term financing and promoting healthier balance sheets. They also aim to diversify into non-bank financing via more efficient securitisation, better transparency and more efficient wholesale infrastructure.1 This is why the ECB strongly supports the European Commission’s initiative to establish a European capital markets union, which will allow businesses to enjoy a greater range of funding choices and help reduce the link between a firm’s location and its funding costs.

However, there are other policies that have received less public attention in relation to the competitiveness of the European SME sector, one of the most important being integration and innovation in the retail payments market, particularly for payments in euro. This is what I will focus on tonight.

2. Past achievements

Over the past years the public and private sectors have worked together to create the Single Euro Payments Area (SEPA). Regulatory measures and market developments have combined to remove the distinction between domestic and cross-border payments in euro. Retail payments have become much faster, cheaper and more secure. Instead of taking three to five days, euro credit transfers and direct debits are now executed within one business day, not only at the domestic level but also across borders. Fees for cross-border euro transactions decreased to the same level as those for domestic transactions. Last, but certainly not least, payments in general have become more secure due to stronger regulatory attention and requirements.

However, work still remains to further develop an integrated, innovative and competitive market for euro retail payments. To this end, the ECB established the Euro Retail Payments Board (ERPB) at the end of 2013. In this high-level strategic body the demand and supply sides of payment services are given equal importance. SMEs, as a key demand-side stakeholder group, are represented by UEAPME and Mr Cohen-Hadad. I am convinced that, with this collaborative governance structure, we can be both efficient and output driven.

3. What will the future bring?

Let me turn now to the future. How will the work of the Euro Retail Payments Board benefit SMEs?

First, the ECB and ERPB are monitoring the completion of SEPA migration, which is due next year, with the phasing out of national niche credit transfers and direct debits and other waivers. Furthermore, full migration to SEPA credit transfers and SEPA direct debits by non-euro area countries is being monitored. This final stage of the long process of adapting common standards for basic payment services will deliver on the promise to be able to use one single account for euro payments throughout the EU.

Second, the ERPB has called for the launch of a pan-European instant credit transfer scheme in euro. Instant payments are retail payments where the funds sent by the payer are irrevocably credited to the beneficiary’s account within seconds of the payment being initiated. Payment service providers are already working on an instant SEPA credit transfer scheme. I expect that instant payment services in euro will be made widely available to European consumers and small businesses by 2018.

The experiences of other markets – particularly the United Kingdom – show that SMEs greatly benefit from faster payment execution. Receiving and making credit transfers instantly will free up cash flow and ease working capital needs. It can also replace card, cheque or cash payments in business situations where goods or services are only delivered against immediate and irrevocable payment and where accepting or making payments with these traditional payment instruments is cumbersome.

Third, electronic invoicing has long been on the agenda of European policy-makers. The ERPB could investigate how a pan-European electronic invoicing landscape could be enriched with more efficient links to payment services. By replacing paper invoices with electronic ones and creating a seamless link between the invoicing process and payment initiation, significant resources can be freed up and used for other purposes. This requires pan-European standards and networks to ensure that as many billers and payers as possible are reached. All this will be discussed at the next meeting of the ERPB in November with a view to the direction to take.

Fourth, as many SMEs are small merchants accepting hundreds or thousands of payments every day at physical points of sale or online from consumers, the work of the ERPB in consumer card and mobile payments is particularly relevant, as this represents a rapidly growing share of the payment mix. The ERPB could focus on two areas here: i) person-to-person mobile payments enabling the convenient initiation of payments to another mobile phone user (be they consumer or merchant); and ii) contactless payments where a fast payment can be made by simply holding the mobile device or card above a merchant’s terminal.

Finally, the ERPB also oversees work on traditional technical card standardisation. Such technical standardisation will greatly contribute to a competitive card acquiring industry. In the longer term, this will lead to significantly lower costs for handling card terminals and accepting cards, especially for small merchants.

All of these initiatives aim to contribute to a more efficient and competitive landscape for euro payment services. It is vital to maintain their momentum because they come at a time when the digitalisation of communication and information technology is triggering fundamental structural changes in banking and finance. The traditional retail payments business of banks faces strong competition from financial technology (“FinTech”) companies. These are not only small start-ups but also large international enterprises. The so-called GAFAs; namely Google, Apple, Facebook and Amazon, are all offering payment services or considering doing so. While the new players bring further competition to the market, which is welcome, it is important that there is a level playing field for competition that ensures compliance with regulatory requirements and appropriate customer protection.

4. Concluding remarks

Although the contribution of retail payments integration to the competitiveness of SMEs has received less public attention than other related measures, SMEs have significantly benefitted from the creation of the Single Euro Payments Area, as well as from the ERPB initiatives that will deepen the integration achieved by SEPA and exploit the innovative potential of digitalisation.

However, there is no room for complacency. When building the retail payments infrastructure of tomorrow, we certainly need the supply side, but we also want the demand side to shape the products according to its needs. The Euro Retail Payments Board offers a unique opportunity for all stakeholders to articulate their concrete expectations and requirements. I therefore invite you to represent SMEs in the ERPB with the same enthusiasm, energy and vigour as when Etienne Marcel – the eponymous Provost of Merchants under Jean II le Bon – stood up for the small tradesmen of Paris in the 1300s.

Retail turnover rose 0.4 per cent in August 2015

The latest Australian Bureau of Statistics (ABS) Retail Trade figures show that Australian retail turnover rose 0.4 per cent in August following a fall of 0.1 per cent in July 2015, seasonally adjusted.

In seasonally adjusted terms the largest contributor to the rise was food retailing (0.6 per cent). Other retailing (1.3 per cent), department stores (1.3 per cent) and household goods retailing (0.2 per cent) also rose. There were falls in clothing, footwear and personal accessory retailing (-1.4 per cent) and cafes, restaurants and takeaway food services (-0.3 per cent).

In seasonally adjusted terms there were rises in Victoria (0.9 per cent), New South Wales (0.5 per cent), Western Australia (0.2 per cent), South Australia (0.3 per cent) and Tasmania (0.4 per cent). There were falls in Queensland (-0.2 per cent), the Northern Territory (-0.9 per cent) and the Australian Capital Territory (-0.4 per cent).

The trend estimate for Australian retail turnover rose 0.2 per cent in August 2015 following a 0.3 per cent rise in July 2015. The trend estimate for August 2015 is 4.3 per cent higher compared to August 2014.

Online retail turnover contributed 3.1 per cent to total retail turnover in original terms.

Home Sales Higher In August – HIA

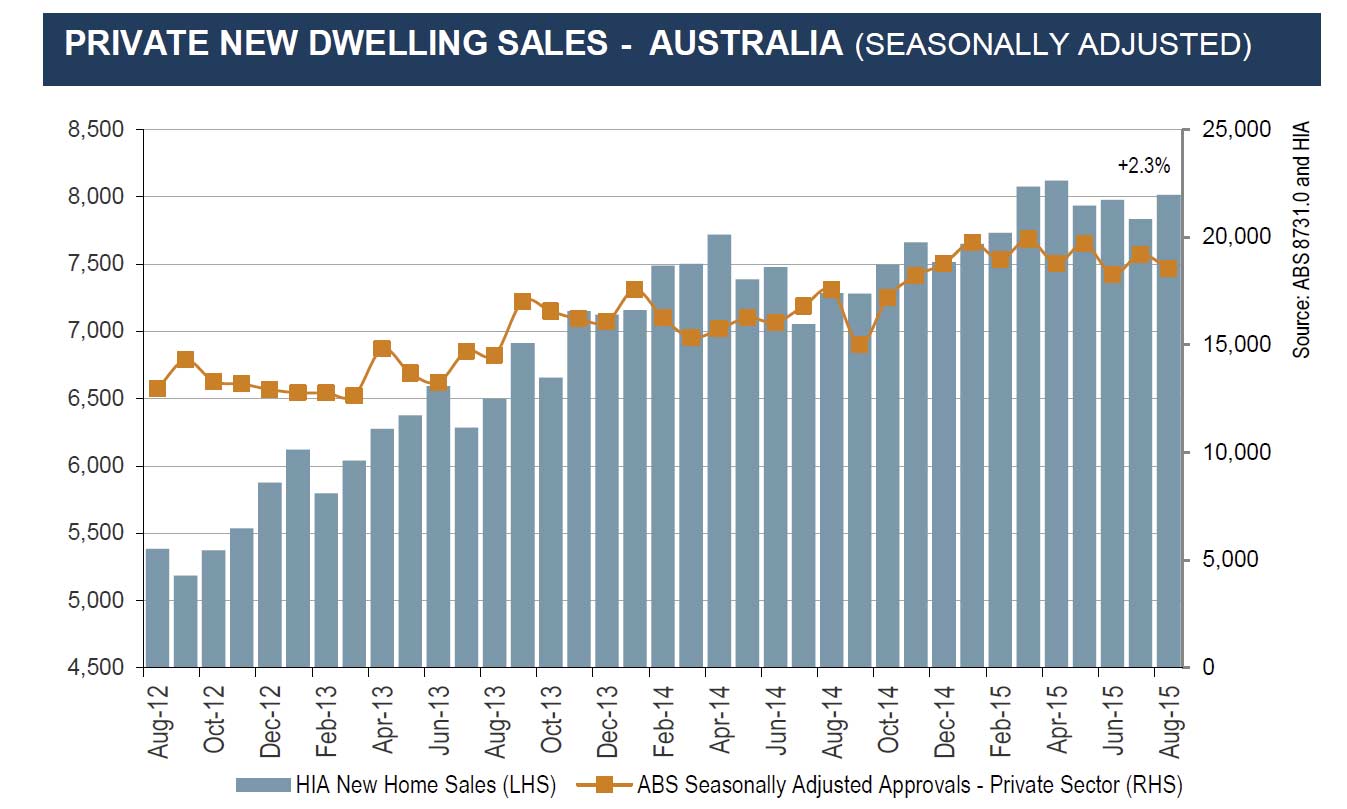
The HIA New Home Sales Report, a survey of Australia’s largest volume builders, recorded an increase in August 2015, with the level of activity only just short of the high reached in April this year. They report a decline in unit sales, but a rise in houses.

“Total seasonally adjusted new home sales increased by 2.3 per cent in August this year, driven by a 3.5 per cent rise in detached house sales,” said economist, Diwa Hopkins. “Multi-unit sales, however, declined by 1.7 per cent.”

“It is becoming increasingly apparent that total sales activity has already peaked this year, but today’s update shows that sales are remaining elevated.”

“The overall developments in both HIA New Home Sales and the equivalent ABS measure, building approvals, are consistent with our outlook for actual new home building activity in 2015/16.”

“We’re forecasting total dwelling commencements to ease back from what we expect to have been the peak level in the financial year just passed, but still remain elevated.”

Detached house sales increased by 3.5 per cent in August 2015, but were 5.1 per cent below the monthly peak that occurred back in April 2014. For ‘multi-units’, it is May 2015 that is shaping up to represent a peak in monthly sales, with declines occurring in each of the subsequent months. Multi-unit sales in August this year were down from the May level by 8.5 per cent.

In the month of August detached house sales increased in four out of the five the mainland states. Detached house sales increased by 10.2 per cent South Australia, 7.0 per cent in Queensland, 3.2 per cent in New South Wales and 3.4 per cent in Victoria. In Western Australia, detached house sales declined by 1.4 per cent.

HIA-Sales-August-2015

Are Australian House Prices Overvalued?

Within the 65 pages of the IMF report there is a comprehensive section on Australian house prices.  Housing market risks they say remain heightened. They conclude that house prices are moderately overvalued, probably around 10 percent. The problem is concentrated in Sydney and is fuelled by investor credit and interest only loans. Current rates of house price inflation imply rising overvaluation. Current efforts to rein in riskier property lending might not be sufficiently effective.

International comparisons persistently signal warnings. The level of real house prices and the house price to income ratio is high relative to the OECD average (though similar to other buoyant markets). House price inflation picked up to 7-10 percent in 2014-15—driven by rapid increases in Sydney and to a lesser extent Melbourne (prices in the resource states have fallen back in recent months). While foreign investment in real estate has increased, the main driver has been local investor lending and interest-only loans. Sydney house price to income ratios are much higher than for other cities at around 7—similar to Auckland, London, Stockholm and Vancouver.

Can the increase in house prices be explained?

  1. The housing market and financial system have changed significantly over the past two decades with a shift to low inflation, low nominal interest rates and financial liberalization which loosened credit constraints. Households’ borrowing capacity increased and they moved to a higher steady state level of indebtedness and higher house prices relative to incomes.
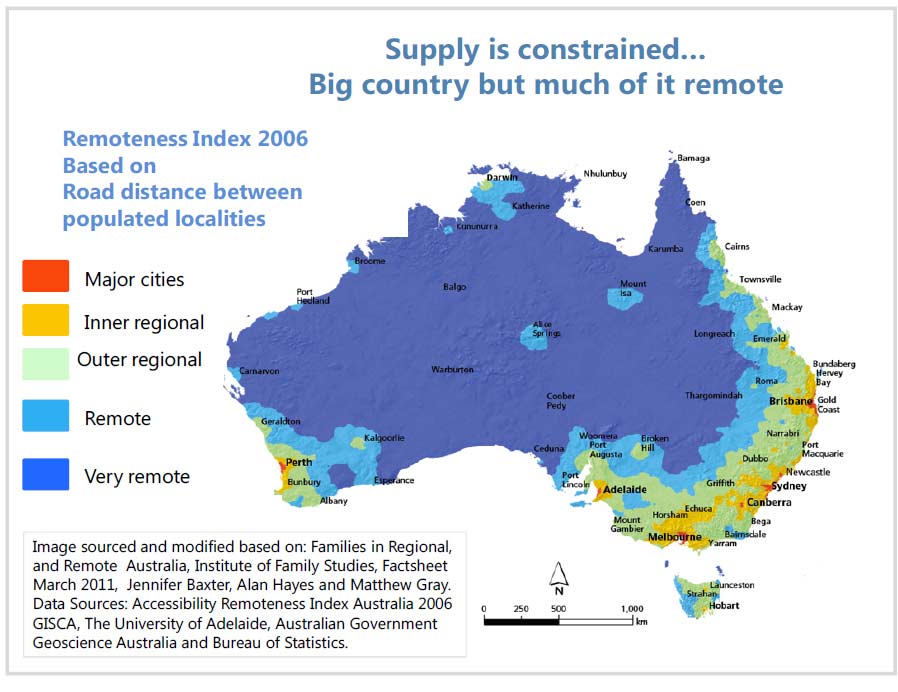
  2. Supply side constraints may also keep prices high. Although Australia is big, much of the country is remote and the population is concentrated in a few cities where there are geographical or other barriers to expansion. Population growth has also been much more rapid than for other OECD countries, whereas housing investment as a share of GDP is only at OECD average levels. Supply bottlenecks also reflect planning issues and transport restrictions.

IMF-Aust-1IMF-Aust-2Are high and rising prices a problem? There has been no generalized credit boom and lending standards are generally high (and being tightened), so financial stability risks seem contained. The run-up in house prices has also not been accompanied by a construction boom (unlike Ireland and Spain). But with already high debt and house prices, rapid house price inflation raises the risk of a sharp reversal, which would damage the macroeconomy.

Do models point to overvaluation? Estimating overvaluation is inherently difficult. Rather than relying on one model, staff used four different approaches.

  1. Statistical filter. Deviations from an HP filter suggest overvaluation of about 5 percent.
  2. Fundamentals. The standard model used in the Fund, estimated since the early 2000s, with fundamental explanatory variables—affordability, incomes, interest rates, and demographics―estimates overvaluation of around 15 percent and equilibrium growth rates around 3-4 percent.
  3. Including supply factors. A model using similar longrun fundamentals, but adding credit and the housing stock to take into account supply constraints, points to an overvaluation of around 8-10 percent.
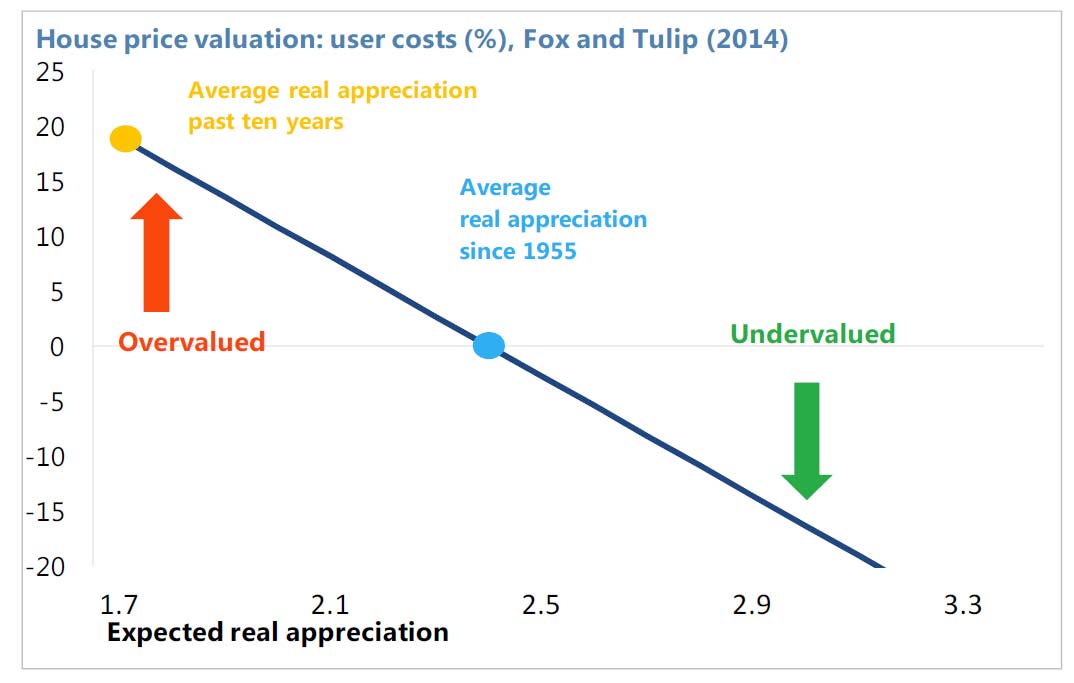
  4. User costs. Estimates of user costs (whether it is more expensive to own than to rent) suggests that renting is about as costly as buying a house based on average real appreciation since 1955 (Fox and Tulip, 2014). However, this estimate is highly sensitive to interest rates and expectations of future house price appreciation. Using a plausibly lower expected appreciation term results in an overvaluation of 10-19 percent.

IMF-Aust-3Bottom line: House prices are moderately overvalued, probably around 10 percent. The problem is concentrated in Sydney and is fuelled by investor credit and interest only loans. Current rates of house price inflation imply rising overvaluation.

In their house price modelling, they assume a  baseline projection is for a soft landing, with house price inflation slowing to a sustainable 3-4 percent, based on medium-term fundamentals. This implies no change in the estimated overvaluation and housing market risks thus remain heightened.

Current efforts to rein in riskier property lending might not be sufficiently effective. Against a backdrop of already high house prices and household debt, this could give rise to price overshooting and excessive risk taking. A sharp correction in house prices, possibly driven by Sydney, could be triggered by external conditions (e.g., a sharper slowdown in China or a rise in global risk premia), or a domestic shock to employment.

This might have wider ramifications if it affects confidence. The house price cycle could be amplified by leveraged investors looking to exit the market and a turning commercial property cycle. Though currently small, investors in self managed superannuation funds that have added geared property to their fund portfolios would also be adversely affected in a downturn. In a tail scenario, APRA’s stress tests suggest banks would probably face ratings downgrades/higher offshore funding costs and would likely resist capital ratios falling into capital conservation territory by sharply tightening credit conditions, thus transmitting and amplifying the shock to the rest of the economy.

Federal Court finds Fast Access Finance breaches National Credit Act

ASIC says that the Federal Court has found that payday lenders, Fast Access Finance Pty Ltd, Fast Access Finance (Beenleigh) Pty Ltd and Fast Access Finance (Burleigh Heads) Pty Ltd (the FAF companies) breached consumer credit laws by engaging in credit activities without holding an Australian credit licence.

ASIC claimed that the FAF companies constructed a business model which was deliberately designed to avoid the protections offered to consumers by the National Consumer Credit Protection Act 2009 (National Credit Act), including the cap on interest charges. Consumers who were seeking small value loans (of amounts generally ranging from $500 to $2,000) entered into contracts that purported to be for the purchase and sale of diamonds in order to obtain a loan. Consumers in ASIC’s case were completely unaware of the actual nature of the contracts into which they were entering and assumed that they were obtaining a traditional loan.

The Federal Court found that the true purpose of the contracts was to satisfy the consumer’s need for cash and the FAF companies’ desire to make a profit from meeting such a need. The provisions in the contracts for the sale and resale of diamonds added nothing to the transaction. The effect of these contracts was to charge interest well in excess of the 48% interest rate cap that should have applied to these types of loans. In some cases interest of over 1000% was charged.

The Court also found that the FAF companies intended to conceal the true nature of the transaction from those responsible for enforcing the interest rate cap.

Deputy Chairman Peter Kell said, ‘Consumers seeking small amounts of credit are often desperate for money, making them vulnerable to manipulation by those who seek to operate outside the law.’

‘Safeguards exist under the law to ensure people are not exploited. ASIC will act against companies which deliberately disregard their obligations under the National Credit Act.’

The matter will be listed for a further hearing, on a date to be set, in relation to the declarations sought by ASIC, civil penalties and compensation payable by the FAF companies. The maximum penalty payable by the FAF companies for engaging in credit activities without a credit licence is $1.1 million for each contravention. 

Bank Portfolio Loan Movement Analysis

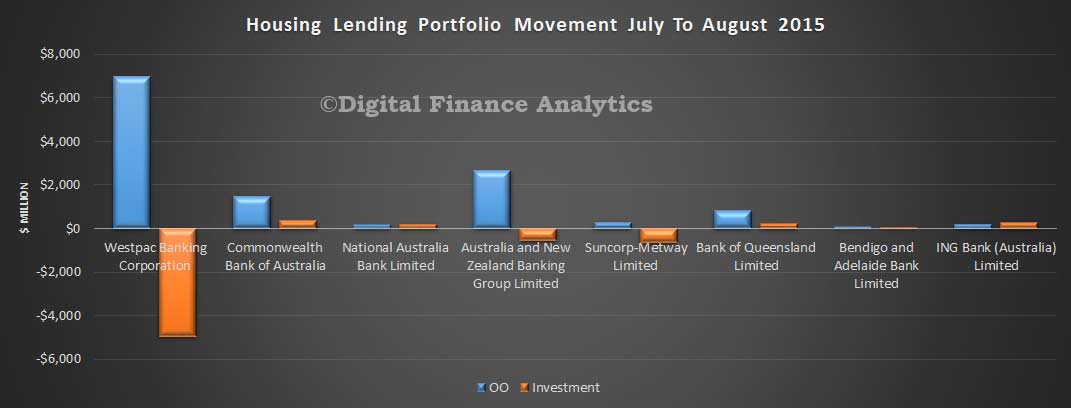
Following on from the APRA data released yesterday, today we look at the bank loan portfolio movements. Looking at home loans first, the APRA credit aggregates which focus on the ADI’s shows that the stock of home loans was $1.378 trillion, up from $1.367 trillion in July, or 0.8%. Within that, investment loans fell from $539.5 bn to $535.5 bn, down 0.7%, whilst owner occupied loans rose from $827 bn to $843 bn, up 1.9%, thanks to the ongoing reclassification. We see some significant portfolio re-balancing at Westpac between owner occupied and investment loans, continuing a trend we observed last month. We also see a relatively strong movement in owner occupied loans, as we predicted, as the focus shifts from investment lending to owner occupied loans.

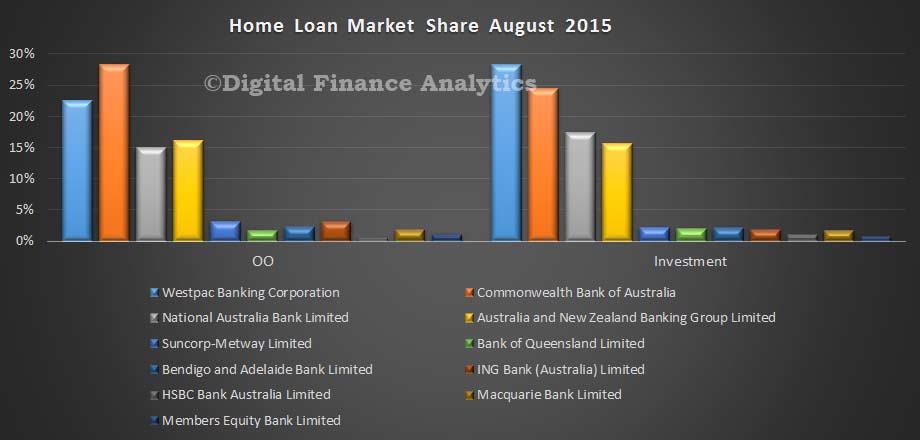
APRA-August-2015-Loan-Portfolio-MovementsThe relative portfolio shares have not changed that much, but the consequences of the Westpac moves means their relative share of investment lending is down somewhat from 28.9% to 28.2% of the market, whilst CBA moved from 24.2% to 24.4% and NAB from 17.3% to 17.4%.

APRA-Home-Lending-Shares-August-2015Looking at trend portfolio movements (which we calculate by summing the monthly movements from September 2014 to August 2015 using the APRA data, adjusted for the ANZ and NAB revisions which were announced earlier), the annual market growth for investment loans is 10%, in line with the APRA speed limit, and we see some banks above. We expect to see further revisions as we progress.

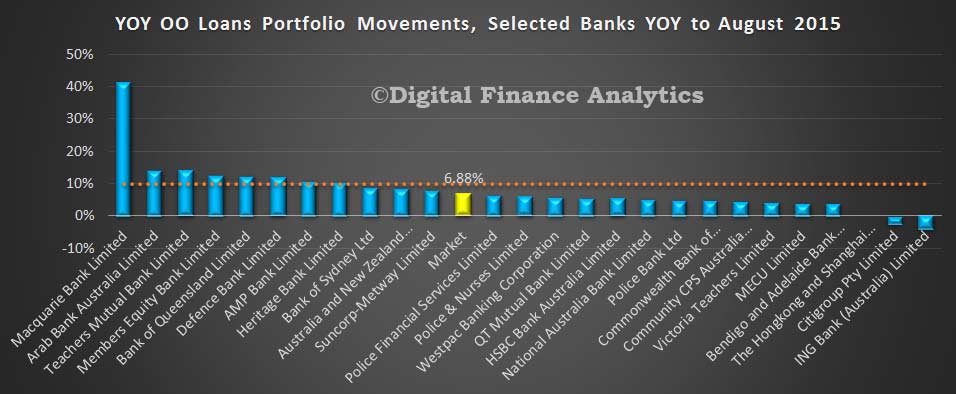
APRA-Investment-Loans-By-Lender-August-2015Looking at the owner occupied side of the ledger, average portfolio growth was 6.88%, and again we see a fair spread with some well above the 10% mark – though of course there is as yet no speed limit on owner occupied lending.

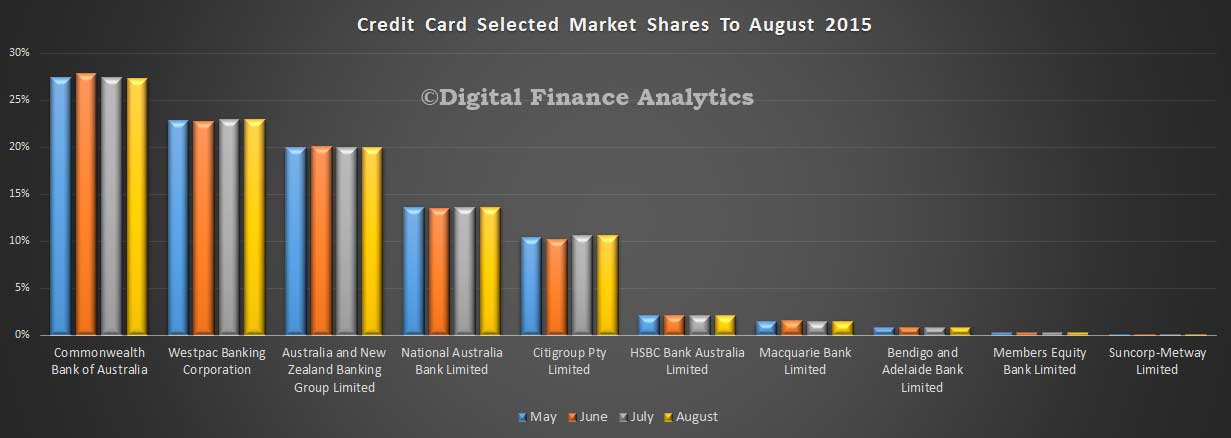
APRA-YOY-OO-Movements-August-2015Turning to credit cards, the $40.8 bn portfolio of loans hardly changed in the month of August, so the mix between providers showed no noticeable movement.

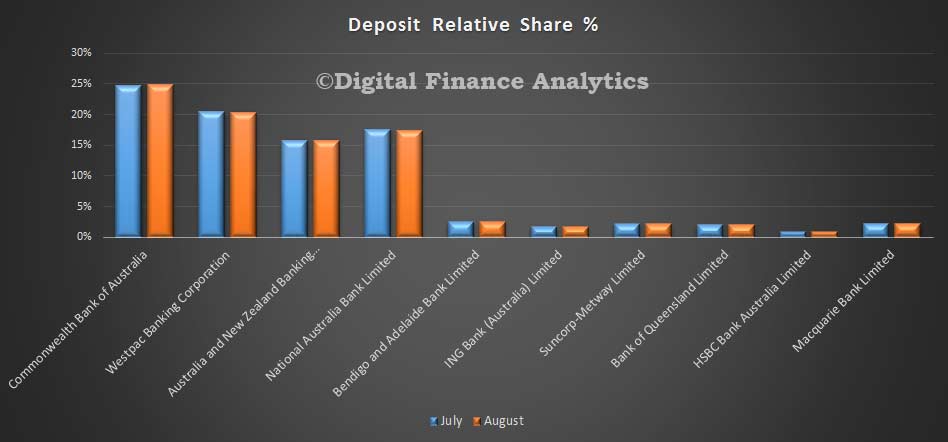
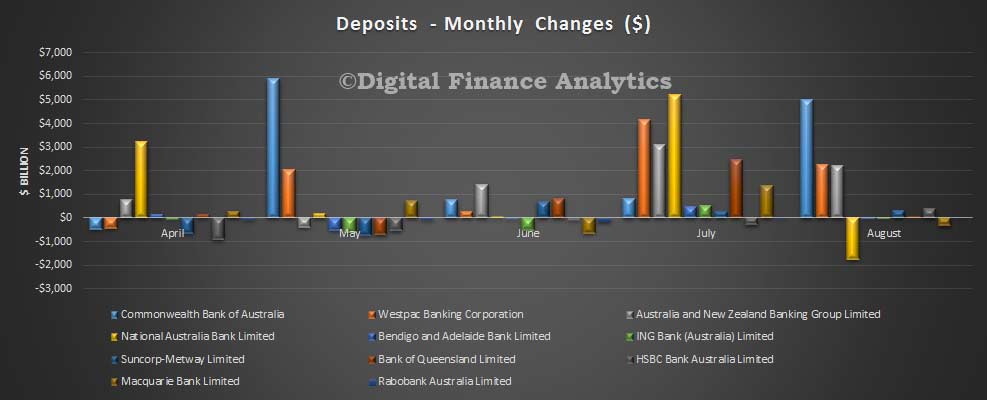
APRA-Cards-August-2015Finally, looking at deposits, there were small portfolio movements, with overall balances rising 0.6% to $1.87 trillion.

APRA-Deposits-Aug-2015  Looking at the banks, in dollar terms, NAB lost a little share, whilst CBA outperformed with an increase of $5bn in deposits. The noise in the data needs to be recognised, however, because in July, the position was somewhat reversed.

APRA-Deposit-Movements-August-2015

We also note APRA published a paper on revisions to the ADI data, APRA’s analysis shows that, in the 24 editions of MBS from January 2013 to December 2014:

  1. There were 82 reporting banks, an average 2,148 new data items published in each edition of MBS, for a two year total of 51,553 data items.
  2. there were 1,951 revisions to data items (an average of 81 data items revised per edition). There is approximately a 4.6 per cent likelihood of any data item being revised within a year from its first publication;
  3. on average, six banks (around nine per cent of all banks) resubmitted data per month that resulted in revisions to MBS;
  4. there were 557 revisions (about 29 per cent of all revisions, or 1.0 per cent of all data items) over 10 per cent and more than $100m of the original value (‘significant revisions’); and
  5. revisions to data items relating to the loans-to and deposits-from non-financial corporations were the two most significantly revised data items, together accounting for 20 per cent of all ‘significant revisions’, between January 2013 and December 2014.

Following analysis of MBS revisions, APRA intends to improve the usefulness of MBS by individually listing revisions of more than five per cent and $5m of the original value in future editions of MBS.

APRA publishes revisions to its statistics to improve the usefulness of its publications.  APRA publishes revised statistics when better source data becomes available or  occasionally, after a compilation error has been identified. Better source data typically becomes available from resubmissions of data by reporting institutions.  APRA lists ‘significant revisions’ to statistics and aims to explain the circumstances under which they were revised. Significant revisions currently include those revisions more than $100 million and over 10 per cent of the original value. These significant revisions are listed in the ‘revisions’ section of the Back Series of Monthly Banking Statistics publication.

To minimise the frequency of revisions, APRA analyses past revisions to identify potential improvements to source data and compilation techniques. Such analysis is considered international best practice. The International Monetary Fund’s (IMF’s) Data Quality Assessment Framework (DQAF) for example states that statistical agencies should ensure that “studies and analyses of revisions and/or updates are carried out and used internally to inform statistical processes.” The DQAF also recommends that “studies and analyses of revisions are made public.”

Given the substantial revisions we are currently seeing in the 2015 series, especially relating to investment and owner occupied lending, we would expect to see more details of significant changes in the future.

IMF Report On Australia Shows Work Is Needed

The IMF released their latest review of Australia. They expect growth to remain under trend to 2.8% in 2020, house prices to remain high along with household debt, household savings to fall, and the cash rate to fall before rising later. Mining investment will continue to fall, and non mining investment to rise, with a slow fall in unemployment to 5.5% by 2020. They supported the FSI recommendations for banks to hold more capital. They cautioned that if investor lending and house price inflation do not slow appreciably, these policies may need to be intensified.

On September 14, the Executive Board of the International Monetary Fund (IMF) concluded the 2015 Article IV consultation1 with Australia.

Australia has enjoyed exceptionally strong income growth for the past two decades, supported by the boom in global demand for Australia’s natural resources and strong policy frameworks. However, the economy is now facing a large transition as the mining investment boom winds down and the terms of trade has fallen back. Growth has been below trend for two years. Annualized GDP growth was around 2.2 percent in the first half of 2015, with particularly weak final domestic demand, and declining public and private investment. Capacity utilization and a soft labor market point to a sizeable output gap. Nominal wage growth is weak, contributing to low inflation.

The terms of trade has fallen sharply over the past year. Iron ore prices have fallen by more than a third and Australia’s commodities prices are down by around a quarter since mid-2014. The exchange rate has depreciated further in recent months following news about economic and financial market developments in China. This has significantly reduced the likely degree of exchange rate overvaluation and should help support activity. Although the current account deficit narrowed to 2.8 percent of GDP in 2014 as mining-related imports declined, it is expected to widen somewhat in 2015.

With subdued inflation pressure, and a weaker outlook, the Reserve Bank of Australia (RBA) cut its policy rate by a further 50bps in the first half of 2015 to 2 percent. While housing investment has picked up strongly, consumer confidence indicators and investment expectations remain muted. Consumption growth has also been moderate reflecting weak income growth. But low interest rates have pushed up asset prices. Overall house price inflation is close to 10 percent, but is around 18 percent in Sydney. Buoyant housing investor lending has recently prompted regulatory action to reinforce sound residential mortgage lending practices.

Fiscal consolidation has become more difficult and public debt is rising, albeit from a low level. Lower export prices and weak wage growth are denting nominal tax revenues; unemployment is adding to expenditures. The national fiscal deficit remained at 3 percent in fiscal year

(FY, July–June) 2014/15, broadly unchanged from the previous year. The FY 2015/16 Budget projects a return to surplus in 2019–20. The combination of tightening by the States and the commonwealth implies an improvement in the national cyclically-adjusted balance by some 0.7 of a percent of GDP on average over the next three years.

Executive Board Assessment

Executive Directors commended Australia’s strong economic performance over the past two decades, which has been underpinned by sound policies, the flexible exchange rate regime, earlier structural reforms, and a boom in the global demand for resources. They noted, however, that declining investment in mining and a sharp fall in the terms of trade are posing macroeconomic challenges, while potential growth is likely to slow in the period ahead. Accordingly, Directors agreed that continued efforts to support aggregate demand and raise productivity will be critical in transitioning to a broader-based and high growth path.

Directors noted that a supportive policy mix is needed to facilitate the structural changes underway. With a still sizeable output gap and subdued inflation, most Directors agreed that monetary policy is appropriately accommodative and could be eased further if the cyclical rebound disappoints, provided financial risks remain contained. Directors also noted that the floating exchange rate provides an important buffer for the economy.

Directors broadly agreed that a small surplus should remain a longer-term anchor of fiscal policy. In this regard, many Directors supported the authorities’ planned pace of adjustment, which they viewed as striking the right balance between supporting near-term activity and addressing longer-term spending commitments. Some Directors, however, considered that consolidation could be somewhat less frontloaded, given ample fiscal space. Directors broadly concurred that boosting public investment would support demand, take pressure off monetary policy, and insure against downside risks. In this context, they welcomed the authorities’ continuing to establish a pipeline of high-quality projects.

Directors highlighted that maintaining income growth at past rates and boosting potential growth would require higher productivity growth. They expressed confidence that this could be achieved, given Australia’s strong institutions, flexible economy, track record of undertaking comprehensive structural reforms, and the opportunities created by Asia’s rapid growth. Nonetheless, further reforms in a variety of areas will be required. In this regard, Directors noted the findings of the Competition Policy Review and looked forward to their implementation. Furthermore, addressing infrastructure needs will relieve bottlenecks and housing supply constraints. Directors also encouraged a shift toward more efficient taxes, while ensuring fairness.

Directors supported the recommendations of the Financial System Inquiry. They noted that while banks are sound and profitable, significantly higher capital would be needed in a severe adverse scenario to ensure a fully-functioning system. Accordingly, they welcomed the authorities’ commitment to make banks’ capital “unquestionably strong” over time. To address risks in the housing market, Directors supported targeted action by the regulator. They cautioned that if investor lending and house price inflation do not slow appreciably, these policies may need to be intensified.