Yellow Brick Road has announced 2015 results, and a restructure to grow their loan book to $100 billion by 2020. The core emphasis is to provide rounded financial advice to middle Australia, blending from mortgage selection through to wealth management.
In FY 2015 Yellow Brick Road Holdings (the Company) was focused on acquisition, with the purchase of Vow and Resi occurring in Q1 and the integration of these businesses through the balance of the year.
During the final three quarters of FY2015, the scaled up business achieved three consecutive operating cash surpluses totalling $3.93m.
In FY2016, the Company has seen an opportunity to acquire significant scale organically, as market noise around home loan rates draws consumer attention to their mortgages. Consequently, we have made a strategic decision to invest in a major market-share push, through increased Yellow Brick Road marketing activity. Substantial additional leverage is applied to this investment through the Company’s relationship with key investor Nine Entertainment Co, owner of the Nine Network. As expected, this marketing investment has generated an operating cash deficit in Q2 FY2016 of $1.70m. On a normalised basis, this operating cash deficit was $1.32m, an increase of $0.62m on last quarter which is roughly in line with the $0.64m increase in marketing spend. The Company retains more than sufficient funding to support this marketing investment. At the end of the quarter the Company had cash and undrawn finance facilities totalling $13.5m. Also as expected, this marketing investment is delivering significant uplift in new customer introductions, with Q2 FY2016 leads up +299% vs prior corresponding period (PCP). These began flowing through to loan settlements in December (+51% vs December 2014).
YBR reported Q2 FY2016 settlements up 38% vs PCP to $4.2bn. The group loan book ended the quarter at $33.9bn up 22% PCP. Overall funds under management was up 34% PCP to $700m.
A recent interview with Matt Lawler covers the business strategy and 2015 results.
Mark Bouris has announced a major restructure of the Yellow Brick Road group as it strives to hit a $100 billion loan book by 2020.
The restructure aims to streamline the group by better aligning the company’s core business units – lending and wealth management.
The former leadership structure was shaped by two separate business entities: Vow Financial, headed by CEO Tim Brown and YBR, headed by CEO Matt Lawler. The new business structure will integrate the two business entities with Brown and Lawler operating across the entire group in the two strategic verticals – lending and wealth management – rather than operating separately across Vow and YBR.
As a result, Brown has been appointed to the newly created CEO – Lending and Lawler has been appointed to the newly created CEO – Wealth Management. Chief commercial officer (CCO) Scott Graham will support Lawler and Brown, continuing to oversee commercial strategy, marketing, media and investor relations.
“Our intention in 2016 is to double down on our wealth activities and maintain the momentum in our lending businesses. As a result I have re-appointed our current CEOs’ portfolios to align with the two business units and reflect their individual expertise and strengths,” YBR executive chairman Mark Bouris said.
According to Bouris, this more streamlined and cooperative approach will allow the finance giant to reach its goal of becoming the leading non-bank financial services company in Australia. This entails hitting a $100 billion loan book by 2020, as well as achieving 30% wealth clients and reaching 300 branded branches and 1,000 broker groups in the same time frame.
“Our company goals are ambitious but with the new structure in place we will be well-placed to achieve them. I’m confident these leaders have the drive, experience and knowledge to propel Yellow Brick Road Holdings forward towards our big objective to become the leading non-bank financial services company in Australia,” Bouris said.
Speaking to Australian Broker, CEO – Lending Tim Brown said his role will be to ensure both YBR and Vow brokers are well-placed to continue to gain market share.
“We have really enjoyed phenomenal growth over the last three or four years in both YBR and Vow, so part of my role is to make sure we continue that growth in a more challenging environment with a slowing property market, and continue to build the quality of our brokers and our licensees.
“We have no doubt that we can continue to gain market share, we have a great offering in both businesses and we will continue to push those offerings.”
Brown said the group has a number of new initiatives in the works, but a major focus will be around debt management.
“The RBA and APRA are concerned about the level of debt that people are taking on and we want to be at the forefront of that.”
CEO – Wealth Management Matt Lawler told Australian Broker that his priority will be to make wealth management and financial planning capabilities accessible and flexible across in the group.
“[My strategy] is probably two-fold because we have been on the wealth management journey with the Yellow Brick Road business for a few years now and we have had success in concentrated areas around Australia. The real focus for YBR is to make sure there is comprehensive wealth management right across all branches – it is really about embedding wealth management into every branch right around the country.
“Vow is very early on the wealth management journey so the focus with the Vow business is to make sure everybody is aware of the opportunities that present themselves from a wealth management point of view.
“That will be everything from getting every broker access to very simple products, such as simple insurance and simple investment products, right through to a smaller number of Vow brokers who have expressed an interest in fully implementing a financial planning capability in their business.”
There’s a housing crisis engulfing the UK, and London is at its epicentre. In his recent vow to regenerate over 100 so-called “sink estates”, David Cameron would have us understand that public housing has failed: that the result is poor people, living in poorly designed homes, that were poorly managed. But this version of history is not definitive – nor even particularly accurate.
So what can history tell us about what works and what doesn’t, when it comes to housing? As planners and politicians cast about for solutions to the current crisis, the answer may well be found at their feet – or rather, under them.
In 1892, parliament realised that the building of the Blackwall Tunnel would require hundreds of homes to be demolished. This resulted in a new act of parliament, which stated that no work could commence on the tunnel until those evicted had been rehoused. And so, with private builders unable to supply these new homes, the first council housing in London was built.
But while the new estates sheltered those displaced by construction, their rent was still relatively expensive, so the nation’s poor and vulnerable remained in the private rented sector. So-called “slum landlords” routinely exploited the high demand for housing, leaving vulnerable tenants with substandard and overcrowded accommodation.
The pioneers of housing philanthropy – Joseph Rowntree, George Peabody and Octavia Hill, to name a few – battled to tackle poor housing conditions, homelessness and poverty. But it was often difficult to attract the required support from investors for philanthropic housing projects, when the alternative profits from being a slum landlord were so high.
Meanwhile, the government’s view was that – whatever the solution to the urban housing crisis may be – it most certainly was not state-owned housing. The parallels with 2016 are obvious.
Search for solutions
But all that rapidly changed in the first half of the 20th century – particularly following World War I and World War II – as successive governments took greater responsibility for the social welfare of citizens. Building programmes were supported by government grants and subsidies, which allowed rents to drop below market levels and made housing available to lower income households.
The vision of Anuerin Bevan – a key architect of the NHS – was that council housing, owned and managed by local authorities and built to a high standard, would be home to a diverse range of social classes. Bevan’s vision was not achieved in its entirety: some architectural design and building materials did not meet the needs of residents. Even so, by the 1960s, more than 500,000 flats had been added to the housing stock in London alone.
From the late 1970s, council housing was seen as increasingly problematic. As well as an ideological shift away from state provision, the government had concerns about the cost of maintaining council-owned houses, and the higher concentration of poor and vulnerable citizens living in them. It appeared that the 20th century’s use of council housing to provide accommodation for lower income households would not be a 21st-century solution.
Instead, the Thatcher government’s Right to Buy policy for council tenants sought to cement the UK as a nation of home owners. As well as being sold off, council housing stock was transferred to housing associations or arms length management organisations. Together with housing cooperatives and mutuals, these new arrangements became known as “social housing” and “registered social landlords”.
The idea was that housing associations would be able to borrow on the markets to invest in their housing stock – making them less dependent on government funding – and that tenants would have a strong influence about housing management decisions. Tenant participation was certainly strengthened in all forms of social housing, particularly where associations were local and community-based. Greater private investment was also secured to enhance housing quality.
Yesterday’s issues today
In 2010, the coalition government began referring to “registered providers of housing”, dropping the “social” altogether. That said, it should be noted that in other countries in the UK, housing policy has moved in different directions since the issue was devolved to the governments of Scotland, Northern Ireland and Wales.
Now, the Conservative government is introducing the Right to Buy for housing association tenants, as well as implementing fixed-term tenancies and the policy that tenants on higher incomes should pay more rent or leave. This all sounds like the final death knell for mixed income, long-term and secure public housing. In its place comes “affordable housing” – a term which is stretched to describe homes costing up to £450,000.
The current housing crisis is displacing lower income families from many parts of our cities. Young people have much worse housing prospects than their parents. Recent research says that in less than ten years time, only the rich will own their homes. And new cases of slum landlords have been reported in London. It is 2016 but, when it comes to housing, in many ways it could actually be 1891.
The key difference now is that we can look to the past for lessons. We have learned that private developers and landlords cannot be the entire solution. We know how to deliver very large scale housing programmes in periods of debt and austerity. And we can do so again now – while avoiding the pitfalls – with a diversity of social housing models and new roles for private developers, landlords and investors.
Author: John Flint, Professor of Town and Regional Planning, University of Sheffield
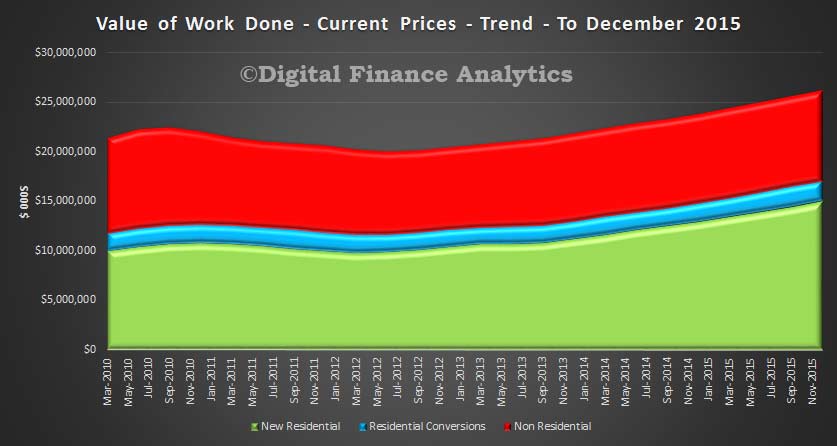
The preliminary ABS data on construction work done, released today to December shows that the trend estimate for total construction work done fell 1.6% in the December quarter 2015 whilst the the seasonally adjusted estimate for total construction work done fell 3.6% to $48,413.4m in the December quarter.
However, the trend estimate for total building work done rose 1.0% in the December quarter, with non-residential building work done rising 0.3% and residential building work up 1.4%. The seasonally adjusted estimate of total building work done rose 2.7% to $24,990.2m in the December quarter.
In contrast, the trend estimate for engineering work done fell 3.9% in the December quarter and the seasonally adjusted estimate for engineering work done fell 9.5% to $23,423.3m in the December quarter. So growth continues to rely on the housing sector.
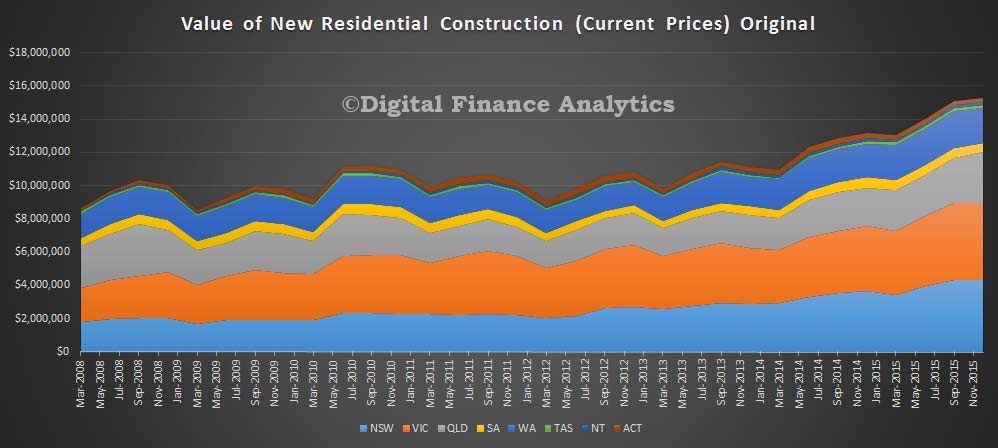
The state by state data on residential construction (original data, so no smoothing) shows some significant movements.
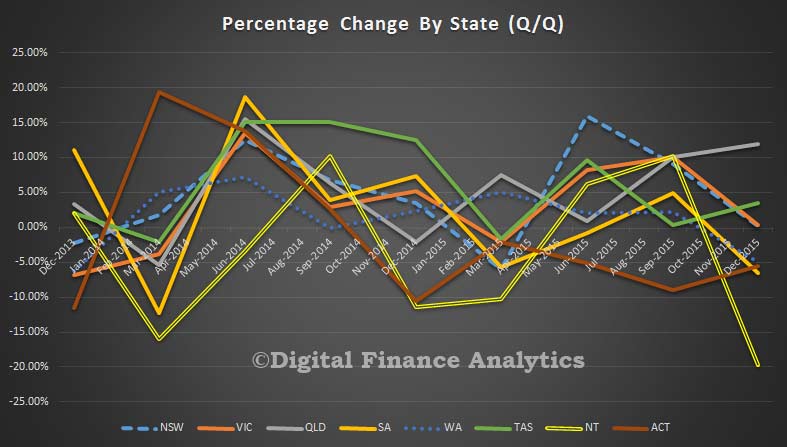
In NSW, total new residential construction rose 0.21%, whilst VIC rose 0.28%. Both states are suggesting slowing momentum. This is in contrast to QLD which has shown growth of more than 10% the past two quarters. SA dropped 6.5% (reversed the 4.9% movement in the prior quarter) whilst WA fell 5%, the first fall since 2013.
Data from TAS, NT and ACT are more volatile so probably less significant, with NT falling 19.7% (after a 10% rise last time), ACT 5.6% (the fifth consecutive quarterly fall) and TAS rising 3.5%.
Google had barely dipped a toe in the mortgage business, but it appears the tech giant is getting out.
Last November, Google launched Google Compare for mortgages, an online tool that allowed home buyers to find and compare home loans. The product was initially available only in California, and joined other Google Compare products that allowed consumers to find and compare credit cards and various types of insurance. There was talk that Google Compare could have eventually entered the Australian market as well.
Google didn’t actually fund mortgages, but it did register as a licensed mortgage broker, according to a CNN report. The company had hoped to use its global reach to provide consumers with niche products and financial services, according to a Wall Street Journal report.
But it appears the Compare product line hasn’t been as successful as the search engine titan had hoped. According to the Journal, Google struggled to sell ads on Compare – and the largest lenders and insurers simply declined to come on board.
In an email acquired by the website Search Engine Land, Google informed its partners that all Compare products – mortgage, insurance and credit card – would begin winding down immediately and shutter for good on March 23.
“Despite people turning to Google for financial services information, the Google Compare service itself hasn’t driven the success we hoped for,” the email stated. “We greatly appreciate your partnership and understand that this decision will be disappointing to some. But after a lot of careful consideration, we’ve decided that focusing more intently on AdWords and future innovations will enable us to provide fresh, comprehensive answers to Google users, and to provide our financial services partners with the best return on investment.”
The Compare site was always a risk. According to a Fox Business report, analysts warned at the outset that the product, by allowing consumers to buy mortgages and insurance policies directly, had the potential to anger lenders and insurers who were major advertising clients of Google.
Google has not yet officially commented on the shutdown.
Google’s lead generation product known as Google Compare, will start sunsetting this week.
In an email sent to partners and acquired by Search Engine Land, the Google Compare Team told Compare partners on Monday night that the product will start to wind down on Tuesday, February 23, 2016. Google Compare will shut down completely in both the US and UK — the two markets where Compare is offered — one month later on March 23.
The email to Compare partners:
From: Google Compare Team Subject: An Update on Google Compare
Dear Partner,
Beginning on February 23, 2016, we will start ramping down the Google Compare product, which is currently live in both the US and UK. We plan to terminate the service as of March 23, 2016. As you know, Google Compare (formerly Google Advisor in the U.S.) has been a specialized, standalone service that enables consumers to get quotes from a number of providers for financial products such as car and travel insurance, credit cards and mortgages.
Despite people turning to Google for financial services information, the Google Compare service itself hasn’t driven the success we hoped for. We greatly appreciate your partnership and understand that this decision will be disappointing to some. But after a lot of careful consideration, we’ve decided that focusing more intently on AdWords and future innovations will enable us to provide fresh, comprehensive answers to Google users, and to provide our financial services partners with the best return on investment.
We’re grateful for all the feedback that you have provided over the course of this product’s development, and we are looking forward to partnering with you to achieve greater success in the future.
We will work with you during this transition and beyond. Please reach out to your Google representative if you have any questions and to discuss the next steps.
The Google Compare Team
Google has confirmed the email’s authenticity.
The company only recently began rebuilding the Compare product from the ashes of the Advisor program in the US. The single piece left standing from that initial effort was the credit card offering — savings accounts, CDs and mortgages had all discontinued. Compare for Auto Insurance launched just last March, starting in California. Then Google relaunched Compare for Mortgage quotes in November with Zillow and Lending Tree among the launch partners. Both of those relaunches had limited roll outs. In the UK, Google Compare has been running since 2012 for car insurance, mortgage rates, credit cards and travel insurance.
A Google spokesperson told Search Engine Land that while searches on these queries remained high, the product didn’t get the traction it hoped for and revenue was minimal. That’s in part due to the limited availability of the products in both the US and the UK.
In the UK, the Compare product also came under scrutiny in 2014 by the Financial Conduct Authority, the UK financial services industry regulator, when comparison sites complained Google was competing unfairly by placing its own product at the top of the search results. However, any legal concerns did not play a role in the decision to close Compare, we’re told.
What’s next? Google says the focus will primarily be on AdWords and transitioning partners to standard ad products. However, it may still focus on the space and look at new product avenues.
While the move will come as a surprise to many outside the company, apparently internally this decision to terminate Compare is not coming as a shock. The Google spokesperson said the company will help Googlers currently working on Compare find new roles within the company.
Research from the USA highlights the fact that when house prices fall, and household debt is high, the rise in defaults is more correlated to the number of households falling behind in their mortgage payments that the debts of those already in default.
The large decrease in US house prices between 2006 and 2011 led to a dramatic increase in mortgage debt defaults. Since then, the share of mortgage debt in default has decreased significantly and is now close to the pre-2006 level. In this essay, we argue that these fluctuations are predominantly the consequence of changes in the number of households falling behind in their mortgage payments (the extensive margin) and not changes in the amount of debt of those in default (the intensive margin). On average, the extensive margin accounts for 78 percent of the increase in the 2006-09 period and 93 percent of the decrease in the 2011-15 period. This information may be useful in designing prudential policies to mitigate mortgage default.
The analysis is performed using data from the Federal Reserve Bank of New York Consumer Credit Panel/Equifax. In our measure of default, we consider all households with mortgage payments 120 or more days late. Figure 1 shows the share of mortgage debt in default, which fluctuated between 0.7 percent and 1 percent in the 1999-2006 period and then jumped to 7.5 percent in 2009. The figure also shows the evolution of house prices, whose collapse coincided with increasing mortgage defaults. In a recent article, Hatchondo, Martinez, and Sánchez (2015) show how these two series are related: A rapid decrease in house prices causes a sharp increase in mortgage defaults because more households find themselves with negative home equity (“under water”), and some of these households find it beneficial to default after a negative shock to income (i.e., unemployment).
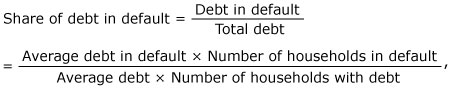
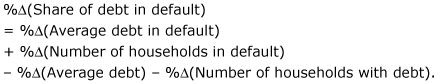
We decompose the changes in the share of debt in default into changes in four different components: average debt in default, number of households in default, average debt, and number of households with debt. Basically, since
we can compute the percentage change (%∆) in the share of debt in default as follows:
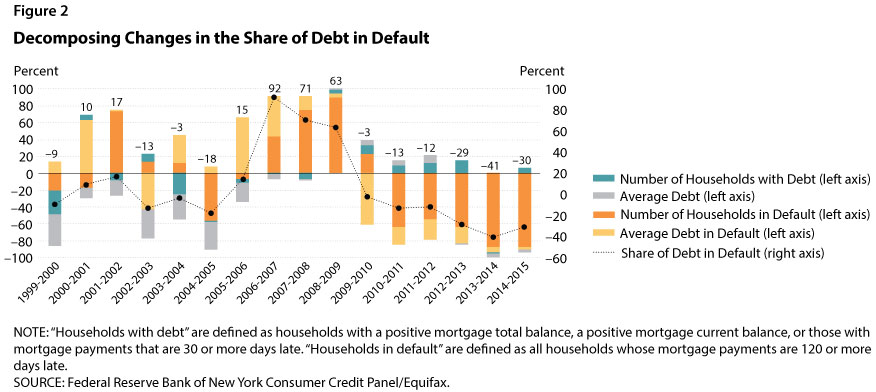
Figure 2 shows the results of the decomposition by year; the four colors in each column represent the changes in the four components. The percentage value (shown on the left vertical axis) illustrates the change in the share of debt in default generated by the changes in a particular component. According to the previous equations, the summation of changes in the four components equals the changes in the share of debt in default (represented by the values for the black dots as shown on the right axis). For example, the black dot for 2006-07 has a value of 92, which indicates that the share of debt in default increased by 92 percent in that time period.
There are three interesting findings. First, and most importantly, we find that fluctuations in the number of households in default accounted for most of the fluctuations in the share of debt in default (shown by the size of the orange part of the bars in Figure 2). The share of households in default was very large not only for the years when defaults were increasing (2006 to 2009), but also for the subsequent years when the share of debt in default decreased slowly but steadily. The changes in the number of households in default confirm our earlier claim that the drastic decline in house prices between 2006 and 2009 caused negative home equity for more households. For some of these households a negative income shock triggered default, thus leading to the sharp increase in mortgage debt default. Another reason for this pattern is the delay in foreclosure proceedings that started during the Great Recession. Chan et al. (2015) show that borrowers’ knowledge of a possible long delay between the formal notice of foreclosure and the actual foreclosure sale date affects the likelihood of default: Borrowers who anticipate a longer period of “free rent” have a greater incentive to default on their mortgages.
Second, our results indicate that from 2003 to 2007 the average amount of debt (the gray part of the bars in Figure 2) exerted downward pressure on the share of debt in default. That is, since the average amount of debt was increasing, if the other three components had not increased, the share of debt in default would have decreased.
Finally, we find that the average amount of debt in default (the yellow part of the bars in Figure 2) was important in the 2006-08 period. This finding indicates that part of the increase in the share of debt in default during that period was actually due to an increase in the amount of the debt of households in default. This increase is in line with the fact that the decline in house prices affected households with larger debt (not necessarily subprime loans) that were not falling into default before 2006. When house prices plummeted in 2006, more households from this group defaulted. Later in the recession, the importance of the average amount of debt was overtaken by the number of households in default as more and more households with similar characteristics chose to default.
To summarize, the rapid increases in mortgage debt in default between 2006 and 2011 captured the attention of the public, policymakers, and researchers. It is important to understand the main forces driving the default increase, especially in designing prudential policies that minimize mortgage default such as those analyzed by Hatchondo, Martinez, and Sánchez (2015). The decomposition exercise in this essay suggests that the evolution of the share of mortgage debt in default can be accounted for mostly by changes in the number of households in default rather than changes in the overall amount of mortgage debt and the number of households with mortgages. Changes in the amount of debt in default also played a nonnegligible role, especially during the pre-crisis to early crisis periods.
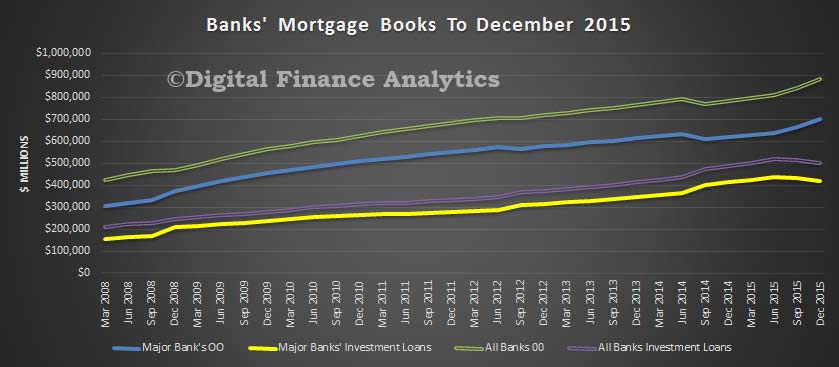
APRA has released the quarterly real estate data for the banks in Australia to December 2015. There are some strong signs that the regulatory intervention has changed the profile of loans being written, despite overall significant growth in loan balances on book.
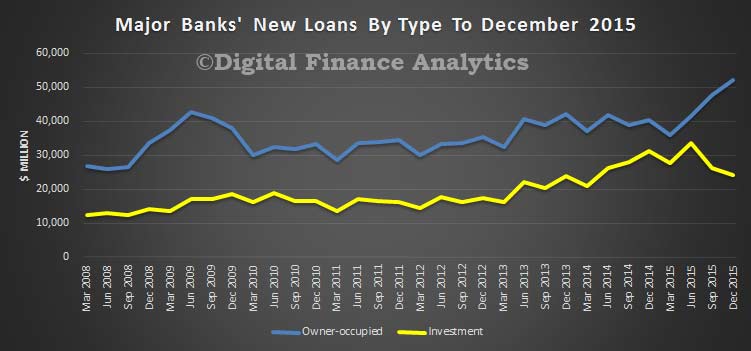
Total loans on book to December were a record $1.38 trillion, of which $1.12 trillion – or 80% are with the big four. Within that, 36% of loans were for investment purposes, the remainder owner occupied loans. The trend shows the significant rise in owner occupied loans being written (explained by a rise in refinances), whilst investment loans have fallen. This is a direct response to the regulators intervention. But note, total loans on book are still rising.
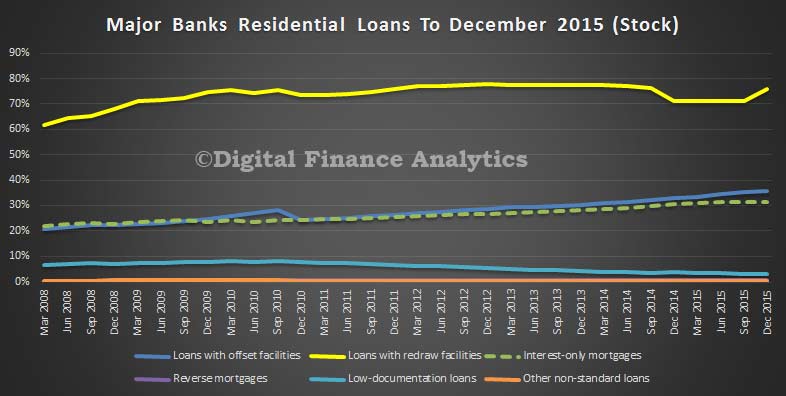
Because the big four have the lions share of the market, the rest of the analysis will look at their portfolio in more detail. For example, looking at loan stock, we see a rise in the proportion of loans with a re-draw facility (75.7%), Loan with offsets continue to rise, reaching 35.8% and interest only loans have slipped slightly to 31.4%, another demonstration of regulator intervention (they have asked banks to tighten their lending criteria and ensure consideration of repayment options for interest only loans). Reverse mortgages remain static as a percentage of book (0.6%), and low-doc loans continue to fall (2.9%).
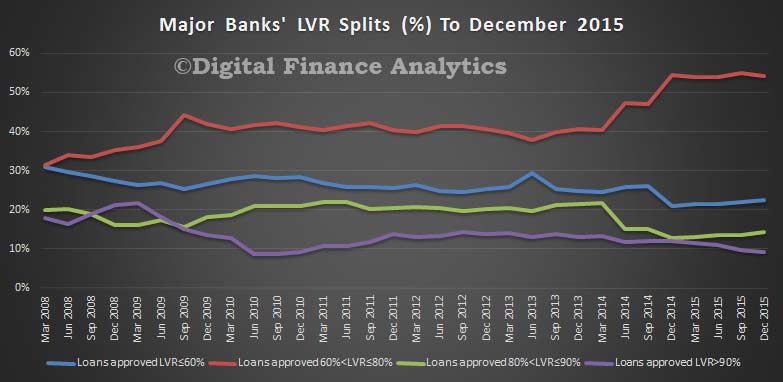
The loan to value mix has changed, again thanks to regulatory guidance, with the proportion of new loans above 90% LVR falling to 9.1%, from a high of 21.6% in 2009. Loans with an LVR of between 80% and 90% have fallen to 14.2%, from a high of 22% in 2011. Once again, we see a change in the mix thanks to regulatory guidance, and also thanks to a lift in refinance of existing loans, which tend to have a lower LVR. The portfolios are being de-risked.
Another demonstration of de-risking is the lift in new owner occupied loans, and a fall in investment loans to 31.7% of new loans written.
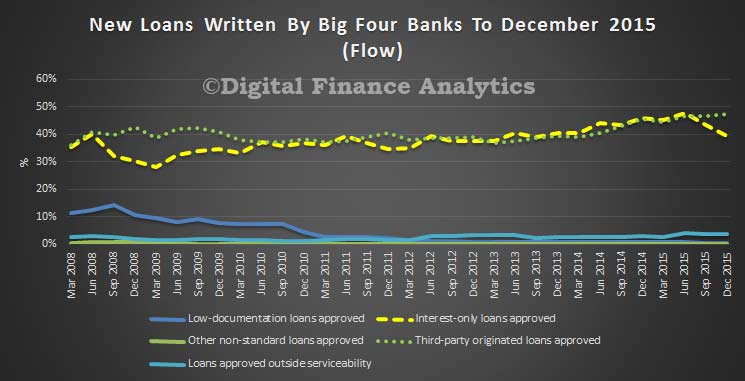
If we look at interest only loans, we see a fall to 39.5% of new loans written (the high was 47.8% just 6 months before), so we see the hand of the regulator in play. However 3.7% of loans were outside normal serviceability guidelines, just off its peak in June 2015. Finally, 47.4% of new loans have been originated from the broker channel, another record. This is also true for all banks, and it shows that brokers are doing well in the new owner-occupied and refinance ridden environment.
So, overall, make no mistake home lending is still growing, despite regulatory guidance, thanks to the rise in owner occupied loans. This means that the banks will be able to continue to grow their books, and maintain their profitability. No surprise then that the big four are all fighting hard for new OO loans, and are discounting heavily to write business. It is too soon to judge whether the portfolios have really been de-risked, given the sky high household debt this represents, and a potential funding crunch the banks are facing.
The Australian payments system is evolving, both in terms of some innovative new payment instruments that are on their way and the declining use of some of our older or legacy payment instruments. Tony Richards RBA Head of Payments Policy Department RBA, spoke at the Payments Innovation 2016 Conference on this evolution.
There is a lot happening in the payments industry at present, so my sense is that it would be premature to have a serious discussion about possibly phasing out cheques before the implementation of the New Payments Platform (NPP), which is scheduled to begin operations in late 2017. But if this conference was to revisit this issue in early 2018 with the NPP up and running, it should find significant new payments functionality in place. This will include the ability for end-users to make real-time transfers with immediate availability of funds, to make such transfers on a 24/7 basis, to attach data or documents with payments or payment requests, and to send funds without knowing the recipient’s BSB and account number. These are all aspects that match or exceed particular attributes of cheques.
In addition, by early 2018 another two years will have passed and there will no doubt have been a significant further decline – based on current trends, a further 30 per cent or so – in cheque usage.
By that point, more organisations and individuals will have further reduced their cheque usage. The Bank has recently been doing some liaison with payment system end-users in our Payments Consultation Group and has heard some impressive accounts about how some of the major Commonwealth government departments and some large corporates have largely moved away from the use of cheques. Cheque usage in the superannuation industry has also fallen very significantly as part of the SuperStream reforms.
A shift away from the use of bank cheques is also underway in property settlements. On average, there are around 40 000 property transactions in Australia each month, plus a significant number of refinancings, with most of these requiring at least a couple of cheques for settlement. However, starting in late 2014 and after much preparatory work, electronic conveyancing and settlement is now feasible. This is being arranged by Property Exchange Australia Ltd (an initiative that includes several state governments and a number of financial institutions), with interbank settlement occurring in RITS, the Reserve Bank’s real-time gross settlement system. Volumes have risen steadily and by late 2015 the number of property batches settled in RITS – each batch typically corresponds to a single transaction or refinancing – had reached nearly 4 000 per month. This trend is expected to continue.
In addition, the Bank’s Consumer Use Survey indicates that usage of cheques is falling rapidly for households of all ages. Our survey from late 2013 confirmed that older households continue to use cheques more than younger ones. However, older households are also reducing their use of cheques significantly. And with more and more older households now using the internet, their use of cheques is likely to continue falling. Indeed, I’m sure we all have a story about an older family member or friend who has recently bought or received a tablet or notebook and discovered the benefits of being online.
Graph 8
Graph 9
We will get a further reading on households’ use of cheques and other payment instruments in the Bank’s next Consumer Use Survey, which – if we follow the timetable of recent surveys – will be published in the first half of next year based on data collected late this year.
More broadly, as the industry starts to think about options for the cheque system, it will be important to make sure that those parts of the community that still use cheques are fully consulted so that we can be sure that their payment needs are met by other instruments. This is likely to involve consultations with organisations representing older age groups, the non-profit sector and those in rural Australia.
Cash
Discussions about the declining use of cheques sometimes also touch upon the declining use of cash.
Because transactions involving cash typically do not involve a financial institution, data for the use of cash are actually quite limited. However, one good source of data on the use of cash by individuals is the Bank’s Consumer Use Study. Our most recent study, in late 2013, showed that cash remained the most important payment method for low-value transactions (around 70 per cent of payments under $20). However, it confirmed that the use of cash had declined significantly, with the proportion of all transactions involving cash falling from 70 per cent in the 2007 survey to 47 per cent in 2013.
More recent data on the transactions use of cash are not available, though the ongoing fall in cash withdrawals from ATMs and at the point of sale suggest that it has continued. In addition, the continuing strong growth of contactless transactions and the growing acceptance of cards for low-value transactions are also suggestive of a further decline in the use of cash.
Graph 10
Graph 11
However, that is where the parallels with cheque usage end. While the use of cash in transactions has been declining, the demand to hold cash has continued to grow. This is the case for low denomination banknotes as well as high denomination ones. Indeed, in recent years there has been a modest increase in the rate of growth of banknotes on issue, to an annual rate of around 7 per cent over the past couple of years. More broadly, over the longer term, growth in banknote holdings has been largely in line with nominal growth in the overall economy.
Graph 12
Graph 13
The growing demand for holdings of cash suggest that it continues to have an important role as a store of value and there is some evidence – from demand for larger denomination notes – that this increased following the global financial crisis. So, despite the decline in use in transactions, cash is likely to remain an important part of both the payments system and the economy more broadly for the foreseeable future. In particular, significant parts of the population appear to remain more comfortable with cash than with other payment methods in terms of ease of use for transactions or transfers, as a backup when electronic payment methods may not be available, or as an aide for household budgeting.
Given the important ongoing role of cash in the payments system, the Bank is currently undertaking a major project to upgrade the existing stock of notes. Counterfeiting rates of the current series of banknotes remain low by international standards but have been rising and there are some signs that the counterfeiters are getting a bit better with new and cheaper scanning, printing and image manipulation technology. Accordingly, the program for the next generation of banknotes includes major security upgrades that should ensure that Australia’s banknotes remain some of the world’s most secure. The first release of the new banknotes will occur in September this year, with the release of the new five dollar note.
Australia is not alone in continuing to invest to ensure that the public can continue to have confidence in its banknotes. The United States has also done so recently, and Sweden – which is often cited as being furthest along the path to a cashless or less-cash society – is also in midst of introducing a new series of notes.
Digital currencies and distributed ledgers
As the use of cash and cheques continues to fall, the Bank will – subject to there not being any overriding concerns about risk – be agnostic as to what payment methods replace the legacy systems, consistent with its mandate to promote competition and efficiency.
In the short run, it is likely that we will see further growth in the existing electronic payment methods, including payment cards in their various form factors. In the medium term, it is likely that we will see growth in new payment methods and systems, including those that will be enabled by the NPP.
Let me stress that the Bank has not reached a stage where it is actively considering this, but in the more distant future it is even possible that we may we see a digital version of the Australian dollar. As the Bank has noted in the past, it seems improbable that privately-established virtual currencies like Bitcoin, with its significant price volatility, could ever displace well-established, low-inflation national currencies in terms of usage within individual economies. Bitcoin has, however, served to stimulate interest in the potential offered by distributed ledgers, extending to the possibility of central-bank-issued digital currencies. A plausible model would be that issuance would be by the central bank, with distribution and transaction verification by authorised entities (which might or might not include existing financial institutions). The digital currency would presumably circulate in parallel (and at par) with banknotes and other existing forms of the national currency.
A few countries have explicitly discussed the possibility of digital versions of their existing currency. Both the Bank of England and Bank of Canada have indicated that they are undertaking research in this area. And a recent announcement from the People’s Bank of China indicated that it has plans for digital currency issuance, though few specifics were provided.
The Bank will be interested to see what proves to be possible and what proves to be problematic, as countries consider going down the path of digital currency issuance. Given the various cybersecurity and cryptography risks involved, my personal expectation is that full-scale issuance of digital currency in any country, as opposed to limited trials, is still some time away. And I think it remains to be seen if there is real demand for a digital equivalent of cash and what it might offer end-users relative to what will be offered by the various forms of real-time payments that are being developed in many countries through projects like the NPP.
I should also touch briefly on another potential application of blockchain or distributed ledger technologies, namely in the settlement of equity market transactions. As the overseer of clearing and settlement facilities licensed to operate in Australia, the Bank obviously has a keen interest in the plans of the ASX Group to explore the use of distributed ledgers. Along with the Australian Securities and Investments Commission and other relevant public sector organisations, we will be working closely with ASX as it considers whether a distributed ledger solution might be the best way to replace its existing CHESS infrastructure.
Review of Card Payments Regulation
I will conclude with a few comments on the ongoing Review of Card Payments Regulation.
The Bank issued a consultation paper containing some draft changes to standards in late 2015. It has received substantive submissions from 43 different stakeholders, with a number of parties providing both a public submission and additional confidential information. 33 non-confidential submissions have been published on the Bank’s website.
The submissions indicate that most end-users of the payments system are broadly supportive of the Bank’s reforms over the past decade or more. Some submissions have indeed suggested that the Bank could have gone further in its proposed regulatory changes. Financial institutions and payment schemes have expressed a range of views. For the most part they have recognised the policy concerns that the Bank is responding to. In some cases there is a fair bit of common ground in areas where they have made suggestions for changes to the draft standards, but in others there are conflicting positions that correspond to the different business models of the entities that have responded to consultation.
The Payments System Board discussed the Review at its meeting last Friday, focusing on issues that stakeholders have highlighted in submissions. As we always do when regulatory changes are proposed, Bank staff will be meeting with a wide range of stakeholders to discuss submissions. Indeed, we have already had a significant number of meetings, sometimes multiple meetings with particular firms as they were preparing their submissions.
Some of the issues to be explored in consultation meetings include: the treatment of commercial cards and domestic transactions on foreign-issued cards in the interchange benchmarks; the proposed shift to more frequent compliance to ensure that average interchange rates remain consistent with benchmarks; and the calculation of permissible surcharges for merchants (such as travel agents or ticketing agencies) that are subject to significant chargeback risk when they accept credit or debit cards.
One other issue that I would like to flag ahead of our consultation meetings relates to the proposed reforms to surcharging arrangements. The Bank’s proposed new surcharging standard has been drafted to be consistent with amendments to the Competition and Consumer Act 2010 which were passed by the House of Representatives on 3 February and by the Senate yesterday.
The proposed framework envisages that merchants will retain the right to surcharge for expensive payment methods. However, the permitted surcharge will be defined more narrowly as covering only the merchant service fee and other fees paid to the merchant’s bank or other payments service provider. Acquirers would be required to provide merchants with easy-to-understand information on their cost of acceptance for each payment method, with debit/prepaid and credit cards separately identified. The draft standard would require that merchants would receive an annual statement on their payment costs which they could use in setting any surcharge for the following year. The information in these statements should allow the Australian Competition and Consumer Commission (ACCC) to easily investigate whether a merchant is surcharging excessively.
The objectives of the proposed changes to the regulation of surcharging received widespread support in submissions. However, a number of financial institutions have argued that it would be difficult to provide statements to merchants on their average acceptance costs for each payment system. Some have said that their billing process draws on multiple systems within their organisations (and sometimes from third parties), so that it is not straightforward to provide the average cost information proposed by the Bank. Some have indicated that they do not currently provide annual statements to merchants, so this would be a significant change. Accordingly, a number have suggested that they would prefer a significant implementation delay before they are required to provide merchants with the desired transparency of payment costs. Bank staff will be testing these points in our consultation meetings with acquirers. In doing so, we will be looking to see what might be done to ensure that the standards can take effect as soon as possible, in order to meet community expectations about the elimination of instances of excessive surcharging.
More broadly, the Board also discussed a possible timeline for concluding the Review. The Bank’s expectation is that a final decision on any regulatory changes should be possible at the May meeting. It is too soon to give much guidance on the date when any changes to the Bank’s standards might take effect, but the Board recognises that an implementation period will be necessary for the industry.
The principal interest rate benchmark in Australia is the bank bill swap rate (BBSW), but there are questions about its accuracy (and we know overseas, other benchmark rates – such as LIBOR – have been rigged). So Guy Debelle RBA Assistant Governor (Financial Markets) spoke at the KangaNews Debt Capital Markets Summit and both discussed domestic reforms around the benchmark, and mentioned the possibility of introducing a ‘risk-free’ interest rate for the domestic market, as a complement to BBSW. He did not talk about the investigations that ASIC is currently undertaking into conduct around BBSW.
Given its wide usage, BBSW has been identified by ASIC as a financial benchmark of systemic importance in our market. It is important there is ongoing confidence in it. Without that, we have a serious problem, given its integral role in the infrastructure of domestic financial markets.
As you may know, BBSW was calculated for a number of years by, each day, asking a panel of banks to submit their assessment of where the market was trading in Prime Bank paper at a particular time of the day. While it was a calculation based on submissions, it differed from LIBOR in that BBSW submitters were asked about where the market for generic Prime Bank paper was trading that day. In contrast, LIBOR submitters were asked about where they thought their own bank’s cost of funds was that day.
In response to the prospect of a large number of the participants on the submission panel no longer being willing to provide submissions, the calculation of BBSW was reformed in 2013 in line with the IOSCO Principles for Financial Benchmarks, which were issued in July 2013.
Since 2013, the Australian Financial Markets Association (AFMA) has calculated BBSW benchmark rates as the midpoint of the (nationally) observed best bid and best offer (NBBO) for Prime Bank Eligible Securities, which are bank accepted bills and negotiable certificates of deposit (NCDs). Currently, the Prime Banks are the four major Australian banks. The rate set process uses live and executable bid and offer prices sourced from interbank trading platforms approved by AFMA, These platforms are currently ICAP, Tullett Prebon and Yieldbroker. The bids and offers are sourced at three points in time around 10.00 am each day.
Trading activity during the daily BBSW rate set has declined over recent years to very low levels. There are quite a number of days where there is no turnover at all at the rate set. The low turnover in the interbank market raises the risk that market participants may at some point be less willing to use BBSW as a benchmark. This is the motivation for the CFR’s consultation to ensure that BBSW remains a trusted, reliable and robust financial benchmark.
The likely key change to the methodology proposed is to calculate BBSW directly from market transactions – that is, calculating BBSW as the volume-weighted average price (VWAP) of market transactions during the rate set window. Given the objective is to better anchor BBSW to transactions in the underlying market, the RBA supports moving the calculation methodology to the VWAP.
With regards to the risk-free benchmark:
Next I would like to briefly raise some issues around whether the use of BBSW needs to be quite as widespread as it is. In a number of instances, BBSW has become the default reference rate without much thought being given as to whether it is the most appropriate reference rate. BBSW is a credit‑based reference rate. It is based on the borrowing costs of the major banks, with the credit risk that entails embodied in the rate.
For a number of purposes, a credit‑based rate is completely appropriate. However, for other purposes, a rate that is closer to risk‑free may be more appropriate. For instance, in recent years, market participants have moved to use overnight-indexed swap (OIS) rates more often when discounting the cash flows in their swaps. The FSB, through its official sector steering group (OSSG) on benchmark reform, is encouraging market participants to contemplate switching from credit‑based benchmark rates like BBSW or LIBOR to risk‑free rates, where appropriate.
In the local market, there appears to be growing interest in using risk-free rates as benchmarks. Such a rate could be backward looking, like the cash rate, or forward looking, like OIS rates. As a first step, some market participants have indicated that a total return index of the cash rate would be a useful backward-looking benchmark. Implementing this would be straightforward, since the RBA already calculates and publishes the cash rate. Some market participants are also interested in referencing a forward-looking rate with equivalent tenors to BBSW, and we will continue to work with AFMA on the development of such a benchmark.
One example where a change in reference rate could be contemplated is for floating rate notes (FRNs) issued by governments. FRN coupon payments are typically priced at a spread to BBSW. While referencing BBSW makes sense for FRNs issued by banks, it is less clear why governments should tie their coupon payments to a measure of bank funding costs.
That is one example worthy of consideration. There are a number of others. I know this is not necessarily an issue you may have thought that much about until now. At the very least, I would encourage you to at least ask the question whether the product you are issuing or holding is using the most appropriate reference rate.
As part of its innovation agenda the Coalition government is offering a tax offset of 20 cents for every dollar invested into a startup, as well as an exemption from capital gains tax for up to 10 years. However, it has emerged that this incentive could be limited to only ‘sophisticated’ investors, defined as those earning more than $250,000 per annum or having a net worth of more than $2.5 million.
Placing this restriction on startup investment could potentially disadvantage a key group of seed capital providers namely family and friends or informal investors. Family and friends provided $66 billion of startup capital to emerging ventures in the United States This is about three times more than either venture capitalists or professional angel investors.
Many of today’s largest listed US companies took seed capital from informal investors. For example Whole Foods Market, a $10 billion American organic food company, was started with founder savings and capital provided by family and friends.
These investors each provide anywhere between $1,000 to $30,000 in seed funding, yet many of them would not qualify as sophisticated investors under the Australian government’s definition.
Australian startups face serious challenges in accessing capital at almost every stage in their growth cycle. In particular, difficulties in accessing seed capital, needed to help turn an idea into an operating business, appears to be a critical road block for many aspiring Australian entrepreneurs.
For example, one in five startups cite restricted access to capital as a major barrier to innovation.
So where can startups access very early stage capital? It appears the sources are limited. The latest data from the Australian Venture Capital Association shows that very few seed investments are made in Australia by venture capitalists.
Further, the angel and incubator community is only just emerging, with only about 12 active groups across the country. This further points to the important role that informal investors can play in filling the capital cap that occurs at a venture’s seed stage.
It is true that informal investors stand to lose a greater proportion of their wealth in comparison to high net worth individuals when investing in startups. However another important innovation agenda reform, equity crowdfunding whereby ordinary mum and dad investors can take an equity stake in a startup through an online portal, would allow them to diversify their risks across many ventures, beyond those in which they have personal connections.
With this in mind, there are several reasons to believe that encouraging, rather than penalising small unsophisticated investors, is an important step to help young Australian startups to grow.
Family and friend investors have a personal connection with the founder, and typically will invest out of loyalty, trust and a belief in the founder’s ability. Such relationship characteristics are difficult to replicate with professional investors, who will often price down a company’s value to account for the possibility of moral hazard or unscrupulous founder motives.
In fact, if a start-up can grow through family and friend investments, often venture capitalist and angels become more inclined to offer follow-on funding, because the fact that informal investors have put their trust (and money) in the founder is a strong signal of the entrepreneur’s integrity and ability.
Bringing on formal or sophisticated investors too early can also stifle innovation. Venture capitalists are certainly not patient. They look for an exit in five years. Angel investors are a little more patient, but still look at a 10 year time frame. Often developing an innovative business can take much longer. For example, Glenn Martin the founder of Martin Jetpack, a Kiwi startup that listed on the ASX last year, first started work on the jet pack in 1981.
Further, a slower start to a venture is often a safer start, where the entrepreneur can take a “try it, fix it” approach and has ample opportunity to correct errors from poor decisions. Informal investors are more likely to be hands-off in their investment approach and thus far more likely to tolerate such an uncertain environment.
On the other hand, professional investors are much more hands-on and may prefer the safe proven routes learnt from previous investments, when in fact an experimental try-it, fix-it approach may be more conducive to innovation.
In order to ensure that our taxation system creates incentives that promote a successful startup ecosystem, careful consideration should be given to how early stage ventures are developed in other successful startup environments.
The Australian government’s efforts to recently secure a “landing-pad” in San Francisco’s highly successful RocketSpace hub, is exactly the kind of initiative that will help Australians learn how to foster a more vibrant domestic startup ecosystem.
While this will not directly address the seed capital gap, helping founders to access valuable networks and to develop their ideas through co-working with others, will certainly enhance their future capital raising capabilities.
Author: Jason Zein, Associate Professor, UNSW Australia
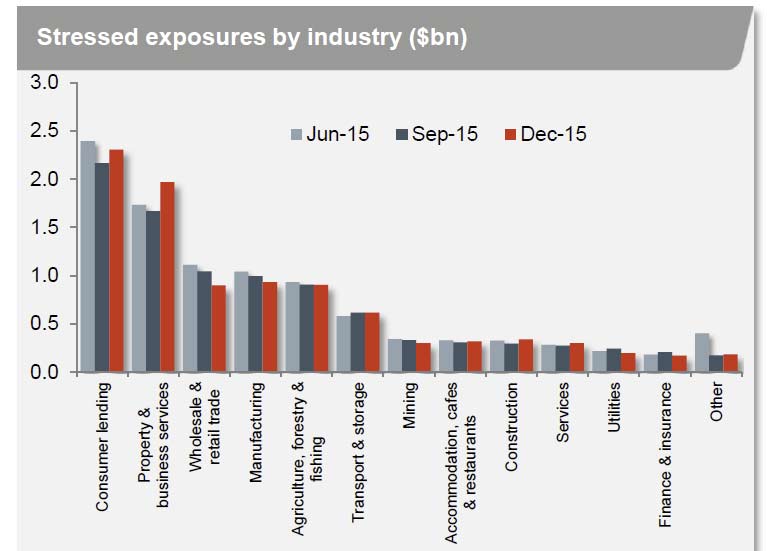
Westpac does not provide a 1Q16 profit update, but has disclosed some information about the business in the context of Pillar 3 reporting. From that, the banks appears to be weathering the current conditions well, though their large mortgage book shows minor rises in impairment. They are well capitalised, though with a lower share of deposits in the funding mix, compared with some of updates from other banks.
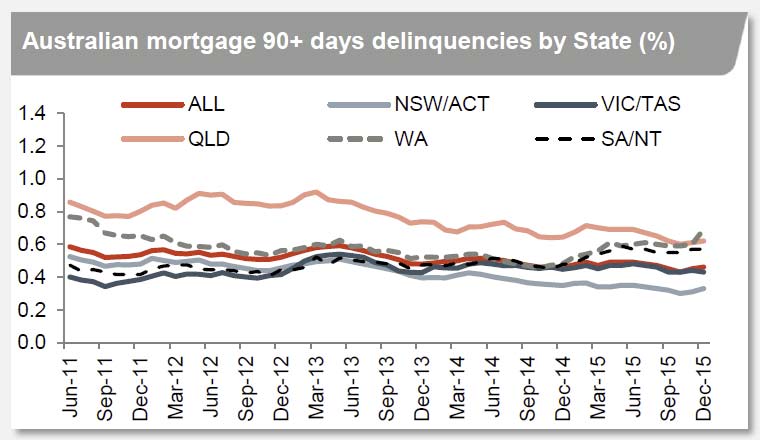
Looking at exposures by industry, they reported small rises in the consumer book – including 2 basis points increased in group mortgages +90 day delinquencies to 44 basis points, in property and business services and construction.
The proportion of mining which is stressed has risen from 1.9% to 2.2%.
Australian mortgage 90+ delinquencies were up 1 basis point to 46 basis points, with WA and QLD the highest, NSW/ACT, much lower.
Australian personal loans 90+ days delinquencies were up, at more than 1.5%.
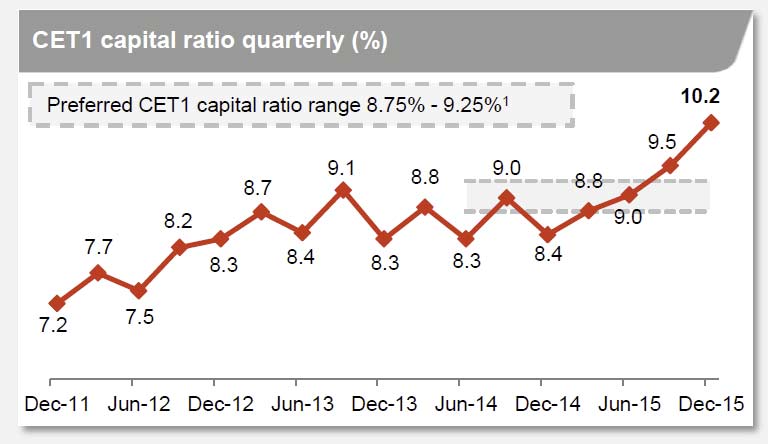
They reported improved capital ratios with common equity Tier 1 (CET1) at 10.2% and APRA’s leverage ratio at 4.9% (up from 4,8% in Sept 2015.
Funding was helped by $14bn raised year to date (31 Jan 2016), whilst customer deposits made up 60.2% of funding, up slightly from September. 14.7% of funding was off-shore.