Forecasting Ain’t Easy

Warren Tease, Principal Adviser, Macroeconomic Conditions Division spoke at CEDA’s Economic and Political Overview Conference about forecasting in Treasury.

Most forecasts for growth in most economies have been persistently too high over the past few years.

In that time, a key feature of the forecasts for the global economy and for Australia has been the persistent downgrading of forecasts. The pattern of downgrades is clear. In almost every year since the crisis, forecasters have been too optimistic about the outlook for growth. Treasury’s forecasts have exhibited the same behaviour. This persistent bias is perhaps the most unusual attribute of recent experience, at least in Treasury’s case, as past forecasting reviews have shown that Treasury’s real GDP forecasts have not exhibited persistent errors over time.

Digging a little deeper into this quantitative work I would also observe that Treasury’s forecasts did well in normal times but were challenged when conditions were unusual.

Thus, while there was no evidence of persistent errors over a very long time period, Treasury’s forecasts were punctuated by persistent and sometimes large errors over horizons relevant for policy makers and their advisers.

This can be seen in the following chart which compares Treasury’s forecasts of nominal GDP growth with actual outcomes since the early 1990s. I use nominal rather than real GDP as it is a key input into forecasting budget outcomes.

Chart 2 — Nominal GDP Forecasts and Outcomes

Source: Budget papers and ABS cat. no. 5206.0

It shows three distinct periods of forecast errors. Forecasts regularly overestimated nominal GDP growth in the early 1990s and after the financial crisis while understating outcomes for most of the 2000s prior to the crisis.

Each of these episodes coincided with Treasury persistently erring in its inflation (measured by the GDP deflator) forecasts. This observation has been made in each of the previous forecast reviews.

As previous reviews noted Treasury missed the decline in inflation in the early 1990s.

More recently, the forecasts did not incorporate fully the impact of the unprecedented rise then fall of commodity prices. In the upswing, Treasury’s forecasts did include projections that prices would eventually fall but these proved to be wrong as prices continued to increase. In the downswing, prices have fallen more rapidly than Treasury’s assumptions implied. Heightened volatility in Australia’s terms of trade has made it more difficult to forecast nominal GDP outcomes.

While difficulty in forecasting the GDP deflator has been a feature of Treasury’s (and others’) forecasts, past reviews have shown that its real GDP forecasts were more accurate and unbiased. Therefore, it is the persistent errors in Treasury’s real GDP forecasts of the past few years that have been unusual.

The chart shows that in the 1990s and 2000s there was no distinct under or overestimate in Treasury’s forecasts for the real economy. However, since the crisis Treasury, like the other forecasters presented earlier, has for the most part overestimated real GDP growth.

Chart 3 Real GDP Forecasts and Outcomes

Source: Budget papers and ABS cat. no. 5206.0

Now I do not wish to push this point too hard as the sample set is very small but it is consistent with what we are seeing across a range of forecasters and countries.

He has reviewed the forecasting approach, and concluded that in Australia a smaller number of input metrics have been used, compared with other countries. In addition Australia, as an open economy is wide open to international factors which impact locally.

“For a small open economy like Australia, persistent and short-term deviations from trend are likely to be driven by global economic shocks, large changes in commodity prices or from the financial sector. Other factors could also be important but these three factors encompass much of Australia’s experience with shocks.”

Finally, there is a bias towards trend performance, so any deviation is harder to cope with.

“It means that Treasury’s forecasting approach is likely to generate reliable forecasts at times when economic conditions are normal but will be challenged at other times.

There is a therefore a high probability that structural changes or persistent shocks will not be adequately incorporated into the forecasts”.

Good to see a discussion about the complexity of forecasting in a volatile environment. We should not be taking their projections as gospel truth. Forecasting ain’t easy!

The International Exposures of Australian Banks

In a Speech “The Evolving Risk Environment”, Malcolm Edey RBA Assistant Governor (Financial System) discussed some of the risks to financial stability, both globally and locally.

Much of the story has been told before, the economic uncertainties surrounding oil, China, Europe, high debt levels and locally the risks (and how they have been controlled) in the housing market, and potential risks in the commercial property sector.

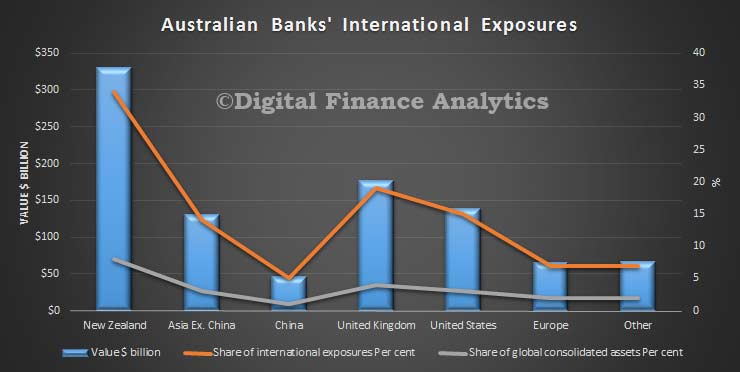
One specific issue he covered was the potential international exposures Australian banks may face. He focussed specifically on the assets Australian banks hold overseas.

Global-Assets-RBA

Direct exposures of Australian banking institutions to the risk factors I have been describing are quite limited Exposures to the euro area have been scaled back in the wake of the crisis and now represent only around 1 to 2 per cent of Australian banks’ consolidated global assets. Although exposures to the Asian region have been growing quite rapidly over recent years, they are still a relatively small share of consolidated assets – around 4 per cent. Many of these exposures are shorter-term and trade-related, factors that should lessen credit and funding risks. That said, operational and legal risks around these exposures could be relatively high, particularly given the rapid expansion of these activities in recent times.

Fair point. However, there are two other exposures to also consider. First banks here are funding their lending partly via capital markets overseas, because there is a gap between  the value of deposits held and loans made. Different banks have different footprints. But this means if the international capital markets froze for any reason this would be a significant risk locally. This was demonstrated during the GFC. In any case, in the current environment, spreads are rising, and funding is becoming more expensive. To an extent, given limited competition here, they can just raise rates to customers. But there will be some limits. Recently we have seen a number of lifts in some mortgage rates and to the SME sector.

The other exposure is from international investors and fund managers who invest in the shares of the banks here, and who are also thinking about risk profiles, local economic performance and other factors. We often get asked to provide a picture of things here by such investors. They will consider levels of returns and risks implicit in these returns. Given that going forwards, it is likely banks will find it harder to maintain current dividends than in the past, we may see a change in the wind here too. If international investors were to jump ship, expect market prices to fall.

So, my simple point is that banks are exposed to global forces, well beyond those risks of default on loans, and these additional should be factored into discussions of financial stability.

I would also highlight that not all banks are equally exposed, as underscored by the batch of results declared in the past couple of weeks.

Unemployment Wobbles In January

The latest data from the ABS on employment trends continues to show a level of unpredictability. Whilst most analysts were expecting no change, the seasonally adjusted rate rose to 6%, up from 5.8%, whilst the trend smoothed data read 5.8% down from 5.9% in December. So you can spin the story either way…. though I expect most will select the lower results contained in the seasonally adjusted series. We prefer to follow the trend data which irons out some of the random movements which the current method creates.

Emp-Jan-2016Indeed, the ABS tell us that their  estimates are based on a sample survey. Published estimates and movements are subject to sampling variability. Standard errors give a measure of sampling variability. The interval bounded by two standard errors is the 95% confidence interval, which provides a way of looking at the variability inherent in estimates. There is a 95% chance that the true value of the estimate lies within that interval.

In other words, it is not clear if the small movements are significant. We suspect not. However the apparent miss may trouble the market.

The ABS tell us that in trend terms employment increased 19,800 to 11,909,900 in the month, unemployment decreased 4,400 to 739,400, unemployment rate decreased less than 0.1 pts to 5.8%, based on unrounded estimates, participation rate remained steady at 65.2% and monthly hours worked in all jobs increased 3.6 million hours to 1,652.7 million hours.

In seasonally adjusted terms, employment decreased 7,900 to 11,894,500 in the month, full-time employment decreased 40,600 to 8,185,800 and part-time employment increased 32,700 to 3,708,700,unemployment increased 30,200 to 761,400, the number of unemployed persons looking for full-time work increased 25,600 to 544,100 and the number of unemployed persons only looking for part-time work increased 4,600 to 217,300. The unemployment rate increased 0.2 pts to 6.0%, participation rate remained steady at 65.2%. and monthly hours worked in all jobs increased 10.9 million hours to 1,656.0 million hours.

AMP reports A$972 million net profit for FY 15

AMP has reported a net  profit of A$972 million for the full year to 31 December 2015 , up 10 per cent on A$884 million for FY 14. Underlying profit  was A$1,120 million compared  with A$1,045 million for FY 14, up 7 per cent year on year, with good earnings growth particularly in Australian wealth management, AMP Capital, AMP Bank and New Zealand.

Underlying  return on equity: increased 0.5 percentage  points to 13.2 per cent in FY 15 from FY 14, largely reflecting the increase in  underlying profit.

The 7% increase in FY 15 underlying profit was largely the result of good operating earnings growth in Australian wealth management (+10%), AMP Capital (+20%), AMP Bank (+14%) and New Zealand financial services (+9%). FY 15 Australian wealth protection operating earnings fell 2%, impacted by experience losses of A$11m over the year, while Australian mature operating earnings declined 9%, largely due to the expected portfolio run-off. Underlying investment income fell A$7m on FY 14 to A$125m, reflecting lower average shareholder funds in FY 15.

Total controllable costs rose A$14 million to A$1,329  million as increased investment in growth initiatives and currency movements  were largely offset by the benefits of the business efficiency program.The group cost to income ratio improved 1 percentage point from FY 14 to 43.8  per cent in FY 15.

Momentum continued across Australian wealth management and AMP Capital, which delivered a particularly strong result as their international investment management profile expands, both in China and more  broadly.

Retail and corporate super net  cashflows on AMP platforms increased 5 per cent to A$3,784 million.

AMP Capital external net cashflows were A$4,434  million, up 19 per cent from A$3,723 million in FY 14,  driven by   stronger inflows generated through the   China Life AMP Asset Management  joint venture, institutional and retail domestic clients.

Australian wealth management operating earnings for FY 15 were A$410 million, up 10 per cent compared with FY 14, driven by strong net cashflows leading to a 10 per  cent growth in AUM.

Australian wealth protection operating earnings were A$185 million in FY 15 compared with A$188 million in FY 14.  Claims experience reflected the continued roll out of the new claims approach, reversion to long term assumptions and volatility in the second half of the  year.

  • AMP  Capital: The delivery of key priorities for the year, coupled with strong investment performance, drove 20 per cent growth in  operating earnings and improvement in total net cashflows of A$1.4 billion compared to FY 14.
  • Expanding  global footprint: AMP Capital increased FUM managed on behalf of international institutional clients by more than A$2.0 billion  to A$6.8 billion during the year, which included growth in the global  infrastructure platform. AMP’s relationship with China Life and MUTB remains strong.  The financial performance of the joint ventures with China Life are  ahead of expectations.
  • AMP Bank: The bank’s  growth momentum continues with operating earnings increasing by 14 per cent to A$104 million in FY 15 from an improved net interest margin and growth in the loan book.  Net interest margin was 1.59% for FY 15, up 18 basis points from FY 14 and up 6 basis points from 1H 15. AMP Bank’s return on capital was 16.5%, up 1.3 percentage points from FY 14 (15.2%). Customer deposit to loan ratio was 63% for FY 15, compared with 64% for FY 14. The Capital Adequacy Ratio (CAR) was 12.8% as at FY 15 (12.2% at FY 14). The Common Equity Tier 1 Capital Ratio for FY 15 was 7.9% (9.3% at FY 14). This reduction is the result of a capital return to the group of A$100m of common equity, following the on-lend of Additional Tier 1 capital from the AMP Wholesale Capital Notes issued in March 2015. Both ratios remain well above APRA and internal thresholds. The Bank is compliant with the Basel III capital requirements, which took effect from 1 January 2016.
  • New  Zealand: Operating earnings in New Zealand increased 9 per cent, reflecting strong growth in profit margins and experience. Learnings from Australian claims management were used to help drive good experience outcomes.  KiwiSaver is a key growth engine for the wealth management business. NZFS was the third largest KiwiSaver provider with 13% of the total KiwiSaver market as at June 2015 and had approximately 245,000 KiwiSaver customers. In FY 15, KiwiSaver had NZ$3.9b in AUM, an increase of 13% from FY 14.
  • Business  efficiency program: During FY 15, AMP continued to deliver on the three year business efficiency program, which is targeting recurring cost savings of A$200m (pre-tax) per annum (80% controllable costs and 20% variable costs). The estimated one-off cost of implementation is A$320m (pre-tax) or A$224m on a post-tax basis. During FY 15, costs incurred were A$66m post-tax. The expected pattern of post‑tax
    expenditure over FY 16, the final year of the program, is A$19m.
  • Face-to-face  advice of the future: The development of a new goals based face-to-face advice experience continued, with positive results in FY 15 from five pilot sites. The trial is being expanded in FY 16 as part of AMP’s ambition to set a benchmark for high quality, professional advice.

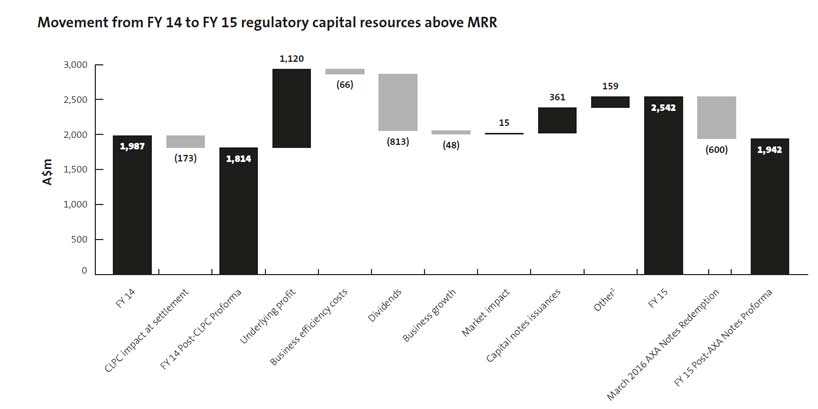
AMP maintained its strong capital position with a surplus of A$2.5 billion at 31 December 2015, above minimum regulatory requirements. The increase was driven by retained profits,  the successful issuances of AMP Wholesale Capital Notes and AMP Capital Notes.

AMP-FY15AMP intends to redeem the AXA Notes on 29 March 2016 when they  cease to be eligible capital under the subordinated transitional arrangements  provided by APRA.  This will reduce  capital resources above minimum regulatory requirements by A$600 million.

AMP maintains a strong balance sheet, with little change to  gearing and access to significant liquidity.

The Board has declared a 4 per cent increase to the final  dividend to 14 cents per share, compared with 13.5 cents per share for the 2014  final dividend. This represents a payout  ratio of 75 per cent of underlying profit.

The 2015 final dividend will be franked at 90 per cent, up from  80 per cent in 2014 with the unfranked amount being  declared as conduit foreign income. AMP has revised its future dividend policy to a target range of 70 to 90 per cent of underlying profit reflecting confidence  in the financial strength of the group.

Digital payment providers yet to win war on cash

From The Conversation.

There is mounting evidence from many countries around the world that the use of cash is declining.

In Sweden, around 80% of all transactions in the retail industry are made by cards.

In the United Kingdom, Transport for London (TfL) enables people to pay for their tube, train or tram journeys with a tap of their bank cards and this contactless payment now represents 25% of all (TfL) pay-as-you-go transactions. From 2018 New York subway and bus travellers are expected to be able to pay with their contactless bank cards or mobile phones.

And in Australia both the volume and value of cash withdrawals from the ATM network continue to fall from their peak in 2008, despite an ever-increasing number (now over 31,000) of available ATMs. Indeed figures released in February 2016 by the Reserve Bank of Australia (RBA) show consumers withdrew an average of A$11.7 billion a month from ATMs in 2015, down 1.7% from 2014.

Cash not done yet

And yet in other countries, cash is still king. Japan is still heavily reliant on cash for everyday purchases in retail outlets and restaurants. According to the Bank for International Settlements’ statistics on payments for 2014, there is US$6,429 of banknotes and coins in circulation per person in Japan, compared to US$2,459 for Australians and US$1,588 for the British.

Of further interest is that in Australia by 2014, the total volume of notes on issue was A$60.8 billion, with 92% of this total being in the high denomination A$50 and A$100 notes. According to data from Retail Banking Research, global ATM cash withdrawal volumes grew by 7% in 2014 and the upsurge in usage was most evident in the Asia-Pacific, Middle East and Africa regions.

So how to explain this seeming dichotomy between the holding and use of cash and the use of cards or mobile phones to make payments? Well as human beings we seem to have a psychological relationship with cash, that gives it an enduring appeal.

Cash is widely accepted; it is easy to carry; it is untraceable and it is reliable in times of crisis. People may be particularly attracted to notes because of the way they look and feel and because they want to store their wealth in physical objects, as the world around them becomes more unstable. This trust in “real currency” could explain the large increase in demand for cash during the global financial crisis, as people sought the “comfort” of a wad of banknotes.

Cash can also be used to avoid paying taxes; who amongst us has never used the words “Would that be cheaper for cash?”. The use of cash supports the “black” or “grey” economy, where tax evasion requires untraceable transactions. It is also more than useful where illegal activities produce wealth that needs to be kept secret from the authorities. Perhaps this helps to explain the proliferation of A$100 notes in circulation, but often rarely actually seen in circulation?

Despite the growth of card payments; the arrival of Android Pay, Apple Pay and Samsung Pay and the cryptocurrencies such as Bitcoin, cash is still here and here to stay.

Author: Steve Worthington, Adjunct Professor, Swinburne University of Technology

Our finances are a mess – could behavioral science help clean them up?

From The Conversation.

The first few months of a new year can be a stressful time financially. The Christmas holidays typically lead to depleted savings and higher credit card balances, while tax season is right around the corner.

Unfortunately for most us, this isn’t a seasonal dilemma but a chronic problem that brings anxiety throughout the year.

Indeed, as many as 44 percent of American households don’t have enough savings to cover basic expenses for even three months. Without a savings cushion, even regular seasonal expenses like holiday celebrations may end up feeling “unexpected” and lead households to turn to credit to cover costs.

U.S. consumers currently hold US$880 billion in revolving debt, with an average credit card balance of almost $6,000. The picture is even more dire for lower-income households.

So how can we turn this around? Many tacks have been tried but fallen short for one reason or another. Fortunately, behavioral science offers some useful insights, as our research shows.

What’s wrong with current approaches

Typical approaches to solving problematic finances are either to “educate” people about the need to save more or to “incentivize” savings with monetary rewards.

But when we look at traditional financial education and counseling programs, they have had virtually no long-term impact on behavior. Similarly, matched savings programs are expensive and have shown mixed results on savings rates. Furthermore, these approaches often prioritize the need for savings while treating debt repayment as a secondary concern.

Education and incentives haven’t worked because they are based on problematic assumptions about lower-income consumers that turn out to be false.

The truth is lower-income consumers don’t need to be told what to do. On average, they are actually more aware of their finances and better at making tradeoffs than more affluent consumers.

They also don’t need to be convinced of the value of saving. Many want to save but face additional obstacles to financial health.

For example, these households often face uncertainty about their cash flows, making planning for expenses even more difficult. More generally, they have little room for error in their budgets and the costs of small mistakes can compound rapidly.

Brain barriers

In this volatile context, psychological barriers common to all people exacerbate the problem.

People have difficulty thinking about the future. We treat our future, older selves as if they are strangers, decreasing motivation to make tradeoffs in the present. Additionally, we underpredict future expenses, leading us to spend more than precise budgeting can account for.

When we do focus on the future, people have a hard time figuring out which financial goals to tackle.

In research that we conducted with Rourke O’Brien of the University of Wisconsin, we found that consumers often focus either on saving money or on repaying debt. In reality, both actions simultaneously interact, contributing to overall financial health.

This can be problematic when people misguidedly take on high-interest debt while holding money in low-interest saving accounts at the same time. And, once people have identified building savings or repaying debt as an important goal, they have difficulty identifying how much should be put toward it each month. As a result, they rely on information in the environment to help determine this amount (like getting “anchored” on specific numbers that are presented as suggestions on credit card payment statements).

Unfortunately, the way current banking products are designed often makes these psychological realities worse.

For example, the information on many credit card payment systems nudges consumers toward paying the minimum balance rather than a higher amount. Budgeting tools assume income and expenses stay the same from month to month (not true for most lower-wage workers) and expect us to monitor spending against a long list of separate, complicated budget categories.

On a deeper level, the fact that banks offer credit and savings products separately exacerbates the psychological distance between paying down debt and building savings, even though these are linked behaviors.

Behavioral banking

The good news is that a range of simple, behaviorally informed solutions can easily be deployed to tackle these problems, from policy innovations to product redesign.

For instance, changing the “suggested payoff” in credit card statements for targeted segments (i.e., those who were already paying in full) could help consumers more effectively pay down debt, as could allowing tax refunds to be directly applied toward debt repayment. Well-designed budgeting tools that leverage financial technology could be integrated into government programs. The state of California, for example, is currently exploring ways to implement such technologies across a variety of platforms.

But the public and private sectors both need to play a role for these tools to be effective. Creating an integrated credit-and-saving product, for example, would require buy-in from regulators along with financial providers.

While these banking solutions may not close the economic inequality gap on their own, behaviorally informed design shifts can be the missing piece of the puzzle in these efforts to fix major problems.

Our research indicates that people already want to be doing a better job with their finances; we just need to make it a little less difficult for them. And making small changes to banking products can go a long way in helping people stabilize their finances so they can focus on other aspects of their lives.

Authors: Hal Hershfiel, Assistant Professor of Marketing, University of California, Los Angeles; Abigail Sussma, Assistant Professor of Marketing, University of Chicago.

In a changing world; is global still good?

In a speech to the Institute of Chartered Accountants of Scotland on 11 February, Dame Clara examines the UK’s position as host to a global financial centre through the lens of the Financial Policy Committee’s two main objectives: its primary objective to maintain financial stability, and its secondary objective to support the Government’s economic policy, including its objectives for growth and employment; productive investment, innovation, competition and the lead role of the City of London in international financial markets.

In the context of financial “de-globalisation” and sharply falling cross-border capital flows, Dame Clara believes that now is a good time to consider the benefits of global markets and financial centres. Historically, Dame Clara notes, the development of global financial centres went hand-in-hand with the integration of international capital markets, because a more complete market can allocate capital with much greater efficiency.

According to an IMF staff discussion note, financial development increases a country’s resilience; mobilises savings, promotes information sharing, improves resource allocation and facilitates diversification and management of risk. It also promotes financial stability to the extent that deep and liquid financial systems with diverse instruments help dampen the impact of shocks.
But at the same time, financial deepening and connected markets can transmit shocks as well as dispersing and absorbing risk and driving growth. “Overall, however, with the right policy framework, choices and institutions, it seems clear that the benefits of financial globalisation are compelling,” Dame Clara observes.

Next, Dame Clara considers why global centres are needed, when advances in technology have made it feasible for the financial system to become decentralised.

On reason why it is good to be global is that a specialised financial centre can yield “agglomeration benefits” – the economies of scale arising from having an industry cluster in a particular location – and which can also improve access to finance for households and businesses.

Another benefit of centralisation is that it allows the authorities to see more. “The more that activity clusters in a small number of centres, the more that regulators and policymakers can take a holistic, systemic view of threats to financial stability,” Dame Clara says.

In the UK context, there are also economic benefits in being a global financial centre. “While the primary objective of financial stability is paramount for the FPC, the UK clearly has an interest in maintaining its strong position as a provider of these services. Provided the financial sector remains resilient – and our new regulatory framework seeks to ensure that it does – this is central to the FPC’s secondary objective.”

Following on from this, Dame Clara considers the conditions for the success or failure of financial centres. Looking back over time, she observes that while financial centres have tended to cluster around centres of economic power, they can remain in place and prosper even after economic power has shifted elsewhere.

“The UK has maintained its position right into this century, even though the days in which Britain was the dominant superpower are long gone.”

That said, the decline of a financial centre can be precipitated by an adverse event, such as war or a policy error that makes the continued provision of financial services impossible, uneconomic or simply destroys confidence in it. As such, one lesson to be drawn from history is that policy choices and institutions matter.

Looking forward, proximity to power may be less important for financial centres such as the UK, thanks to advances in communications technology. However, because moving is easier than it was in centuries past, the same factors that mean the UK can serve the world, allow for a wide range of alternative centres to become established, possibly leading to a decentralisation and fragmentation of the financial system. This would undermine the efficiency of global capital markets and harm global growth.

“To avoid this, authorities need to remain alert to shocks, including those arising from the geopolitical and wider macrofinancial environment, as well as the more ‘bread and butter’ risks that are visible on banks’ balance sheets. This is where the FPC can play an important role,” according to Dame Clara.

An environment where geography and sheer economic scale matter less, means that institutions may matter even more. “We need a clear, prudent, proportionate system of regulation, which is sensitive to the different risks and opportunities posed by different kinds of activity,” Dame Clara says.

Dame Clara concludes that: “International and global financial centres have historically played a crucial role in promoting both growth and stability. But policymakers cannot take their existence for granted. In a world where institutions and policy choices matter more than ever, a prudent and proportionate regulatory framework is essential to sustainable growth. That is what we on the FPC are seeking to achieve.

NAB Q1 2016 Trading Update

National Australia Bank reported Q1 unaudited cash earnings of $1.7 billion, 8% higher than the prior corresponding period. Statutory net profit was $1.5 billion.

Revenue increased 2%, thanks to stronger lending volumes, a higher NIM and stronger Wealth. Expenses rose 5%. They specifically mentioned the benefit to NIM of home loan repricing. which was partly offset by higher funding costs and competition for business lending.

The charge for Bad and Doubtful debt fell 52% to $84 million. This is explained by the non-repeat of provisions for mining and agribusiness previously made, and improved asset quality in the Australian bank.

Common Equity Tier 1 capital (CET1) was 10.1%, slightly down on the 10.2% at September 2015, thanks to the impact of dividends.

Group leverage ratio was 5.4%.

ANZ Q1 2016 Trading Update Highlights Mixed Conditions

ANZ today announced an unaudited cash profit of $1.85 billion for the three months to 31 December 2015. Earnings momentum continued in the quarter with cash profit up 5% compared to the average of the third and fourth quarters of the 2015 Financial Year (FY15). Statutory net profit was $1.6 billion.

Income grew at a faster rate than expenses, with expenses well contained; technology investment and wage inflation were largely offset by a 2.5% reduction in staff numbers.

The Group Net Interest Margin (NIM) was stable excluding the impact of the Markets business; there was a 2 basis points decrease including Markets.

Retail and Commercial. Retail in Australia and New Zealand continued to perform well led by further market share gains in home lending in key markets. Small Business in both markets grew strongly while Corporate Banking income was impacted by higher funding costs and competition. Wealth benefited from stable Life Insurance lapse rates which were offset by investment market volatility.

Institutional. Markets income increased 6% to $553 million. Customer sales comprised 56% of Markets’ total income in line with the average for both the second half and FY2015. Cash Management performed well and the Group further reduced lower returning assets in Trade and Lending. Institutional NIM improved reflecting actions around asset mix and deposit pricing.

The total provision charge for the first quarter 2016 was $362 million (individual provisions $319 million; collective provisions $43 million). The total Group credit charge will be a little above $800 million this half compared to current market consensus of $735 million1. Gross Impaired Assets for the half will be broadly similar to the second half of 20152 despite falling in the first quarter.

APRA Common Equity Tier 1 (CET1) ratio was 9.4%6 at 31 December 2015. Excluding the impact of the 2015 final dividend payment, the CET1 ratio increased 45 basis points compared to 30 September 2015 primarily driven by organic capital generation and assisted by the Esanda portfolio sale.


Lending Finance To Dec 2015 Shows Business Loans Up Ex. Investment Housing

The ABS data to December 2015 of total lending by category shows that the total flow value of owner occupied housing commitments excluding alterations and additions rose 1.3% in trend terms (to $21.9 bn), and the seasonally adjusted series rose 0.9%.

The trend series for the value of total personal finance commitments fell 0.7% (to $6.9 bn). Fixed lending commitments fell 1.0% and revolving credit commitments fell 0.3%. The seasonally adjusted series for the value of total personal finance commitments rose 2.1%. Fixed lending commitments rose 2.6% and revolving credit commitments rose 1.5%.

The trend series for the value of total commercial finance commitments fell 0.3% (to $44.1 bn). Revolving credit commitments rose 2.4%, while Fixed lending commitments fell 1.2%. The seasonally adjusted series for the value of total commercial finance commitments fell 7.3%. Revolving credit commitments fell 18.3% and fixed lending commitments fell 3.3%.

The trend series for the value of total lease finance commitments rose 0.1% in December 2015 (to $602m) and the seasonally adjusted series rose 1.7%, after a fall of 3.8% in November 2015.

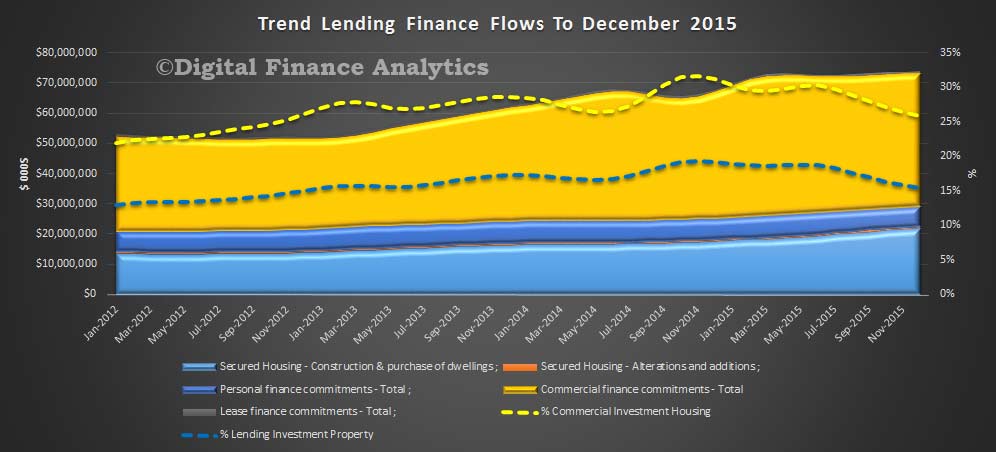
All-Lending-Trends-Dec-2015Commercial finance includes lending to individuals and other for investment property purchase. We see that lending for investment property purchase slid to 15% of all lending in December, having reached a high of nearly 20% in late 2014. In addition, the proportion of commercial lending which related to investment property purchase fell to 25% of all commercial lending, having reached a peak of 31.4% in late 2014.

However, bearing in mind total commercial lending fell in the month, we see that owner occupied lending is now growing considerably faster (1.3%), compared with investment lending (down 2.4% and $11.4 bn) and commercial lending in aggregate is down 0.34%, but the non-investment housing segment rose 0.38% (to $32.7 bn).

If investment lending continues to slow, this will put more pressure on commercial lending growth, or create space for other lending to business, depending on your point of view. Or will the banks simply continue to chase owner occupied refinancing, the easy option? That said, lending to business ex. investment housing did grow, if but a little in the month. We need much stronger movement here to drive productive growth.