RBA’s Latest Statement Raises Two Interesting Questions

The latest Statement of Monetary Policy, released today, continues to tell the now well rehearsed story. Resources down, China under pressure, local growth slowish, and transitioning from mining, sort of working, whilst home lending continues to grow at above 7% annually. But they kick around two interesting issues. First, why is the unemployment rate so good when growth is sluggish, and second why is the household savings ratio lower now?

Looking at employment first:

…strong employment growth has also been supported by a protracted period of low wage growth which, along with the exchange rate depreciation, may have encouraged firms to employ more people than otherwise. At the same time, growth in the supply of labour has increased through a rise in the participation rate, notwithstanding lower population growth. The unemployment rate declined to around 5¾ per cent in late 2015, having been within a range between 6 and 6¼ per cent since mid 2014. Nevertheless, there is evidence of spare capacity in the labour market, as the unemployment rate is still above recent lows, the participation rate remains below its previous peak and wage growth continues to be low.

Also, the low growth of wages is likely to have encouraged businesses to employ more people than otherwise. Measures of job vacancies and advertisements point to further growth in employment over the coming months. In response to this flow of data, the forecast for the unemployment rate has been revised lower. The fact that the improvement in labour market conditions has occurred against the backdrop of below-average GDP growth raises some uncertainty about the economic outlook. It is possible that the strength in the labour market data contains information about the economy not apparent in the national accounts data, or that the strong growth in employment of late will be followed by a period of weaker employment growth. Alternatively, the strength in labour market conditions relative to output growth may reflect a rebalancing of the pattern of growth towards labour intensive sectors and away from capital intensive sectors.

DFA is of the view that the growth in lower-paid non-wealth producing jobs at the expense of productive jobs is the key – more are now working in the healthcare and services sector (in response to growing demand thanks to demographic shifts), but it just moves the dollar around the system, and does not create new dollars. There is difference between being busy, and being productively (economically speaking) busy.

Turning to the savings ratio:

… after falling for more than two decades, the aggregate household saving ratio in Australia increased sharply in the latter half of the 2000s. While it has since remained close to 10 per cent – which implies that, collectively, households have been saving about 10 per cent of their incomes – the saving ratio has declined modestly over the past three years or so.

5tr-hhinconJan2016Understanding developments in the saving ratio is important because changes in household saving behaviour can have implications for the outlook for aggregate consumption. Trends in the household saving ratio in Australia over recent years are likely to reflect a range of factors, including the effect of the boom in commodity prices and mining investment on household incomes, behavioural changes stemming from the global financial crisis, and the current low level of interest rates. Longer-term factors such as financial deregulation and population ageing have also played a role. Households’ expectations about future income growth and asset valuations, and the uncertainty around those expectations, are also relevant to their saving decisions. Many households accumulate precautionary savings to insure against an unanticipated loss of future income or unexpected expenditure (such as on a medical procedure). At the macroeconomic level, precautionary saving is likely to be particularly important if households are very risk averse or constrained in their ability to borrow to fund consumption when their incomes are temporarily low. For example, the financial crisis is likely to have made households more uncertain about their future employment or income growth and/or led them to reassess their tolerance for risk, which would have encouraged them to increase their rate of saving. Surveys at that time showed an increase in the share of households nominating bank deposits or paying down debt as the ‘wisest place for saving’, although this may have also reflected lower expected rates of return on other financial assets following the financial crisis.

The level of interest rates can also influence the saving ratio. On the one hand, the current low level of interest rates reduces both the return to saving and the cost of borrowing, which encourages households to bring forward consumption; this might explain some of the recent decline in the aggregate household saving ratio. Low interest rates also support the value of household assets, which increases the amount of collateral households can borrow against, and potentially reduces the incentives for households to save. On the other hand, the household sector in aggregate holds more debt than interest-earning assets, so cyclically low interest rates provide a temporary boost to disposable income through a reduction in net interest payments, some of which may be saved. Households also need to save more to achieve a given target level of savings when interest rates are low.

Structural changes to the Australian financial system have been important longer-term drivers of changes in household saving behaviour. Financial deregulation in the 1980s and a structural shift to low inflation and low interest rates in the 1990s allowed households that were previously credit constrained to accumulate higher levels of debt for a given level of income. This rise in indebtedness was accompanied by strong growth in housing prices and a reduction in the household saving ratio to unusually low levels. In this way households were able to support consumption via the withdrawal of housing equity.  Innovation in financial products – such as credit cards and home-equity loans – also gave households much better access to finance. The adjustment to these structural changes in the financial system appears to have largely run its course by the mid 2000s.

The ageing of the population is another longer-term influence on the saving ratio. If shares of younger and older households in the population were constant over time, the different saving behaviours of these households would not affect the aggregate saving ratio. However, Australia’s baby-boomer generation is a larger share of the population now and has been entering the retirement phase since around 2010. Because households save less in their later years, this is expected to have a gradual but long-lasting downward influence on the aggregate household saving ratio. However, a potentially offsetting influence is rising longevity, which may lead households to save more during their working years to finance a longer period of retirement.

Pop-By-AGe-BandsThe amount that each of these drivers have contributed to recent trends in the aggregate household saving ratio is unclear. It is also uncertain how they will evolve over the next few years, although the Bank’s central forecast embodies a further modest decline in the saving ratio, that reflects, in part, the unwinding of the impact on saving from the earlier boom in commodity prices and mining investment.

Using data from the DFA household surveys, we note three factors in play. First, household confidence levels still below long term trends, so we would expect households to continue to save, if they can, against perceived future risks. Second, older households hold the bulk of the savings, and they are indeed growing as a proportion of the total, so again we would expect to see a rise, not a fall in the ratio. But, the third factor, is in our view, the most significant.  That is that many are relying on income from savings, and as deposit interest rates have fallen (and alternative investment options become more risky), some have switched savings into investment property and others are having to eat into capital to survive.  The RBA’s policy settings of low interest rates, and high house prices are being reflected back in lower savings ratios.

Retail Trade Flat In December – ABS

The latest Australian Bureau of Statistics (ABS) Retail Trade figures show that Australian retail turnover was relatively unchanged (0.0 per cent) in December 2015, following a rise of 0.4 per cent in November 2015, seasonally adjusted.

In seasonally adjusted terms there were rises in food retailing (0.8 per cent), clothing, footwear and personal accessory retailing (1.1 per cent) and department stores (0.1 per cent). Household goods retailing (-1.0 per cent), other retailing (-0.9 per cent) and cafes, restaurants and takeaway food services (-0.5 per cent) fell in December 2015.

The fall in household goods retailing was the largest of any industry in December. This fall follows large rises in recent months which have contributed significantly to stronger rises in total retail turnover. Despite the fall in December this industry maintains the strongest growth rate of any industry compared to this time last year, rising 6.3 per cent compared to December 2014.

In seasonally adjusted terms, there were rises in the Australian Capital Territory (2.4 per cent), Queensland (0.2 per cent), New South Wales (0.1 per cent), South Australia (0.2 per cent) and the Northern Territory (0.3 per cent). There were falls in Western Australia (-0.6 per cent), Victoria (-0.1 per cent) and Tasmania (-0.6 per cent).

The trend estimate for Australian retail turnover rose 0.3 per cent in December 2015, following a 0.3 per cent rise in November 2015. Compared to December 2014 the trend estimate rose 4.0 per cent.

Online retail turnover contributed 3.0 per cent to total retail turnover in original terms.

In seasonally adjusted volume terms, turnover rose 0.6 per cent in the December quarter 2015, following a rise of 0.5 per cent in the September quarter 2015. The largest contributor to the rise was Household goods retailing which rose 2.5 per cent in seasonally adjusted volume terms in December quarter 2015.

DFA Comments On Keen Mortgage Pricing, For Some

DFA contributed to a piece on ABC RN Breakfast which discussed the deep discounting currently available for selected mortgage borrowers, reflecting heightened competition, more difficult funding and changes in demand. You can listen to the segment, which also included Sally Tindall, Money Editor, RateCity and Alan Oster, Chief Economist, National Australia Bank. The reporter was Sheryle Bagwell, Business Editor.


How blockchain technology is about to transform sharemarket trading

From The Conversation.

Recently the Australian Securities Exchange (ASX) bought a $15 million stake in Digital Asset Holdings, a developer of blockchain technology. One of the main reasons is to upgrade its share registry system by using blockchain or distributed ledger technology.

And it’s been reported that JP Morgan Chase is also partnering with Digital Asset Holdings to trial the technology.

What is blockchain/distributed ledger technology?

Put simply, blockchain technology is a method of recording and confirming transactions where instead of a centralised platform, participants each hold a complete record of transactions through peer to peer verification of transactions. This means there is no central recording system, rather each participant keeps a record of all transactions ever made. This is the same system which allows Bitcoin to operate with no central body.

How would blockchain technology be adopted at the ASX?

Instead of the ASX clearing house settling trades, trades will be settled by participants confirming transactions through the peer to peer network. The network (likely made up of brokers) will record the buyer and selling participants, the number of shares traded, price of shares, time of exchange and the exchange of funds. The ASX will still provide a centralised electronic exchange for participants to place orders, only the settlement or back office function will be sourced to the network.

The benefits?

Blockchain has great potential to cut inefficiencies in the share settlement function. As trades are settled by peer confirmation, there is no need for a clearing house, auditors to verify trades and custodians to ensure a fund has the shares they say they hold. Essentially this is cutting out the middleman in the back office which means less costs in record keeping and in turn less costs to trading on the ASX. Given the high costs in getting a third party to audit, record keep and/or verify trades these costs are substantial.

The peer confirmation of trades also means settlement can be almost instantaneous. Compare this to the current settlement period of three working days (‘T+3’) as the ASX needs to make sure the participants have the money and shares on hand to exchange. This would make shares a far more liquid investment – almost as good as having cash on hand. Higher liquidity means more investment into ASX shares.

As all participants have the full record of transactions and therefore holdings of investors there is complete transparency in the equity market. This makes it almost impossible to falsify transactions or to alter prior transactions. If a false trade occurs, participants will find inconsistencies in their full ledger and reject the trade. For example an investor would be unable to sell stock that they did not own as all participants would know exactly how much stock the investor owns now.

The challenges?

First, implementing a clearing system using blockchain will introduce a new type of fee. In the Bitcoin blockchain, miners process Bitcoin transactions by solving optimisation problems and get rewarded by newly created Bitcoins and settlement fees offered by Bitcoin users who wish to have their transactions processed.

Miners prioritise the order of transactions to be cleared based on the fees offered and the difficulty of the problems to record the transaction in a block. This is what allows a blockchain to have no centralised clearing house.

If the ASX blockchain requires investors to include transaction fees in order for their transactions to be cleared, then the ASX is transferring the cost of maintaining the back office to the investors. If this is to happen, investors will have to compete against each other to have their transactions cleared faster than those of others. Alternatively, if the new system doesn’t allow such fees and relies on brokers or other entities to clear the transactions, then the ASX is again transferring the cost of maintaining back office to those entities.

The second concern is increased transparency. Under the proposed trading system, most of positions of the market participants could be exposed to the public as the trading ID can be identified. This could disadvantage many investors such as super, managed and hedge funds. For example, a super fund typically sells a large position on a gradual basis for a prolonged time period.

In this process, it is critical not to be noticed by other traders who may take advantage of such large-scale sales. With complete transparency such as in blockchain, such a sell-off could not be applied effectively. Potentially this may make investors leave the ASX and seek more opaque venues to trade such as dark pools.

Will it work?

Clearly a direct adoption of blockchain from Bitcoin technology would not be viable for the ASX. If the ASX is able to adopt blockchain technology and address privacy, security and trade transparency concerns then this would yield great cost savings to investors.

Authors: Adrian Les, Senior Lecturer in Finance, University of Technology Sydney; KIHoon Hon,  Assistant Professor, University of Technology Sydney

Fintechs – What’s Different This Time?

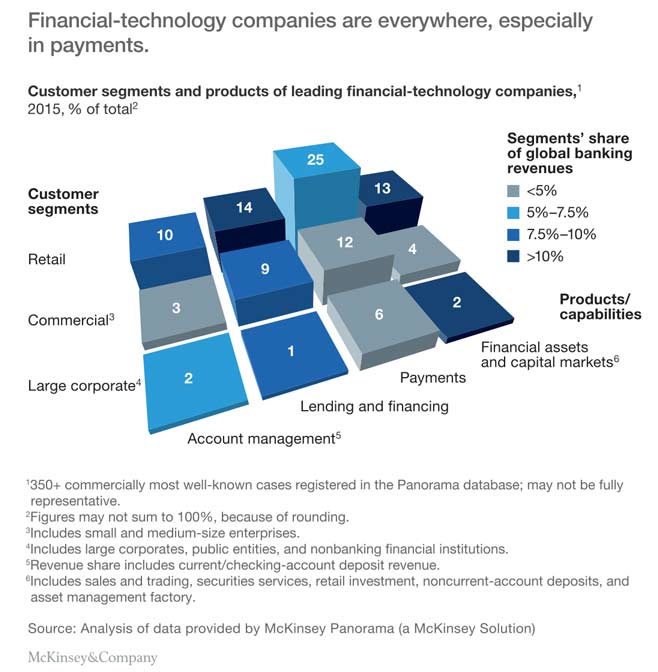
McKinsey has published an article about the rise of Fintechs “Cutting through the noise around financial technology”, and suggests that this time, unlike the dotcom bubble, more is at stake for existing financial services companies. Here is an extract, but we recommend the entire article.

Banking has historically been one of the business sectors most resistant to disruption by technology. Since the first mortgage was issued in England in the 11th century, banks have built robust businesses with multiple moats: ubiquitous distribution through branches; unique expertise such as credit underwriting underpinned by both data and judgment; even the special status of being regulated institutions that supply credit, the lifeblood of economic growth, and have sovereign insurance for their liabilities (deposits). Moreover, consumer inertia in financial services is high. Consumers have generally been slow to change financial-services providers. Particularly in developed markets, consumers have historically gravitated toward the established and enduring brands in banking and insurance that were seen as bulwarks of stability even in times of turbulence.

The result has been a banking industry with defensible economics and a resilient business model. This may now be changing. Our research into financial-technology (fintech) companies has found the number of start-ups is today greater than 2,000, compared with 800 in April 2015. Globally, nearly $23 billion of venture capital and growth equity has been deployed to fintechs over the past five years, and this number is growing quickly: $12.2 billion was deployed in 2014 alone.

Mckinsey-FintechSo we now ask the same question we asked during the height of the dot-com boom: is this time different? In many ways, the answer is no. But in some fundamental ways, the answer is yes. History is not repeating itself, but it is rhyming.

The moats historically surrounding banks are not different. Banks remain uniquely and systemically important to the economy; they are highly regulated institutions; they largely hold a monopoly on credit issuance and risk taking; they are the major repository for deposits, which customers largely identify with their primary financial relationship; they continue to be the gateways to the world’s largest payment systems; and they still attract the bulk of requests for credit.

Some things have changed, however. First, the financial crisis had a negative impact on trust in the banking system. Second, the ubiquity of mobile devices has begun to undercut the advantages of physical distribution that banks previously enjoyed. Smartphones enable a new payment paradigm as well as fully personalized customer services. In addition, there has been a massive increase in the availability of widely accessible, globally transparent data, coupled with a significant decrease in the cost of computing power. Two iPhone 6s handsets have more memory capacity than the International Space Station. As one fintech entrepreneur said, “In 1998, the first thing I did when I started up a fintech business was to buy servers. I don’t need to do that today—I can scale a business on the public cloud.” There has also been a significant demographic shift. Today, in the United States alone, 85 million millennials, all digital natives, are coming of age, and they are considerably more open than the 40 million Gen Xers who came of age during the dot-com boom were to considering a new financial-services provider that is not their parents’ bank. But perhaps most significantly for banks, consumers are more open to relationships that are focused on origination and sales (for example, Airbnb, Booking.com, and Uber), are personalized, and emphasize seamless or on-demand access to an added layer of service separate from the underlying provision of the service or product. Fintech players have an opportunity for customer disintermediation that could be significant: McKinsey’s 2015 Global Banking Annual Review estimates that banks earn an attractive 22 percent ROE from origination and sales, much higher than the bare-bones provision of credit, which generates only a 6 percent ROE.

Macquarie’s Q316 Trading Update

In the latest trading update from Macquarie, despite ructions on the global markets, they said that trading conditions across the Group were satisfactory in the December 2015 quarter. Macquarie continues to expect the FY16 result to be up on FY15. We think they will deliver a profit north of $2.0bn full year.

The annuity-style businesses’ combined December 2015 quarter net profit contribution was up on December 2014 quarter (prior corresponding period) but down on September 2015 quarter (prior period) which benefited from strong performance fees in Macquarie Asset Management. On the other hand, the capital markets facing businesses’ combined December 2015 quarter net profit contribution were down on the prior corresponding period, which benefited from fee income from the Freeport LNG transaction in Commodities and Financial Markets and Macquarie Capital, and up on the prior period.


They reported APRA Basel III Group capital of $A17.3 billion and Group surplus of $A2.8 billion at 31 December 2015.

They said that the Banking and Financial Services’ (BFS) Australian mortgage portfolio was $A27.8 billion at 31 December 2015, up one per cent on 30 September 2015, representing approximately 1.9 per cent of the Australian market. Macquarie platform assets under administration increased to $A59.8 billion at 31 December 2015 up 28 per cent on 30 September 2015 , while BFS deposits increased to $A39.5 billion at 31 December 2015, up two per cent on 30 September 2015. During the quarter, BFS launched the first Macquarie savings and transaction accounts, and new Macquarie Black credit card with premium rewards.

The Group’s short term outlook remains subject to a range of challenges including: market conditions; the impact of foreign exchange; the cost of our continued conservative approach to funding and capital; and potential regulatory changes and tax uncertainties.

Mr Moore said: “Macquarie remains well positioned to deliver superior performance in the medium term due to its deep expertise in major markets, strength in diversity and ability to adapt our portfolio mix to changing market conditions, the ongoing benefits of continued cost initiatives, a strong and conservative balance sheet, and a proven risk management framework and culture.”

Connecting everyone to the internet won’t solve the world’s development problems

From The Conversation.

By 9.30am today I will have skyped Malawi, emailed Ghana, Facebooked Nepal, paid a bill online and used the satnav on my mobile phone. It feels a long time since we first got colour TV at home and, years later, when I accessed the internet using a dial-up modem. When I recalled these moments to my son he yawned. Aged, 19, he doesn’t remember a time before ubiquitous connectivity.

According to a new report from the World Bank, more than 40% of the global population now has internet access. On average, eight in ten people in the developing world own a mobile phone. Even in the poorest 20% of households this number is nearly seven in ten, making cellphones more prevalent than toilets or clean water.

Digital technologies are spreading rapidly in developing countries. Digital Dividends Report

There is no doubt that the world is experiencing a revolution of information and communication technology, bringing about rapid change on a massive scale. But despite great expectations for the power of digital technologies to transform lives around the world it has fallen short and is unevenly distributed, with the most advantages going, as ever, to the wealthy. The World Bank argues that increasing connectivity alone is not going to solve this problem.

Digital dividends

Around the world, digital investments bring growth, jobs and services. They help businesses become more productive, people to find better life opportunities and governments to deliver stronger public services. At their best, the report finds that inclusive, effective digital technologies provide choice, convenience, access and opportunity to millions, including the poor and disadvantaged.

For example, in the Indian state of Kerala the community action project Kudumbashree outsources information technology services to cooperatives of women from poor families – 90% of whom had not previously worked outside the home. The project, which supports micro-credit, entrepreneurship and empowerment, now covers more than half the households in the state.

The World Bank also emphasises that the poorest individuals can benefit from digital technologies even without mobile phones and computers. Digital Green, an NGO working with partners in India, Ethiopia, Afghanistan, Ghana, Niger and Tanzania, trains farmers using community-produced and screened videos.

Many governments are using the most of positive digital dividends to empower their citizens. In countries with historically poor birth registration, for example, a digital ID can provide millions of people with their first official identity. This increases their access to a host of public and private services, such as voting, medical care and bank accounts, enabling them to exercise their basic democratic and human rights.

Digital divides

For every person connected to high-speed broadband, five are not. Worldwide, around four billion people do not have any internet access, nearly two billion do not use a mobile phone, and almost half a billion live outside areas with any mobile signal. Divides persist across gender, geography, age and income.

Across Africa the digital divide within demographic groups remains considerable Digital Dividends Report

Those who are not connected are clearly being left behind. Yet many of the benefits of being online are also offset by new risks.

The poor record of many e-government initiatives points to high failure of technology and communications projects. Where processes are already inefficient, putting them online amplifies those inefficiencies. In Uganda, according to the World Bank, electronic tax return forms were more complicated than manual ones, and both had to be filed. As a result, the time needed to prepare and pay taxes actually increased. The report cites the risk that states and corporations could use digital technologies to control citizens, not to empower them.

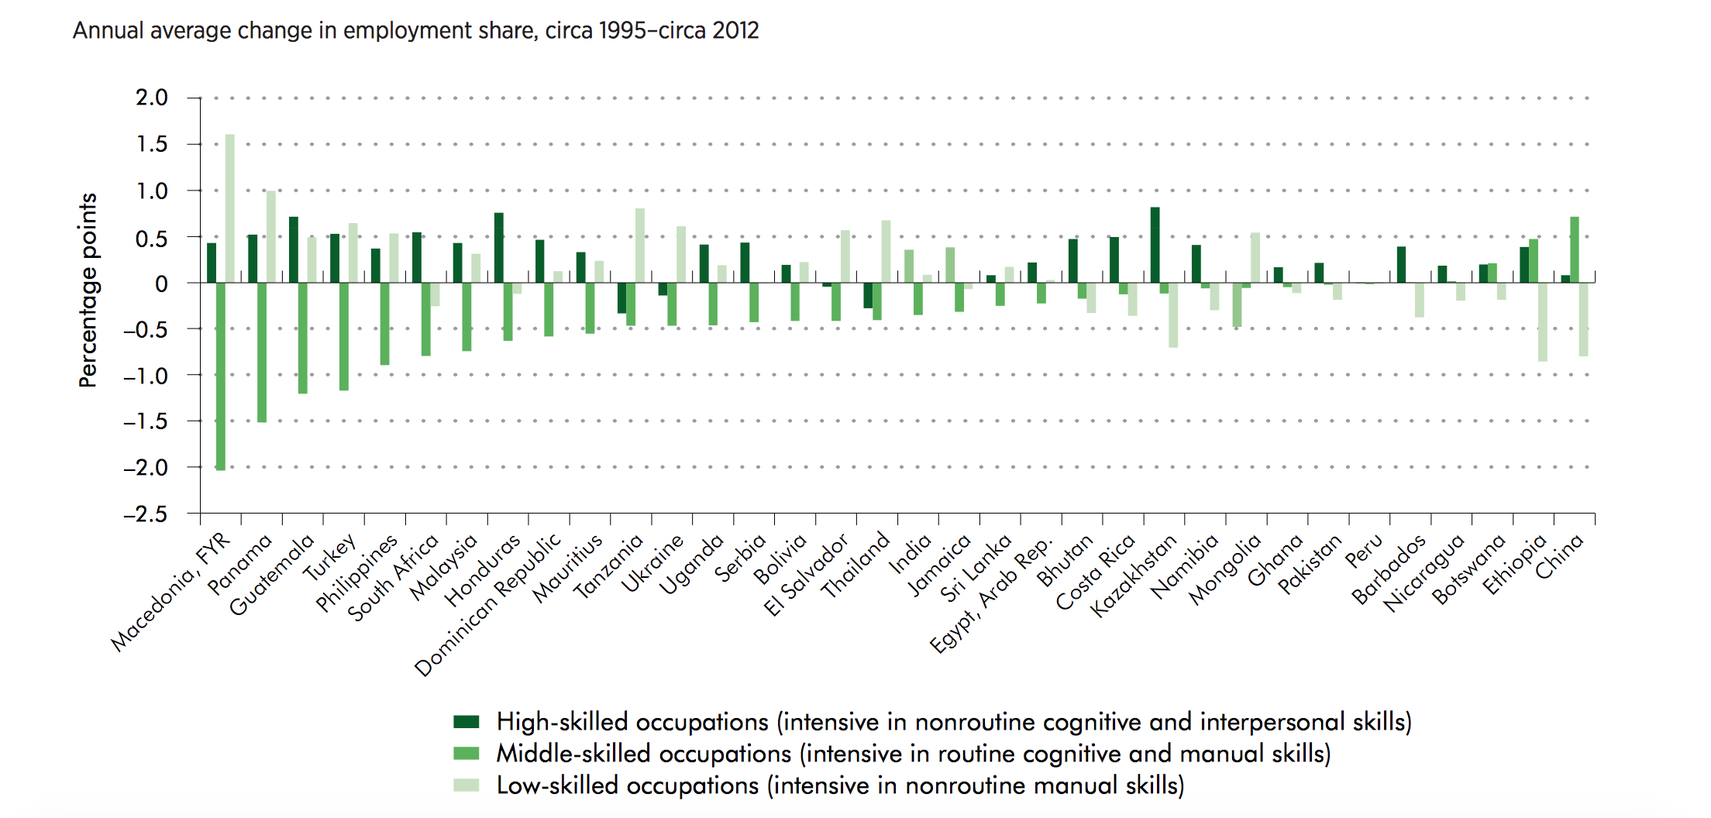
The general disruption of technology in the workforce is complex and yet to be fully understood, but it seems to be contributing to a “hollowing out” of labour markets.

image-20160202-32227-19ydql2The labour market is becoming more polarised in many countries. Digital Dividends Report

Technology augments higher skills while replacing routine jobs, forcing more workers to compete for low-skilled work. This trend is happening around the world, in countries of all incomes, demonstrated by rising shares in high and low-skilled occupations as middle-skilled employment drops. The World Bank notes that:

The digital revolution can give rise to new business models that would benefit consumers, but not when incumbents control market entry. Technology can make workers more productive, but not when they lack the know-how to use it. Digital technologies can help monitor teacher attendance and improve learning outcomes, but not when the education system lacks accountability

Not surprisingly, the better educated, well connected, and more capable have received most of the benefits —- circumscribing the gains from the digital revolution.

A tremendous challenge

The report emphasises that investment in connectivity itself is not enough. In order to achieve the full development benefits of digital investment, it is essential to protect internet users from cybercrime, privacy violations and online censorship, and to provide a full set of “analogue complements” alongside. These include:

  • Regulations, to support innovation and competition
  • Improved skills, to enable access to digital opportunities
  • Accountable institutions, to respond to citizens’ needs and demands

Ultimately, while the World Bank continues to champion connectivity for all as a crucial goal, it also recognises the tremendous challenge in achieving the essential conditions needed for technology to be effective.

In my privileged home, digital technology brings me choice and convenience. It will be a long time before the digital revolution brings similar returns for everyone, everywhere.

Author: Anna Childs, Academic Director for International Development, The Open University

Living Costs Growth Highest For Self-Funded Retirees

The ABS published their data on living costs by household type today, to December 2015. It is worth reading the ABS information about these indices:

The Analytical Living Cost Indexes (ALCIs) have been compiled and published by the ABS since June 2000 and were developed in recognition of the widespread interest in the extent to which the impact of price change varies across different groups of households in the Australian population.

ALCIs are prepared for four types of Australian households:

  • employee households (i.e. those households whose principal source of income is from wages and salaries);
  • age pensioner households (i.e. those households whose principal source of income is the age pension or veterans affairs pension);
  • other government transfer recipient households (i.e. those households whose principal source of income is a government pension or benefit other than the age pension or veterans affairs pension); and
  • self-funded retiree households (i.e. those households whose principal source of income is superannuation or property income and where the Household Expenditure Survey (HES) defined reference person is ‘retired’ (not in the labour force and over 55 years of age)).

A living cost index reflects changes over time in the purchasing power of the after-tax incomes of households. It measures the impact of changes in prices on the out-of-pocket expenses incurred by households to gain access to a fixed basket of consumer goods and services. The Australian Consumer Price Index (CPI), on the other hand, is designed to measure price inflation for the household sector as a whole and is not the conceptually ideal measure for assessing the changes in the purchasing power of the disposable incomes of households.

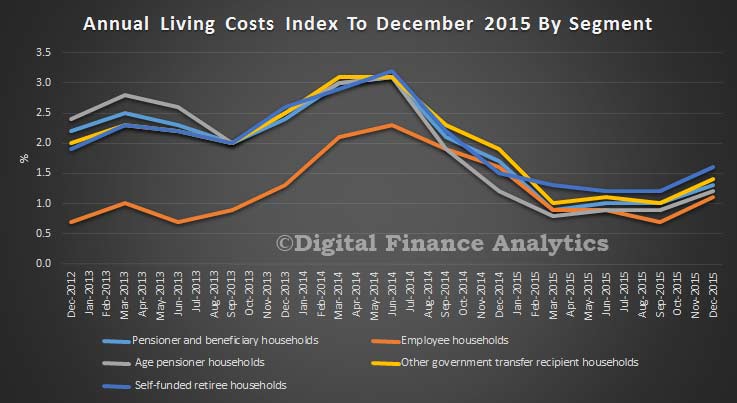
Looking at the data, we see that whilst the living costs have fallen through 2015, they are now on the rise, and self-funded retirees have the higher cost growth rate.

Segment-Costs-of-Living-Dec-2015

There are subtle differences in spending patterns and household mix which contribute to the differences. For example, self-funded retirees spend less on housing, but more on health care and recreation activities.

Table 1 from the ABS,  illustrates significant differences in expenditures, both in total and at the individual commodity group level across the household types. Although differences in incomes are likely to be a major reason for this, other factors such as the demographic make-up of the households and dwelling tenure would also play a part. For example, age pensioner households have on average the lowest number of persons per household and self-funded retiree households have a higher than average rate of outright home ownership.

Table 1: Estimated average weekly expenditure during 2009-10, Household type by Commodity group(a)(b)

PBLCI
Employee
Age pensioner
Other government transfer recipient
Self-funded retiree
CPI
Commodity group
$
$
$
$
$
$

Food and non-alcoholic beverages
135.92
262.48
120.72
150.86
176.66
230.87
Alcohol and tobacco
56.19
114.63
36.12
75.92
68.16
96.87
Clothing and footwear
32.27
64.39
26.31
38.12
43.29
54.58
Housing(c)
135.91
205.32
92.43
178.64
113.89
305.75
Furnishings, household equipment and services
60.00
142.82
59.81
60.20
119.83
124.79
Health
35.91
80.73
47.69
24.32
87.22
72.56
Transport
63.26
182.25
50.65
75.65
118.13
158.39
Communication
26.26
46.45
19.80
32.62
31.84
41.81
Recreation and culture
67.90
194.82
61.91
73.79
215.24
172.30
Education
10.07
45.13
1.54
18.45
9.06
43.67
Insurance and financial services(d)
37.44
218.75
22.19
52.42
39.40
69.71
All groups
661.13
1 557.77
539.17
780.99
1 022.72
1 371.30

(a) Based on 2009-10 Household Expenditure Survey (HES) at June quarter 2011 prices.
(b) Figures may not add up due to rounding.
(c) House purchases are included in the CPI but excluded from the population subgroup indexes.
(d) Includes interest charges and general insurance. Interest charges are excluded from the CPI and general insurance is calculated on a different basis.

Dwelling Approvals Fall For The Eighth Month Straight

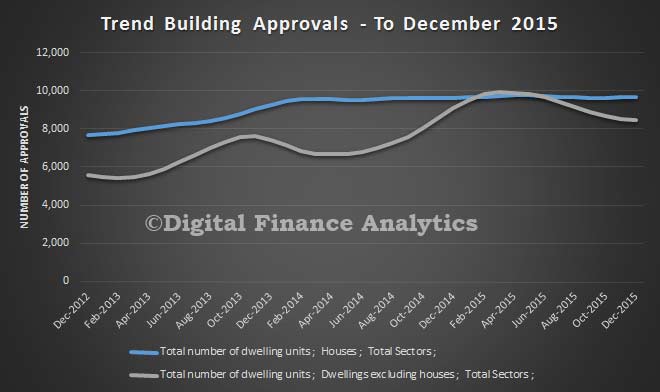
Australian Bureau of Statistics (ABS) Building Approvals show that the number of dwellings approved fell 0.1 per cent in December 2015, in trend terms, and has fallen for eight consecutive months. Building-Approvals-To-Dec-2015
Dwelling approvals decreased in December in the Australian Capital Territory (21.9 per cent), Western Australia (3.1 per cent), Tasmania (0.8 per cent), New South Wales (0.4 per cent) and South Australia (0.4 per cent) but increased in the Northern Territory (1.8 per cent), Victoria (1.6 per cent) and Queensland (1.1 per cent) in trend terms.

In trend terms, approvals for private sector dwellings excluding houses fell 0.1 per cent in December. In contrast, approvals for private sector houses rose 0.1 per cent. Private sector house approvals rose in Queensland (0.8 per cent), Victoria (0.7 per cent) and South Australia (0.5 per cent) but fell in Western Australia (1.8 per cent) and New South Wales (0.2 per cent) in trend terms.

The seasonally adjusted estimate for dwelling approvals rose 9.2 per cent in December following a 12.4 per cent fall in November. The rise in December was driven by dwellings excluding houses (13.5 per cent). The largest state contribution to the rise in total dwellings in December came from Victoria (37.4 per cent).

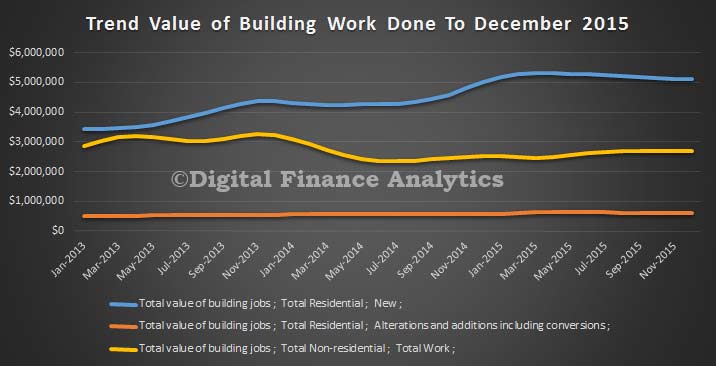
The value of total building approved rose 0.2 per cent in December, in trend terms, after falling for four consecutive months. The value of residential building rose 0.1 per cent while non-residential building rose 0.4 per cent.

Building-Value-To-December-2015

Mortgage delinquencies on the rise, says Moody’s

From Australian Broker.

Changing economic conditions at home and abroad will result in an increase in the number of Australian mortgage delinquencies in the coming year, according to credit rating firm Moody’s.

The latest monthly review of the performance of Australian prime residential mortgages by ratings firm Moody’s shows delinquencies in excess of 30 days rose to 1.20% in November 2015 from 1.14% in October 2015.

Moody’s puts that monthly increase down to seasonal factors such as household overspending in the run up to Christmas, but still believes 2016 will see a higher number of delinquencies than 2015.

“The housing market has shown signs of cooling over recent months,” Moody’s assistant vice president – analyst Alana Chen said.

“Strong housing market activity in both Sydney and Melbourne helped foster relatively strong economic performance in the respective states of New South Wales and Victoria in 2015.

“But a slower pace of house price growth will mean a slowdown in economic activity and will contribute to a deterioration in mortgage performance in 2016 from current exceptionally healthy levels.”

Moody’s predicts the slower growth of house prices will continue as the Australian economy faces some challenges through 2016.

“Slowing growth in China, Australia’s biggest export market, and declining commodity prices, which are at or near multi-year lows, will also put pressure on the Australian economy and contribute to below-trend growth and a soft labour market in 2016,” Chen said.

But while Moody’s predicts a growing number of borrowers are at risk of becoming delinquent, not all are convinced that will be the case.

“With all respect to Moody’s, who have a number of economists working on this sort of thing, I find it difficult to believe we’re going to see a real rise in the number of delinquencies,” Jane Slack-Smith, director of Investors Choice Mortgages, told Australian Broker‘s sister publication, Your Investment Property.

“I’ve been a broker for 10 years and a property investor for a long time too and that’s given me a lot of experience in  reading the market and I can’t really see anything at the moment that’s going to cause a rise (in delinquencies).”

Slack-Smith believes the period of low interest rates have allowed a large proportion of Australian borrowers to get in position where they a comfortable with their financial commitments, while others have been prevented from getting in over their heads.

“With the lower interest rates we’ve had I think a lot of people have taken advantage of that. A lot of people have built up their redraw or offset account so they’re in a position where they’re pretty comfortable with everything,” she told Your Investment Property.

“The other thing is that the APRA and ASIC changes have quelled a lot of irresponsible lending that might have happened.

“It was a pretty heavy handed approach, but the fact that people were assessed on a 7.5% interest rate and the servicing criteria was made tougher means there’s already been a buffer built in so that people can manage if we do see interest rates start to move up.”