“22 of the Cutest Baby Animals,” the headline said. “You won’t believe number 11!”
Despite an impending deadline – not to mention my skepticism (how cute could they possibly be?) – I clicked on the story. I’m only human, after all. Yet this failure in self-regulation cost me at least half an hour of good work time – as have other clickbait headlines, bizarre images on my Twitter feed or arguments on Facebook.
The insidious, distracting suck of the Internet has become seemingly inescapable. Calling us from our pockets, lurking behind work documents, it’s merely a click away. Studies have shown that each day we spend, on average, five and a half hours on digital media, and glance at our phones 221 times.
Meanwhile, the developers of websites and phone apps all exploit human behavioral tendencies, designing their products and sites in ways that attract our gaze – and retain it. Writing for Aeon, Michael Schulson points out:
Developers have staked their futures on methods to cultivate habits in users, in order to win as much of that attention as possible.
Given the Internet’s omnipresence and its various trappings, is it even possible to rein in our growing Internet consumption, which often comes at the expense of work, family or relationships?
Psychological research on persuasion and self-control suggests some possible strategies.
Tricks for clicks
It’s important to realize some of the tricks that Internet writers and web developers use to grab our attention.
The strange number 22 in the headline is an example of the “pique” technique. Lists are usually round numbers (think of Letterman’s Top 10 lists or the Fortune 500). Unusual numbers draw our attention because they break this pattern. In a classic study, the social psychologist Anthony Pratkanis and colleagues found that passersby were almost 60 percent more likely to give money to panhandlers asking for US$0.37 compared to those who were asking for a quarter.
People in the study also asked more questions of the panhandlers who requested strange amounts, compared to those who begged for a quarter. The same thing happened when I saw the headline. In this case, the skepticism that caused me to ask the question “How cute could they possibly be?” backfired: it made me more likely to click the link.
An attention pique (such as asking for $0.37 or calling out photo #11) triggers us to halt whatever we’re doing and reorient to the puzzle. Questions demand answers. This tendency has been dubbed by psychologists as the rhetorical question effect, or the tendency for rhetorical questions to prompt us to dig deeper into an issue.
These tricks exploit built-in features of our minds that otherwise serve us well. It’s clearly advantageous that unexpected stimuli capture our attention and engage us in a search for explanation: it might stop us from getting hit by a car, or alert us to sudden and suspicious changes to the balance in our bank account.
So it wouldn’t make sense to turn off that kind of vigilance system or teach ourselves to ignore it when it sounds an alarm.
Binding ourselves to the mast
Content on the net isn’t only designed to grab our attention; some of it is specifically built to keep us coming back for more: notifications when someone replies to a posts, or power rankings based on up-votes. These cues trigger the reward system in our brains because they’ve become associated with the potent reinforcer of social approval.
Not surprisingly, Internet use is often framed in the language of addiction. Psychologists have even identified Problematic Internet Use as a growing concern.
So what can we do?
Like Odysseus’ strategy for resisting the temptation of the sirens, perhaps the best trick is to commit ourselves to a different course of action in advance – with force, if necessary.
Odysseus had his men tie him to the mast of their ship until they were out of the sirens’ range. This is an example of “precommitment,” a self-control strategy that involves imposing a condition on some aspect of your behavior in advance. For example, an MIT study showed that paid proofreaders made fewer errors and turned in their work earlier when they chose to space out their deadlines (e.g., complete one assignment per week for a month), compared to when they had the same amount of time to work, but had only one deadline at the end of a month.
John William Waterhouse’s ‘Ulysses and the Sirens’ (1891).Wikimedia Commons
The modern-day equivalent of what Odysseus did is to use technology to figuratively bind oneself to the mast. Software packages such as Cold Turkey or the appropriately named SelfControl allow you to block yourself out from certain websites, or prevent yourself from signing onto your email account for a prespecified period of time.
Researchsupports the reasoning behind these programs: the idea that we often know what’s best for our future selves – at least, when it comes to getting work done and staying free of distraction.
Coming out with your commitment
If you really must win a game of chicken, the best way is to accelerate to top speed, remove the steering wheel and brake from your car, and throw them out the window – all in view of your opponent.
In a less dramatic fashion, precommitments can be much more effective when they’re announced in public. Researchers have found that people who publicly commit to a desired course of action such as recycling or being sociable are more likely to follow through than people who keep their intentions private. We are deeply social creatures with a fundamental need to belong, and publicly declaring a plan puts one’s reputation at stake. Between the social pressure to live up to expectations and any internal sanctions we self-impose, public precommitment can be a powerful two-pronged attack against self-control failure.
More and more, scientists who study self-control are starting to see tools such as precommitment and software that blocks out websites not as “hacks” that circumvent the system but instead as integral pieces in the self-control puzzle.
For example, a recent study tracked the everyday lives of a large sample of people on a moment-by-moment basis, asking them questions about their goals, temptations and abilities to resist them.
Contrary to expectations, the people who were generally good at self-control (measured with a reliable questionnaire) were not the best at resisting temptations when the temptation presented itself. In fact, they were generally pretty bad at it.
The key is that self-control and resisting temptation are not the same thing. Odysseus had one, but not the other.
Instead, good self-control was characterized by the ability to avoid temptations in the first place. We often think of self-control as the ability to white-knuckle our way through temptation, but studies such as this one indicate that self-control can also be as simple as planning ahead to avoid those traps.
The next time you need to get something done, consider precommitting to avoiding the Internet altogether. Like Odysseus, realize that if you find yourself facing temptation directly, the battle may already be lost.
Author: Elliot Berkman, Assistant Professor, Psychology, University of Oregon
According to the February 2016 CoreLogic RP Data Hedonic Home Value Index results released today, dwelling values across Australia’s combined capital cities showed a 0.5% rise in February, pushing dwelling values 1.4% higher over the past three months.
In February, home values rose across each capital city with the exclusion of Perth and Canberra. Over the past three months, dwelling values have increased across all capitals except Sydney (-0.2%). The largest monthly increases in home values were recorded in the cities that have been underperforming over the growth cycle to date; Hobart dwelling values were 2.9% higher, Adelaide showed a 1.9% rise, and Brisbane home values increased by 1.8%. Perth and Canberra were the only cities to record a monthly fall in values, down -1.1% and -0.2% respectively.
Index results as at February 29, 2016
Sydney was the only capital city to have recorded a fall in dwelling values over the past three months, down -0.2%. The cities to record the greatest value rises over the past three months have been: Hobart (8.5%), Melbourne (3.8%) and Brisbane (2.0%). According to CoreLogic RP Data head of research Tim Lawless, “Even though home values have trended lower over the year in Perth and Darwin, they have recorded value rises of 0.2% and 0.3% respectively over the past three months.”
Dwelling values are still increasing across most capital cities however, the results remain diverse. Sydney and Melbourne remain the strongest markets in trend terms, however, the gap is widening between the performances of Melbourne relative to Sydney.
Over the past 12 months, combined capital city home values have increased by 7.6%, with the annual rate of growth down from a recent peak of 11.1% recorded in July last year. Melbourne has maintained its number one growth position, with annual capital gains of 11.1%. Mr Lawless said, “Melbourne values appear to be holding reasonably firm since December last year with the annual rate of capital gain virtually level over the past three months.”
Sydney’s annual rate of growth has continued to moderate, having almost halved from its cyclical peak of 18.4% recorded in July last year to reach 9.5% growth over the past twelve months. Despite the slowing trend, Sydney remains the second best performing capital city over the past twelve months, however, Mr Lawless said, “a few of the smaller cities, where growth rates have recently accelerated, may start to rival Sydney’s position over the coming months.”
“The trend in home value growth is showing signs of increasing in those markets that have previously underperformed. These include Brisbane, Adelaide, Hobart and Canberra. Affordability constraints aren’t as apparent in these cities and rental yields haven’t been compressed to the same extent as what they have in Melbourne or Sydney. Home values increased in Brisbane by 5.5% over the past year, which is the fastest annual rate of value growth in a year. In Hobart, home values are 6.2% higher over the year, which is its fastest annual rate of home value growth since July 2010,” Mr Lawless said.
The net profit after tax for all ADIs was $36.8 billion for the year ending 31 December 2015. This is an increase of $2.4 billion (6.9 per cent) on the year ending 31 December 2014.The cost-to-income ratio for all ADIs was 49.4 per cent for the year ending 31 December 2015, compared to 49.2 per cent for the year ending 31 December 2014. The return on equity for all ADIs was 13.8 per cent for the year ending 31 December 2015, compared to 14.3 per cent for the year ending 31 December 2014.
The total assets for all ADIs was $4.58 trillion at 31 December 2015. This is an increase of $241.3 billion (5.6 per cent) on 31 December 2014.The total gross loans and advances for all ADIs was $2.95 trillion as at 31 December 2015. This is an increase of $206.4 billion (7.5 per cent) on 31 December 2014.
The total capital ratio for all ADIs was 13.9 per cent at 31 December 2015, an increase from 12.5 per cent on 31 December 2014.The common equity tier 1 ratio for all ADIs was 10.2 per cent at 31 December 2015, an increase from 9.1 per cent on 31 December 2014.The risk-weighted assets (RWA) for all ADIs was $1.87 trillion at 31 December 2015, an increase of $120.6 billion (6.9 per cent) on 31 December 2014.
For all ADIs, impaired facilities were $13.6 billion as at 31 December 2015 (chart 7). This is a decrease of $2.3 billion (14.6 per cent) on 31 December 2014. Past due items were $11.7 billion as at 31 December 2015. This is an increase of $317 million (2.8 per cent) on 31 December 2014. Impaired facilities and past due items as a proportion of gross loans and advances was 0.86 per cent at 31 December 2015, a decrease from 1.00 per cent at 31 December 2014. Specific provisions were $6.4 billion at 31 December 2015. This is a decrease of $543 million (7.9 per cent) on 31 December 2014; and specific provisions as a proportion of gross loans and advances was 0.22 per cent at 31 December 2015, a decrease from 0.25 per cent at 31 December 2014.
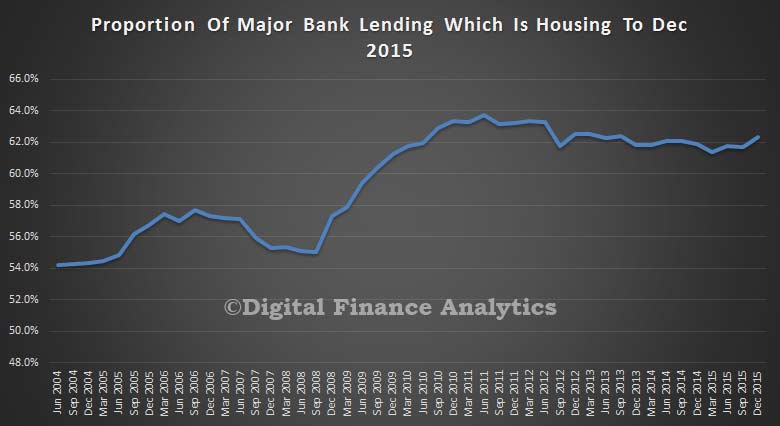
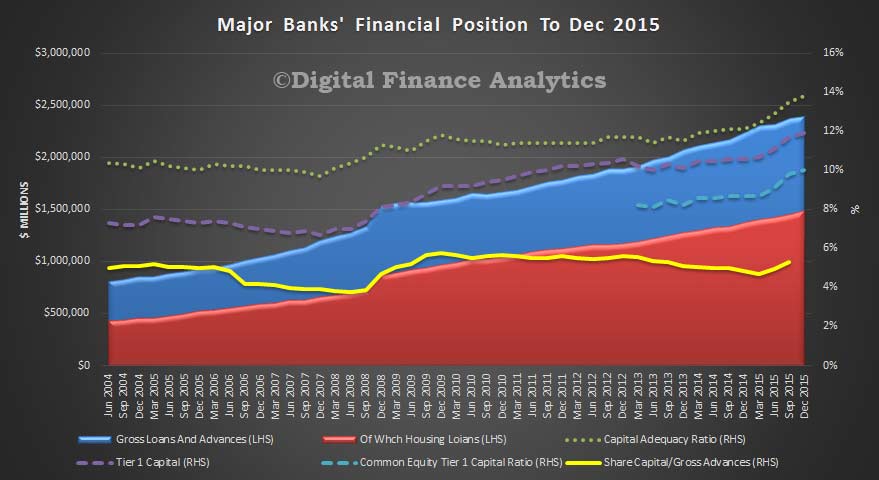
Turning to the big four major banks, we see that 62% of all of their lending is for housing (either owner occupied or investment), so they are highly concentrated in this sector of the market. Note the rise from mid-fifties in 2004, the peak in 2011, and the new upward trend in recent quarters. Banks have their eggs firmly in the residential property basket.
If we look at their ratios, we see capital rising, under the direction of the regulators, with the ratio of share capital to gross advances rising from 4.9% to 5.3%, but you can still see the highly leveraged state of the banks, and their absolute reliance on profits from home lending. For every $100 lent on housing, shareholders are risking $5. Not a bad proposition (for them).
Recent media coverage about mortgage brokers has been quite negative, with allegations of poor ethical standards and false application data being used by some to bolster loan applications. So in this post and in our latest video blog we look at data from our household surveys to portray the current state of play.
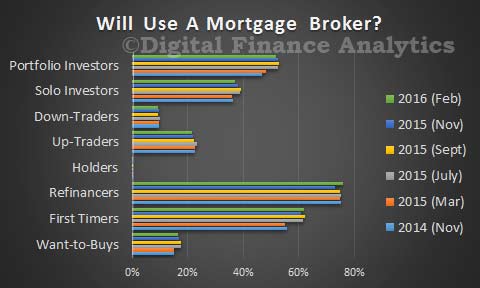
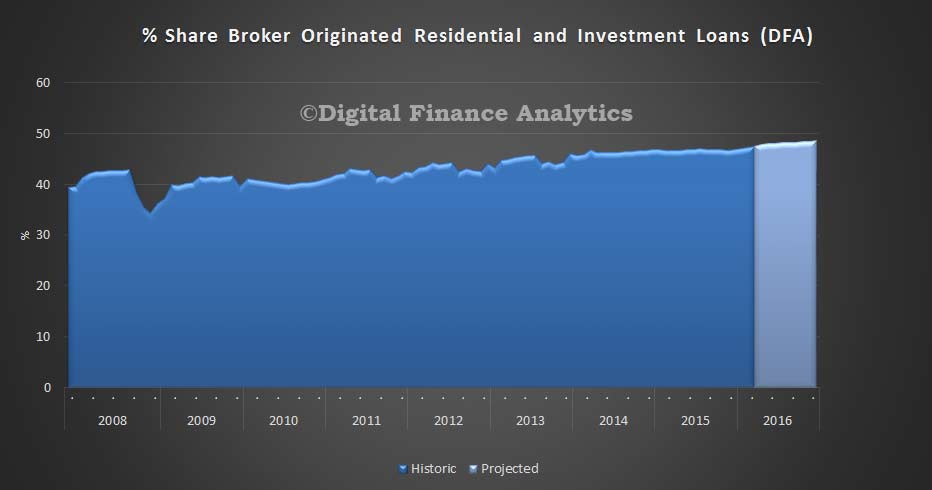
To begin, mortgage brokers have become a significant feature in the mortgage industry landscape. Indeed almost half of new loans are now originated by brokers. Different household segments have different propensities to use brokers. Those seeking to refinance, first time buyers and property investors are most likely to use a mortgage broker.
We expect this growth to continue, thanks to the current appetite for refinancing, and the broker focus now apparent among major banks. For example CBA, in their recent results reported to December 2015 that 45% of their loans came via the broker channel, up from 40% a year earlier. In addition regional players and credit unions are using brokers, alongside foreign banks operating here and the non-bank sector.
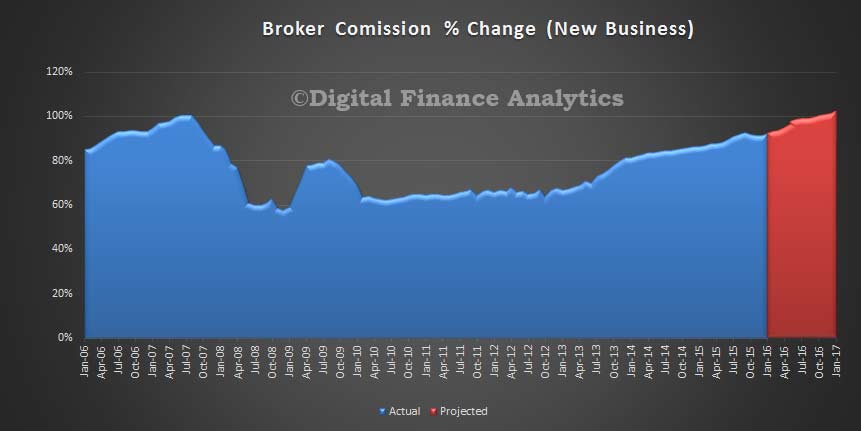
Commissions have been tweaked recently, and the industry commission take is now back up to pre-GFC levels, (after adjusting for inflation) because whilst overall commissions were trimmed, volumes have grown.
Remember that brokers get a commission payment at the start of the loan, as well as a trail paid in subsequent years. The bigger the loan, the bigger the commission. Very few aggregators normalise actual commissions paid – although Mortgage Choice does, so they claim their brokers are less influenced by commission structures.
“At Mortgage Choice we pay your broker the same rate, no matter which home loan you choose from our wide choice of lenders. That means you can tap into a Mortgage Choice broker’s expertise at no charge, with peace of mind that they have your best interests at heart”.
Some brokers refund a proportion of the commission from the lender back to the borrower. For example Peach Home Loans says:
“When we arrange your loan we are doing quite a bit of the work that the lender’s staff would otherwise have to do and as a result the lenders pay us a commission on the upfront (loan amount) – this is typically around 0.6% or $600 per $100,000. We try to recover our costs from this commission and then share what is left over with you. Lenders also pay us a small trailing commission typically from 0.15% to 0.25% pa paid on the outstanding loan balance … and this is where we try to make our profit.. after all we are in business to make a profit.”
Consider next who is the broker working for? Whilst some are directly employed by banks or aggregators, others are self employed businesses. They are mostly aligned to aggregators or banks to get access to the lender lists and access to various tools and calculators. As a broker, they want to do a deal and the legislation controlling their conduct says they need to consider the financial status of an applicant to ensure the loan is “not unsuitable.” From ASIC’s responsible lending provisions:
“As a credit licensee, you must decide how you will meet the responsible lending obligations. RG 209 sets out our expectations for compliance. Meeting your responsible lending obligations will require taking three steps:
make reasonable inquiries about the consumer’s financial situation, and their requirements and objectives;
take reasonable steps to verify the consumer’s financial situation; and
make a preliminary assessment (if you are providing credit assistance) or final assessment (if you are the credit provider) about whether the credit contract is ‘not unsuitable’ for the consumer (based on the inquiries and information obtained in the first two steps).
In addition, if the consumer requests it, you must be able to provide them with a written copy of the preliminary assessment or final assessment (as relevant)”.
This is quite weak protection, because suitability may depend on many factors, including financial sophistication of the potential borrowers, income and expenditure assessments and other elements.
The list of lenders a broker may consider will depend on the lender panel they have access to. Most brokers will access a restricted list of potential lenders, and cannot offer a “whole of market” view of options. Quite often they will use on-line tools with a client to come up with the best deals, although often the basis for selection and lender recommendation is vague and is often not fully disclosed.
Some brokers are very proactive when it comes to shepherding the loan application through to funding, others less so. Some brokers will also keep a diary note to instigate a possible refinance conversation down the track.
But, to be clear, whilst many brokers will give good advice, they are in an area of potential conflict thanks to commissions, and limitations thanks to the panel. Brokers should be disclosing potential commissions and also their selection criteria.
The alleged poor conduct where brokers falsify applicant data is in our view a marginal activity of a “few bad apples.” That said, consumers should be using a mortgage broker with their eyes open. Ask yourself if the broker is truly working in your best interests.
APRA recently said that they considered loans written via brokers to be more risky than loans written direct by the banks. APRA chairman Wayne Byres said:
“Third-party originated loans tend to have a materially higher default rate compared to loans originated through proprietary channels.”
So we decided to analyse our current household survey data, looking at relative risks between third party (broker) and first party (bank) loans. We tested risks by asking households about their perceived sensitivity to interest rate rises on mortgage loans. You can read about our approach here.
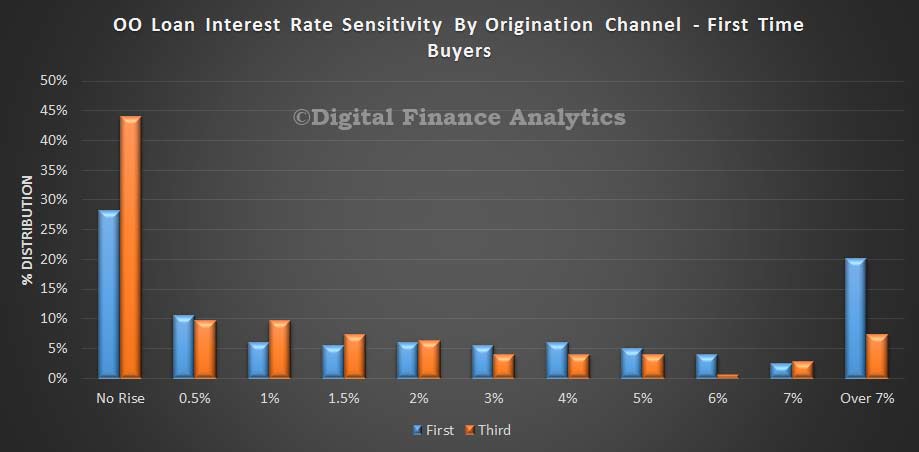
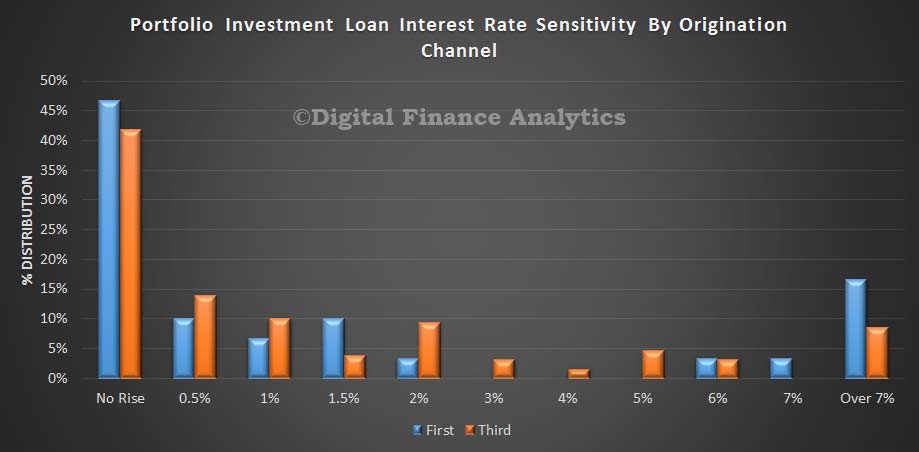
The results show that households who originated loans via brokers have less headroom and more exposure to potential interest rate rises (should they occur). For example, among owner occupied first time buyers, 28% of those who got a loan direct from a bank said they would have difficulty if rates rose at all from their current levels, whereas for owner occupied borrowers via a broker this rose to 43%, a significantly higher proportion. Further analysis showed that on average loans via brokers was at a higher loan to value and loan to income ratio than those direct via the bank.
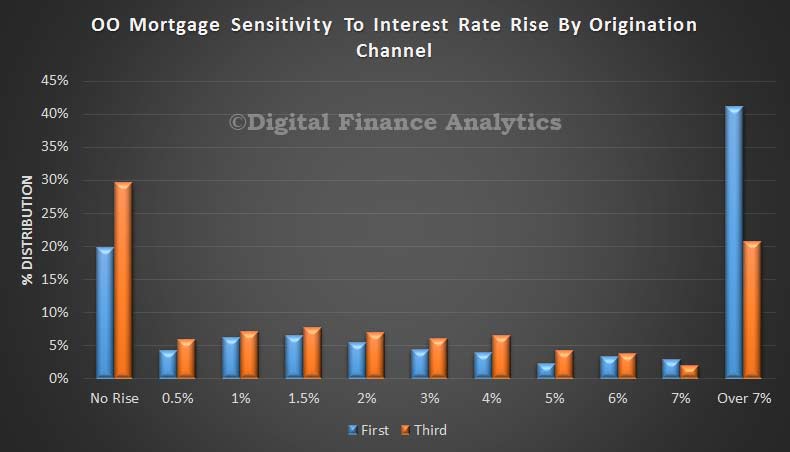
There was a similar, though less extreme shift in risk across all owner occupied portfolios, with 40% of borrowers direct from a bank saying they could cope with more than 7% rise, compared with 20% of those via a broker.
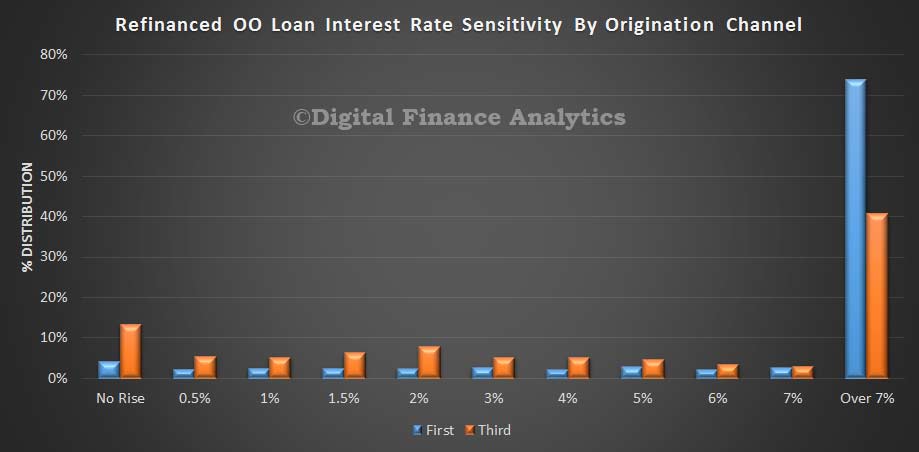
Looking at refinanced owner occupied loans we again saw a higher proportion less able to cope with a rise in rates among households who got their loan via a broker channel.
On the investment property side of the ledger, among portfolio investors – those with multiple properties in a portfolio, there was a higher proportion who would be exposed by any rate rise among those going direct to a bank, compared with a broker – but the difference is quite small and combined more than 40% of portfolio investors would have issues if rates rose.
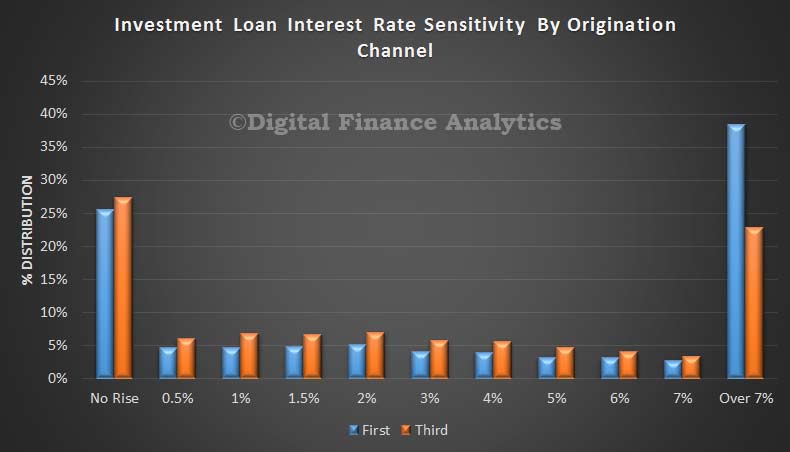
When we looked at all investment loans, we found that households who obtained a loan via a broker were slightly more likely to be under the gun if rates rose, and a significantly higher proportion of borrowers who went direct to a bank were confident of handling a rise of more than 7% from current levels.
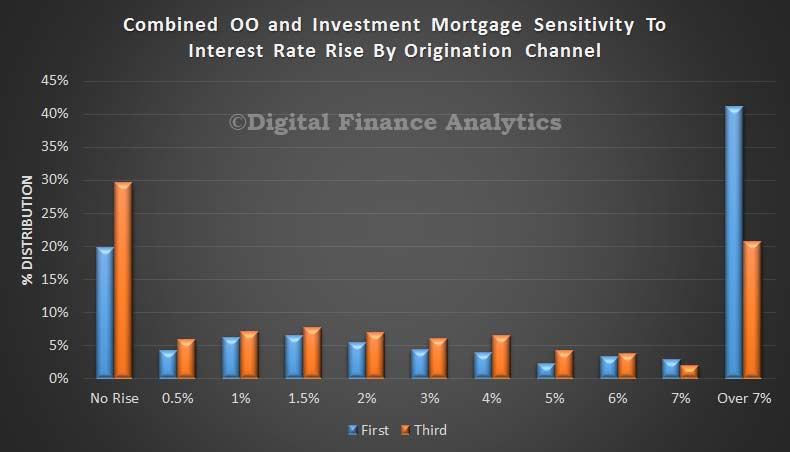
Consolidating all the results, we conclude that households who accessed loans via brokers have on average less head room to accommodate rate rises compared with those who went direct. APRA is correct.
Recent information suggests that the global economy is continuing to grow, though at a slightly lower pace than earlier expected. While several advanced economies have recorded improved growth over the past year, conditions have become more difficult for a number of emerging market economies. China’s growth rate has continued to moderate.
Commodity prices have declined very substantially over the past couple of years. This partly reflects slower growth in demand but also, in some key instances, large increases in supply. The decline in Australia’s terms of trade has continued.
Financial markets have once again exhibited heightened volatility over recent months, as participants grapple with uncertainty about the global economic outlook and policy settings among the major jurisdictions. Appetite for risk has diminished somewhat and funding conditions for emerging market sovereigns and lesser-rated corporates have tightened. But funding costs for high-quality borrowers remain very low and, globally, monetary policy remains remarkably accommodative.
In Australia, the available information suggests that the expansion in the non-mining parts of the economy strengthened during 2015 despite the contraction in spending in mining investment. This was reflected in improved labour market conditions. The pace of lending to businesses also picked up.
Inflation is quite low. With growth in labour costs continuing to be quite subdued as well, and inflation restrained elsewhere in the world, inflation is likely to remain low over the next year or two.
Given these conditions, it is appropriate for monetary policy to be accommodative. Low interest rates are supporting demand, while supervisory measures are working to emphasise prudent lending standards and so to contain risks in the housing market. Credit growth to households continues at a moderate pace, albeit with a changed composition between investors and owner-occupiers. The pace of growth in dwelling prices has moderated in Melbourne and Sydney and has remained mostly subdued in other cities. The exchange rate has been adjusting to the evolving economic outlook.
At today’s meeting, the Board judged that there were reasonable prospects for continued growth in the economy, with inflation close to target. The Board therefore decided that the current setting of monetary policy remained appropriate.
Over the period ahead, new information should allow the Board to judge whether the improvement in labour market conditions is continuing and whether the recent financial turbulence portends weaker global and domestic demand. Continued low inflation would provide scope for easier policy, should that be appropriate to lend support to demand.
ANZ today announced the appointment of Maile Carnegie to the role of Group Executive Digital Banking reporting to Chief Executive Officer Shayne Elliott.
Maile joins ANZ from Google where she has been Managing Director Australia and New Zealand since 2013. Previously she was Managing Director for Procter & Gamble in Australia and New Zealand having worked at Procter & Gamble for over 20 years including as General Manager for Asia Strategy, Marketing and Design based in Singapore and in senior marketing and commercial roles in the United States.
At ANZ Maile will lead the strategic development and delivery of a superior digital experience for the bank’s eight million retail, commercial and institutional customers, as well as for its staff. This includes digital projects, innovation and strategic relationships with the FinTech sector. Reflecting digital’s importance to ANZ’s performance, Maile will also have shared responsibility for the financial results of the bank’s Australian and New Zealand Divisions.
Maile will be a member of the Group Executive Committee and have Group responsibility for Marketing including ANZ’s brand, advertising and sponsorship.
Commenting on Maile’s appointment Mr Elliott said: “Digital banking is at the heart of our strategy to create a superior experience for our customers and our people.
“We have a great digital foundation with applications such as GoMoney and FastPay and the recent redevelopment of anz.com. Maile’s appointment recognises that digital is central to driving revenue growth and to successfully competing in a changing and disrupted environment where technology and brand are key sources of differentiation.
“Part of Maile’s role will also be to shift our thinking and champion a Group-wide innovation culture at ANZ based on developing and attracting service-focused, technology-literate, innovative and experimental people and teams. This includes being the sponsor of a new Digital Business Transformation Leadership Program created jointly by ANZ and the Massachusetts Institute of Technology.
“I am incredibly pleased to have Maile join us. Her experience at Google, her track record in building brands and business in Australia and in Asia, and her leadership”
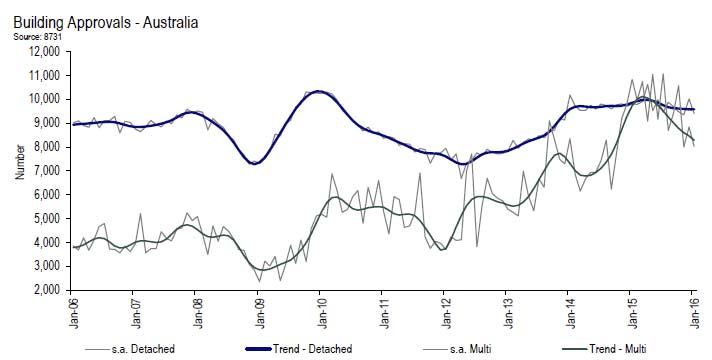
ABS figures show that new home building approvals faltered during the first month of 2016, said the Housing Industry Association (HIA). “January 2016 was a rather weak month for new home building approvals, with both detached house approvals and those for multi-units falling back compared with December,” noted HIA Senior Economist
Shane Garrett.
During January 2016, new home building approvals declined by 7.5 per cent. This comprised a 6.1 per cent drop in detached house approvals and a reduction of some 9.1 per cent in multi-unit approvals. Over the past year, approvals totalled some 231,752 which is 10.6 per cent higher than the previous 12 month period and still very strong by historical standards. “Towards the end of 2015, the residential building industry was hit by a number of unfavourable developments. The major banks increased their mortgage interest rates, credit conditions were tightened for domestic investors and the $5,000 foreign investor fee came into force. This has made it more difficult to deliver new housing supply and today’s figures seem to bear this out,” Shane Garrett pointed out.
During January 2016, total seasonally adjusted new home building approvals saw the largest increase in South Australia (+14.2 per cent), followed by Western Australia (+7.2 per cent) and Victoria (+2.9 per cent). The volume of approvals fell in New South Wales (-22.9 per cent), Queensland (-13.4 per cent) and Tasmania (-11.1 per cent). In trend terms, approvals saw a 9.4 per cent decline in the Northern Territory and contracted by 11.4 per cent in the Australian Capital Territory.
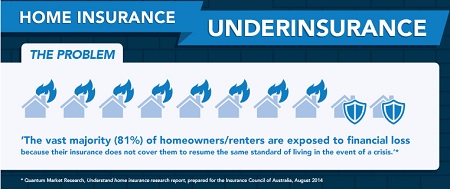
The vast majority of households with home insurance may well be exposed to unexpected loss according to ASIC. Following a survey of 23 home insurance brands covering 12 insurers, ASIC is calling for further improvements across the sector to help consumers make good decisions about their home insurance cover.
In response to ASIC’s recommendations from October 2014, insurers have made a range of improvements. In particular, most insurers have implemented, or are implementing, the following changes:
Incorporating a sum insured calculator into point of sale processes, including through updated sales scripts, and providing better access to online calculators. This helps consumers select an appropriate sum insured amount during the quote and sales process, an important way to help reduce the risk of underinsurance; since October 2014, four additional insurers have made available sum insured calculators in both their telephone and online sales channels.
Training staff so that information provided to consumers about the sum insured, and the maximum amount paid by the insurer, is clear and in plain English; since October 2014, an additional eight insurers have adopted this practice for their telephone sales and an additional 11 for their online sales.
Providing information or assistance to consumers about the effect of changes to building codes which may increase the cost of rebuilding homes after a total loss; since October 2014, four additional insurers have made changes to provide this information.
Although welcoming these changes, ASIC’s survey identified that there is scope for insurers to take additional steps. In particular, we would like insurers to help consumers select the right insurance cover by:
explaining that the sum insured amount needs to enable complete replacement of contents or complete rebuilding of their home;
providing guidance about coverage or sum insured amounts, rather than simply referring consumers to the product disclosure statement;
referring to the Key Facts Sheet to assist decision making; and
providing information and guidance about natural perils risks and additional rebuilding costs due to natural perils, to better estimate rebuilding costs after a total loss.
An example of an initiative that is aimed at providing more information and guidance to consumers is one insurer’s website that allows consumers to enter their suburb or postcode and receive targeted information about that area including relevant risks, types of claims, types of weather events, and a dollar figure for how much other consumers in the area insure their building and contents.
ASIC has been working with the insurance industry to better understand barriers to the provision of financial product advice to consumers purchasing home insurance. ASIC has already taken steps to encourage and facilitate insurers operating under general advice models to provide useful information to consumers.
‘ASIC is keen to see industry make improvements in all of the areas identified in ASIC’s 2014 report,’ ASIC Deputy Chair Peter Kell said.
‘Our goal is to make sure that consumers buy insurance that better meets their needs – including by helping to reduce levels of underinsurance, especially when there are natural disasters.’
ASIC will continue this work with the insurance industry to further enhance the sector’s ability to assist consumers in purchasing home insurance that better meets their needs.
Background
ASIC released two reports in October 2014 exploring consumer experiences with the sale of home insurance.
In Report 415, ASIC reviewed the sales practices of 13 insurers who sell home insurance across Australia. Report 415 found that for sum insured policies, it is important to help consumers to set an appropriate sum insured amount, so that they are adequately insured in the event of a total loss.
Most home insurance policies in Australia are ‘sum insured’ policies, where the insurer agrees to pay only up to an agreed amount (the sum insured), nominated by the consumer, to repair or rebuild a damaged or destroyed home.
ASIC encourages insurers to inform consumers that the building sum insured amount should reflect the amount that it would cost to completely rebuild their home. Similarly, the contents sum insured amount should reflect the amount it would cost to completely replace all contents with new items at today’s prices. The sum insured amount should also reflect the cost to rebuild the consumer’s home to meet new building codes and standards, and any other supplementary costs. For information on supplementary costs see MoneySmart’s page on home insurance supplementary costs
Findings from Report 415 were considered in the Financial System Inquiry which called for improved guidance (including tools and calculators) and disclosure for general insurance, especially in relation to home insurance. The Government has agreed to support work by industry to increase guidance and disclosure in general insurance.
ASIC also notes and welcomes subsequent industry recommendations targeted at effective disclosure. Some of the Effective Disclosure Taskforce’s recommendations align with ASIC’s findings, particularly in relation to improving the provision of information to consumers about natural hazard risk, and integrating sum insured calculators into the sales process.
The association between life expectancy and postcodes, neighbourhood locations or train stations has been demonstrated in many different locations around the world. These include London and Glasgow in the UK and across the US including California.
These studies paint a powerful picture of health inequalities across neighbourhoods and cities. They also concisely communicate the importance of social determinants of health. More simply, they tell us that health starts where we live, work, learn and play.
In an earlier article, we have argued that the liveability of an area is closely associated with the social determinants of health. A liveable neighbourhood should include the following key ingredients:
is safe, socially cohesive and inclusive
environmentally sustainable and supported by trees and biodiversity
has affordable and diverse housing supported by public transport, walking and cycling
is linked to employment, education, public open space, local shops, health and community services, leisure, arts and culture.
So what happens if you live in an area with more or less of these key ingredients?
The answer is postcode-related differences in health outcomes. These differences can be measured by death rates and life expectancy.
This has led to the development of clever communication tools that map life expectancy to train stations. Until now, such maps have not been produced for Australian cities.
Community Indicators Victoria at the University of Melbourne seeks to translate data into action. The project has developed a map that demonstrates the existence of health inequalities across Melbourne using data from the Australian Bureau of Statistics (ABS). We have mapped area-level disadvantage using the Index of Relative Socio-Economic Disadvantage (IRSD) with age-standardised death rates and linked these data to the Melbourne metropolitan rail network.
Large cities in the UK and US have large populations that enable the development of life expectancy data for small areas. In Australian cities we don’t have the population numbers to reliably create these same life expectancy statistics at very small neighbourhood areas.
We have chosen age-standardised death rates as the best statistical approximation to life expectancy to create our map for Melbourne. The map investigates the relationship between area-level deprivation (IRSD), death rates (taking into account age differences for areas) and nearest train station as an approximation for location.
The map shows that areas with greater disadvantage (shown in darker grey) tend to have higher death rates. This is most easily seen in the western and northern areas of Melbourne, but can also be seen along the Dandenong-Pakenham train line. In comparison, the majority of areas across the eastern suburbs have both low death rates and low levels of area-based disadvantage.
Mapping other cities
With the support of publicly available ABS data, such maps can be reproduced for cities across Australia. These will no doubt produce more interesting and thought-provoking results, which should stimulate future debate about area-based health inequities across the country.
Health-based inequities occur for many reasons. They are exacerbated, however, by a lack of access to job opportunities and services – such as public transport and mental and physical health care – which determine health outcomes.
These services are harder to access in outer suburb growth areas such as those in the western, northern and southern areas of Melbourne. Without these services people’s livelihoods and health suffer as shown in the Melbourne version of the “Living on the Line” map.
Such maps are a powerful reminder that good health planning should be integrated across government portfolios. Health budgets also need to be spent on broader public health promotion and planning that extends well beyond hospital funding and basic health service provision.
Authors: Melanie Daver, Senior Research Fellow, McCaughey VicHealth Community Wellbeing Unit, and Director, Community Indicators Victoria, University of Melbourne; Lucy Gun, Research Fellow, Community Indicators Victoria, McCaughey VicHealth Community Wellbeing Unit, University of Melbourne; Rebecca Robert, Academic Specialist (GIS Analyst), Community Indicators Victoria, McCaughey VicHealth Community Wellbeing Unit, University of Melbourne


