How Does Bank Capital Affect the Supply of Mortgages?

The Bank for International Settlements just released a working paper – “How Does Bank Capital Affect the Supply of Mortgages? Evidence from a Randomized Experiment.” Given the intense focus on banks lifting capital ratios, this is an important question.  They conclude that higher bank capital is associated with a higher likelihood of application acceptance and lower offered interest rates, whilst banks with lower capital reject applications by riskier borrowers and offer lower rates to safer ones. In other words, changing capital ratios directly and indirectly impact lending policy, but not necessarily in a linear or expect way.

The recent financial crisis refocused the attention on how the health of banks affects financial stability and macroeconomic growth. In particular, the academic and policy debates currently center on the effects of bank capital on lending and risk-taking. Indeed, both macroprudential and the microprudential regulatory reforms propose to raise bank capital ratios and strengthen bank capital buffers, with the aim of preventing “excessive” lending growth and increasing the system’s resilience to adverse shocks.

Yet, there is only a limited degree of consensus on the effect of higher bank capital on lending. On the one hand, higher bank capital increases both the risk-bearing capacity of banks and incentives to screen and monitor borrowers, in this way boosting lending. On the other hand, as debt creates the right incentives for bankers to collect payments from borrowers, lower debt and higher capital may reduce banks’ lending and liquidity creation.

In this paper we study the effect of bank capital on banks’ propensity to grant mortgages and on their pricing. We also explore how bank capital affects the selection of borrowers and the characteristics of offered mortgages, deriving implications for risk-taking. Finally, to detect possible non-linearities, we provide nonparametric estimates.

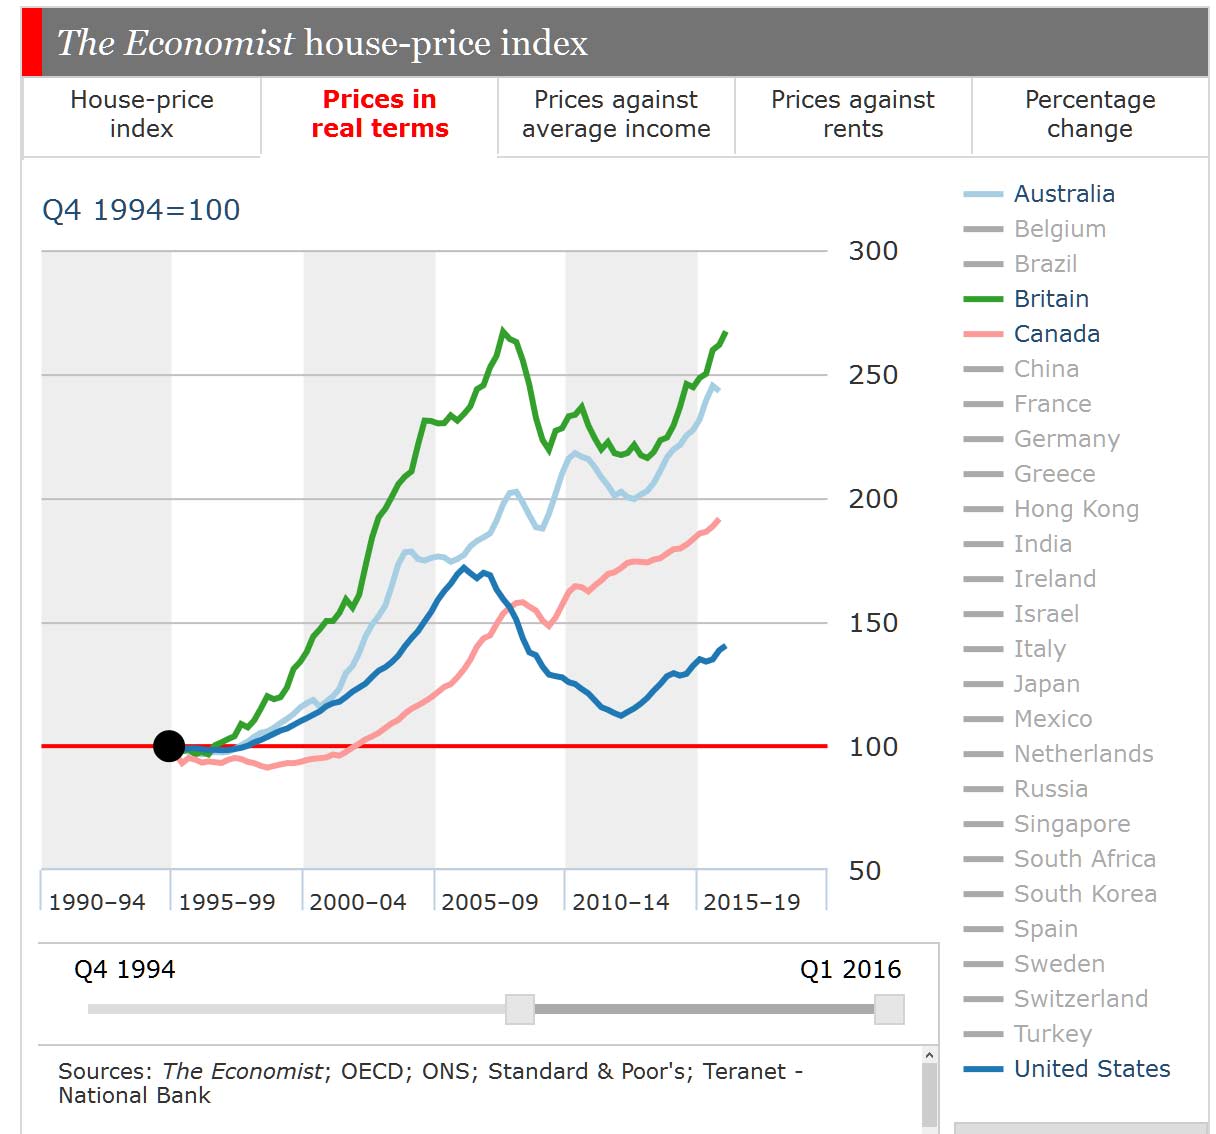
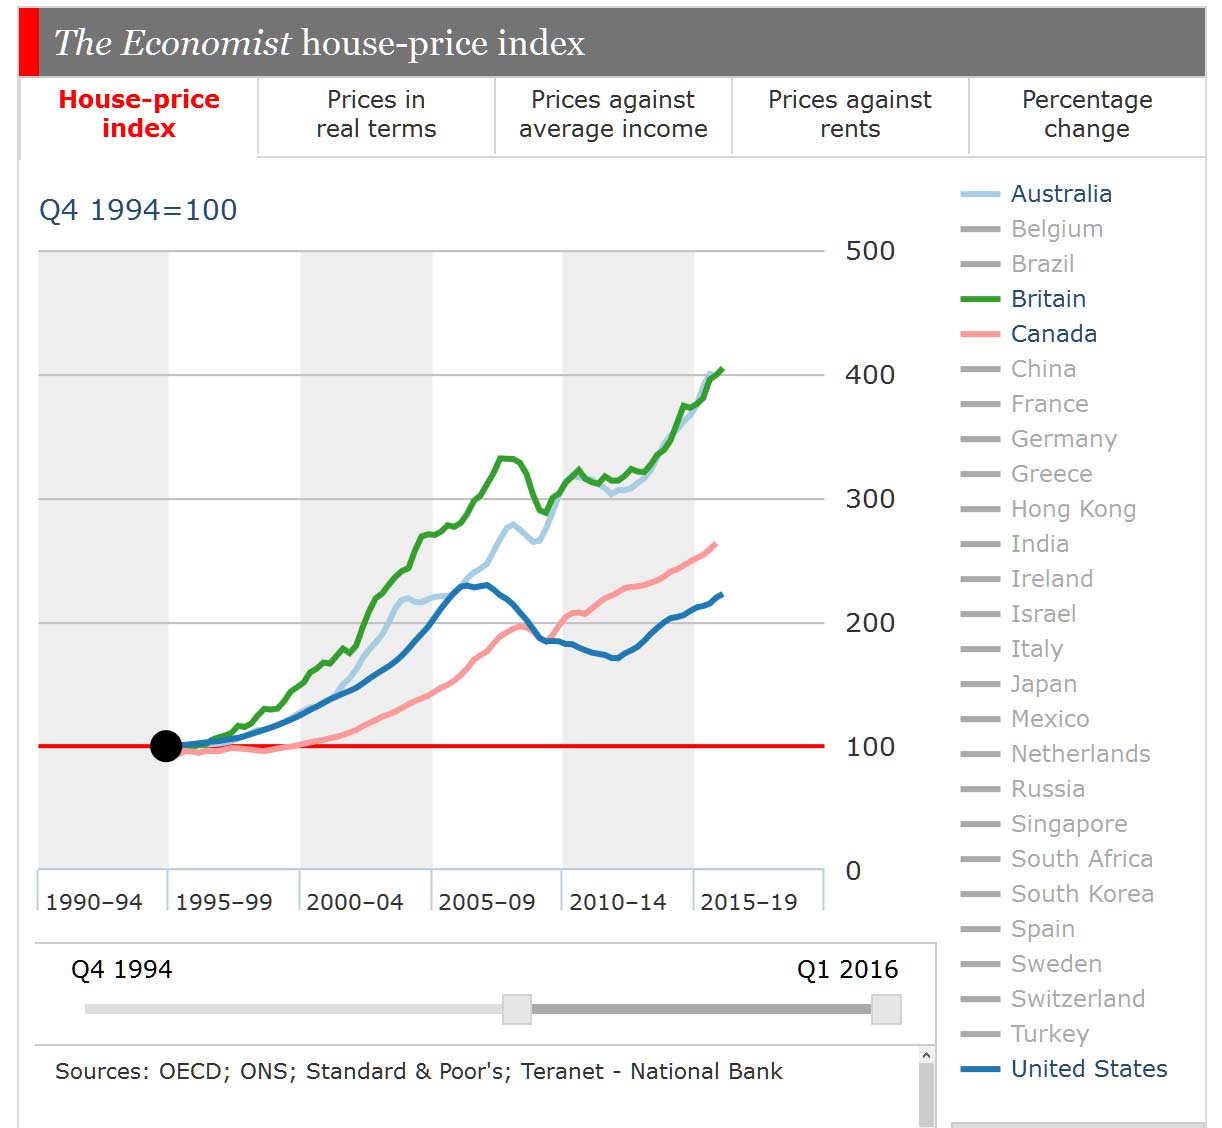
We focus on mortgages, whose relevance for both macroeconomics and financial stability has been unquestionable following the 2007-2008 financial crisis. In the first half of the 2000s, a strong increase in mortgage originations fueled a housing boom in several countries (US, UK, Spain, Ireland). That boom in turn led to a high accumulation of risks, which subsequently materialized causing the failure of several banks and a large drop in house prices. Understanding how bank capital affects mortgage originations and the way banks select the risk profiles of borrowers is thus critical to evaluate developments in the mortgage market and the potential accumulation of both idiosyncratic and systemic risks.

We use a new and unique dataset of mortgage applications and contract offers obtained through a randomized experiment. In particular, we post randomized mortgage applications to the major online mortgage broker in Italy (MutuiOn-line) in two dates (October 16, 2014, and January 12, 2015). Upon submitting any application, the online broker requires prospective borrowers to list both their demographic characteristics (income, age, job type) and the main features of the contract requested (amount, duration, rate type). By varying those characteristics, we create profiles of several “typical” borrowers who are submitting distinct applications for first home mortgages. Crucially, through the online broker all participating banks (which include the 10 largest banks in the country accounting for over 70% of the market for mortgage originations) receive the same mortgage applications, defined by the same borrower and loan characteristics. Hence, our estimates are not biased by the endogenous selection of borrowers into contracts or banks and, furthermore, there are no missing data due to discouraged potential borrowers not submitting applications. We then merge those data with the banks’ characteristics from the supervisory reports and, in our empirical analysis, we include several bank-level controls to reduce concerns about omitted variable bias; we exploit the time dimension of our data and we include bank fixed effects to control for unobserved determinants of bank capital in the cross-section; finally, in some specifications, we include bank*time fixed effects, to fully account for all bank specific, time-varying characteristics.

On the one hand, we find that banks with higher capital ratios are more likely to accept mortgage applications and to offer lower APRs. On the other hand, banks with lower capital ratios accept less risky borrowers. However, we cannot rule out that less well-capitalized banks take more risk on other assets (business loans, securities).

We also provide a quantitative estimate of the effect of bank capital ratio on the supply of mortgages, using a nonparametric approach. We find that the capital ratio has a non-linear effect on the probability of acceptance, stronger at low values of the ratio, almost zero for higher values. This non-linearity is more pronounced when the borrower or the contract are riskier.

Note: BIS Working Papers are written by members of the Monetary and Economic Department of the Bank for International Settlements, and from time to time by other economists, and are published by the Bank. The papers are on subjects of topical interest and are technical in character. The views expressed in them are those of their authors and not necessarily the views of the BIS.

Mortgage Delinquency Mapped

Today we release the latest modelling of our mortgage probability of default, and a map showing the current and predicted default hot spots across Australia. The blue areas show the highest concentrations of mortgage defaults. The average is 1.2%, but our maps show those areas a little above the average (1.2%-1.7%) and the most risky (above 1.7%).  The highest risks are more than twice the national average.

PD-April-2016Mining heavy states and post codes are under the most pressure.

As part of our household surveys, we capture data on mortgage stress, and when we overlay industry employment data and loan portfolio default data, we can derive a relative risk of default score for each household segment, in each post code. This data covers mortgages only (not business credit or credit cards, which have their own modelling).

Given that income growth is static or falling, house prices and mortgage debt is high, and costs of living rising, (as highlighted in our Household Finance Confidence index) pressure on mortgage holders is likely to increase, especially if interest rates were to rise. In addition, the internal risk models the major banks use, will include a granular lens of risk of default.

So, some borrowers in the higher risk areas may find it more difficult to get a mortgage, without having to jump through some extra screening hoops, and may be required to stump up a larger deposit, or cop a higher rate.

In QLD, locations including Camooweal, Clermont, Theodore, Loganlea and Gulngai score the highest.

In NSW, locations including Quirindi, Stanhope Gardens, Duri, Greta and Brewarrina scored high.

In VIC, Berwick, Endeavour Hills, Darnum, Moonee Ponds and Pascoe Vale scored the highest.

In WA, Butler, Port Kennedy, Merriwa, Secret Harbour and Nowergup scored high.

In SA, Montacute, Marree, Macclesfield, Stirling and Uraidla scored the highest.


Australia’s Most Hated Fees Revealed

ATM fees frustrate Australians more than other banking and credit card fees and travel booking fees according to new research from ING DIRECT. Almost all Australians will take some action to avoid paying ATM fees – half will walk 10 minutes out of their way to get to a free ATM and 42 per cent will buy something they don’t need to get cash out.Almost half of the people who hate travel fees feel they are being ripped off. Top 5 accepted fees include Wi-Fi, restaurant service charges and mobile data roaming

Almost three quarters of people (72 per cent) who hate ATM fees say that it is because they believe it’s a service that should be free.

Psychologist Amanda Gordon explained, every day millions of people are feeling the frustration of paying fees and charges they think are unfair.

“Fee frustration may not seem significant, but these feelings of resentment can impact our ability to maintain a positive outlook in other aspects of our lives. Financial issues are regularly raised as a cause of stress for Australians, particularly among young women. Interestingly, ING DIRECT’s research shows that millennials and women were more likely to feel frustrated or angry about paying fees.”

“Bad spending habits are hard to break. Just like other habits, we need to become aware of what we are doing, stop following that same well-worn pathway without thinking, and actually notice where our money is going, rather than just complaining that it is disappearing. The best way for Australians to get ahead is to consciously and regularly focus on their finances by practicing money mindfulness,” said Gordon.

Apathy costing Australians dearly when it comes to paying unnecessary fees

John Arnott from ING DIRECT said people should not have to pay fees to access their own money.

“When you think about the total cost Australians pay in fees and charges it can have quite an impact on the family budget, which is already strained for many people.”

“Australians waste $500 million on ATM charges each year so it’s no surprise that’s the fee that tops the list. Our research shows almost all Australians will take some action to avoid ATM fees, but still too many people are paying. If you make two or three withdrawals a week, you are talking more than $300 a year, which is $300 too much,” he said.

Top ten fees Aussies find hardest to bear

  1. ATM fees
  2. Bank monthly account fees
  3. Booking fees for events and tickets
  4. Credit card surcharge fees
  5. Credit card annual fee
  6. Travel fees (e.g. airline booking fees)
  7. Fee for receiving a paper statement by mail
  8. Charge to use public toilets
  9. Road toll charges
  10. Late payment fees

Top five fees Aussies accept

  1. Wi-Fi fees
  2. Restaurant service charges
  3. Mobile data roaming charges
  4. Parking meter fees
  5. Currency conversion fees

Dwelling approvals continue to decline in February

The number of dwellings approved fell 0.5 per cent in February 2016, in trend terms, and has fallen for 11 months, according to data released by the Australian Bureau of Statistics (ABS) today.

Dwelling approvals decreased in February in the Northern Territory (9.7 per cent), South Australia (2.1 per cent), Western Australia (1.4 per cent), Queensland (0.8 per cent), Tasmania (0.5 per cent) and New South Wales (0.1 per cent) but increased in the Australian Capital Territory (4.9 per cent) in trend terms. Dwelling approvals were flat in Victoria, in trend terms.

Approvals for private sector houses fell 0.9 per cent in February, while approvals for private sector dwellings excluding houses fell 0.4 per cent, in trend terms.

Private sector house approvals fell in Western Australia (2.2 per cent), New South Wales (1.5 per cent), South Australia (1.3 per cent), Queensland (0.5 per cent) and Victoria (0.3 per cent).

The seasonally adjusted estimate for dwelling approvals rose 3.1 per cent in February following a 6.6 per cent fall in January. The rise in February was driven by dwellings excluding houses (up 7.7 per cent), offset by a 1.0 per cent fall in approvals for houses.

The largest contributors to the overall rise in seasonally adjusted dwelling approvals by state were Tasmania (24.0 per cent), New South Wales (14.4 per cent) and Queensland (9.5 per cent).

The value of total building approved fell 0.8 per cent in February, in trend terms, and has fallen for seven months. The value of residential building fell 0.7 per cent while non-residential building fell 1.2 per cent.

Mortgage delinquencies to rise in 2016

From Australian Broker.

A slowdown in house price growth coupled with sluggish economic conditions will result in an increase in mortgage delinquencies in Australia during 2016, according to one global credit rating firm.

According to Moody’s Investor Services, the proportion of Australian residential mortgages more than 30 days in arrears was 1.20% in November 2015, compared with 1.19% in November 2014, and that is expected to rise again in the coming year.

“We expect the Australia-wide delinquency rate for mortgages showing more than 30 days in arrears to increase in 2016, but remain at a low level,” Moody’s assistant vice president and analyst Alana Chen said.

“We also expect that Australia’s GDP growth will likely be towards the upper end of our 1.5% to 2.5% forecast range for 2016, but this will be below the long-term average of 3.5%. We believe this economic backdrop will prompt a slight increase in the Australia-wide mortgage delinquency rate in 2016,” Chen said.

While Moody’s Investor Services is predicting a nation-wide increase in mortgage delinquencies in 2016, it won’t be spread evenly across Australia.

The ratings firm believes there will be further bad news for resource states; Western Australia, the Northern Territory, and to a lesser extent, Queensland, with the bulk of the increase in delinquencies to be found in those markets.

In Western Australia, the rate of mortgage holders more than 30 days in arrears rose by a significant 0.48% over the year to November 2015 to 1.71%, the highest mark in the country.

Though delinquencies will are predicted to rise in those states, performance in New South Wales will help to keep the nation-wide rate of delinquencies relatively low.

“With delinquencies in NSW remaining steady and those in other states set to continue to edge higher, we expect that the Australia-wide delinquency rate will increase slightly over 2016 but remain low,” Chen said.

Moody’s Investor Services claims a slowdown in house price growth in NSW will be balanced out by the “positive effect of healthy economic and labour market conditions.”

Are Deposit Interest Rates On The Up?

It looks like Banks will need to compete harder for deposit balances in the light of new regulation, and adverse international funding costs. This is in stark contrast to the past couple of years when savers took a bath.

The data from the RBA (to end February) shows that key benchmark rates for some deposits lifted. This trend has continued, with some attractor rates at 3.5%, and some standard deposit rates on the rise.

RBA-Deposits-Feb-2016In contrast, we also see lending rates to SME’s moving up, and some mortgage rates to borrowers are also higher – though selected refinance discounting is also available to some.

RBA-Loan-Benchmarks-Feb-2016In recent times the costs of international funding, which is the other main source of bank funds, has lifted (and is also more volatile) thanks to the higher perceived international risks and possible future interest rates. For example the CDS spreads are higher now.

CDS-Margin-April-2016This matters, because Australian banks have a higher proportion of their loan books funded by these wholesale sources, as data from Moody’s shows.  Whilst there has been a fall in the mix, compared with 2008, Australian banks are still reliant on these international capital flows. Thus any international volatility feeds though into local bank balance sheets.

Moodys-Apr-2016---Bank-1The other point to note is that Australian banks have a higher proportion of short-term funding, compared with global peers. Moody’s has provided data on this recently.

Moodys-April-2106---Bank-2 APRA’s consultation, announced last week, on Net Stable Funding Ratio will make it relatively more attractive for banks in Australia to fund their books from deposits rather than from wholesale capital markets. As a result, we expect to see competition for deposits, and potentially higher interest rates on offer. This trend will gain more momentum as the implementation date for NSFR approaches in 2018.

The implication of this may be we see a further fall in exposures to overseas funding, and thus less pricing volatility; but it may also mean that interest rates to some borrowers – especially SME’s who are less able to respond, and some mortgage holder segments will rise.

The question will be whether the re-balancing of all these forces will be managed so as to maintain net bank profitability, or whether the squeeze will flow to their bottom line. Nevertheless, Savers may for a change, get some good news – provided that is they shop around. We note from our surveys that more than half of households with savings on deposit do not know their current rate of return, and inertia is a powerful force stopping many maximising their savings returns.

Then of course, there is the question of whether the RBA cuts the cash rate benchmark as we progress through the year.


Further Confirmation Australian Home Prices Least Affordable

The latest Economist data on global house prices released today, shows Australia sitting at the top the pack (excluding Hong Kong) in terms of average prices to average income. This chart shows Australia, Britain, Canada and USA trends from 1990. This is consistent with findings from Demographia.

Economist-HP1On a different measure, prices against rent, Australia is behind Canada, but above the other two.  Rental growth in Australia has not kept up with house prices.

Economist-HP-5

Prices in real terms show Australia price growth just behind Britain, but well ahead of Canada and USA.

Economist-HP3

Finally using the price index, movements in Australia are close to those in Britain, but well ahead of Canada and USA.

Economist-HP-2

Explanation from the Economist

Their interactive chart uses five different measures
• House-price index: rebased to 100 at a selected date
• Prices in real terms: rebased to 100 for the selected date and deflated by consumer prices
• Prices against average income: compares house prices against average disposable income per person, where 100 is equal to the long-run average of the relationship
• Prices against rents: compares house prices against housing rents, where 100 is equal to the long-run average of the relationship
• Percentage change: the percentage change in real house prices between two selected dates

Notes
The data presented are quarterly, often aggregated from monthly indices. When comparing data across countries, the interactive chart will only display the range of dates available for all the countries selected

Apple at 40: can walled garden thrive in the new digital era?

From The Conversation.

The stand-out feature of Apple’s 40-year rise to become the world’s largest public company has been its ability to convert ideas into designs that have redefined consumer products. It is astonishing that the iPhone only arrived in 2007 but, in less than a decade, has helped redefine communication, computers, music and the internet.

But just as the PC age transitioned into the mobile computing market, we are now seeing the start of a shift to the era of the “Internet of Things”. What is the future for Apple as the focus shifts from computers in our pockets to computers in all the objects around us, from our buildings to our transport to our kitchen appliances?

The greatest sales growth in Apple’s history came in 2015 but we’re already seeing the mobile and tablet markets mature. Apple’s latest releases – the iPhone SE and the iPad Pro – are really just variations on existing products. When a company runs out of new countries to expand into and its new products are just there to fuel replacement sales, it can expect to see less and less growth.

Internet of Things

The technology market is a fickle and fluid world, new devices and solutions can often come from new directions that disrupt products and services. While the PC and mobile market has become a connected cloud of content and apps – such as Apple’s iCloud online storage system and Siri voice recognition program – this design is now shifting into “connected objects and things”.

“Internet of Things” has become a broad term covering “what is coming next”. This is a move to connect 50 billion objects or more into a new era where individual cars help plan a city’s traffic management and fridges automatically order more food for you when you run out.

But how do I make a phone call? Shutterstock

We’ve already seen the beginning of this movement with the advent of wearable devices that track your fitness levels and allow you to make contactless payments. But Apple’s entry to this market, the Apple Watch, has made far less of an impact than previous new launches. Its first connected device for the home, Apple TV, has had similarly limited success.

Apple has also introduced developer software to allow other manufacturers to connect their home appliances (HomeKit), medical and fitness devices (HealthKit) and even cars (CarPlay) to the company’s technology. But these things remain underdeveloped – early market rather than mainstream.

Can Apple replicate its success?

Apple’s success has been based on redefining existing products, but when it comes to new technology markets it has little to no track record. While Apple Watch and Apple TV are potentially leading products in their markets, they still aren’t radical compositions of technologies that can produce the kind of popularity and “wow factor” we saw with the iPhone and iPad. Even with the firm’s reported move into driverless cars or other possible difficult, high-risk “moon shot” projects, the question remains whether it can create a critical mass for the new category of connected computing.

The other issue for Apple is that the Internet of Things involves connecting many different types of products, appliances and content services from not just one company but potentially hundreds, including rival system manufacturers.says above they are doing this – are the above apps, which he then says below?. This differs significantly from Apple’s previous “walled garden” approach that has involved working with app developers, but making core technology incompatible with that of competitors – right down to its charging cables. The question is whether the firm’s home, health and car development platforms will also remain closed to rival companies, preventing customers from picking and choosing from different systems.

With its past record, the expectation of Apple is sky high. But even the enormous funds of US$160 billion that the company is sitting on – more than the GDP of many small countries – is no substitute for creativity and genius. I believe Apple will be able to position itself at the vanguard as the market moves past this latest inflexion point. But having your own walled garden may not be enough when consumers and enterprise want a multiple-connected experience.

Author: Mark Skilton, Professor of Practice, University of Warwick

Annual rate of housing market capital gains slips to slowest pace in 31 months – CoreLogic RP Data

The rate of value growth continued to moderate as housing market conditions cool in Sydney and Melbourne, whilst the remaining capital cities recorded a range of outcomes from small value increases to moderate declines according to CoreLogic RP Data.

During March, capital city dwelling values recorded a subtle lift, rising by 0.2 per cent to take capital city home values 1.6 per cent higher over the first quarter of 2016. The quarterly increase in home values was broad based across the nation’s capitals, with Perth (-0.9%) and Brisbane (-0.1%) the only two cities to record negative movements in dwelling values over the past three months.

CoreLogic RP Data Head of Research Tim Lawless said, “The March quarter rise in capital city dwelling values is in stark contrast to the first quarter of 2015, when values increased by 3.0 per cent, which is almost double the current pace of quarterly growth. However, compared with the final quarter of 2015, when capital city dwelling values were down 1.4 per cent, the housing market has shown a modest rebound in growth which is well below the strong capital gains recorded over the first half of 2015.”

“The annual pace of home value appreciation across Australia’s capital cities highlights the slowing growth trend,” he said.

Following the March results, the annual rate of capital growth across the capital cities has now reached its lowest point in 31 months, with dwelling values rising by 6.4 per cent over the past twelve months across the combined capitals. Furthermore, no Australian capital city has recorded an annual growth rate in the double digits over the past twelve months. Melbourne remains the capital city with the strongest annual growth, with dwelling values increasing by 9.8 per cent over the past twelve months.

Mr Lawless said, “The housing market has been losing momentum since July last year, when capital city dwelling values were increasing at the annual rate of 11.1%.”

Index results as at March 31, 2016

2016-04-01--Indices

Perth and Darwin are the only two capital cities where home values are trending lower on an annual basis, down 2.0 per cent and 1.8 per cent respectively. However, Mr Lawless noted the moderation in the rate of capital growth in the Sydney market has been the most pronounced, with annual dwelling value growth more than halving to 7.4 per cent per annum, from a high of 18.4 per cent per annum in July last year.

The Melbourne market has been much more resilient, with annual growth in dwelling values slipping below the 10 per cent mark for the first time since May last year, to reach 9.8 per cent at the end of March 2016.

The current growth cycle has been running since values troughed in May 2012. Through to March 2016, capital city dwelling values have risen by a cumulative 32.2 per cent. Over the cycle to date, Sydney home values have seen the most significant level of appreciation, with dwelling values 49.2 per cent higher since values started rising, followed by Melbourne at 35.7 per cent cumulative growth.

Darwin and Perth moved through their respective cyclical market peaks more than a year ago, with Darwin home values peaking in May 2014, whilst Perth’s housing market peaked in December 2014. Since then, both Darwin and Perth home values have fallen by a total of 4.6 per cent.

UK Regulator Looks At Reverse Mortgages

The UK Prudential Regulation Authority (PRA) has released a discussion paper (DP) on equity release mortgage (ERM), or reverse mortgages. Given the complex nature of these products, their valuation, risk assessment and capital treatment are under review, and the regulator is seeking industry input. They are especially focussing on what “fair value” for these mortgages might be.

The PRA has observed that firms writing ERMs typically restrict the initial valuation to the amount lent (which is a transaction price observed in a market), for example by including a spread of appropriate size when discounting ERM cashflows, and updating the valuation (including the spread, where appropriate) to allow for new information affecting the valuation as it emerges.

In Australia, reverse mortgages have not really taken flight, with the latest APRA data showing about $2.7 bn of reverse mortgages outstanding (compared with $1.35 trillion all home loans), comprising around 29,000 loans outstanding, and an average balance of just $96,000.  There has been little growth in recent years.

That said, the recent run up in house prices here, and the aging population may suggest a growing demand. Therefore it is worth looking at the issues the UK regulators are wrestling with. This is a complex product area requiring careful regulation.

ERMs are a type of lifetime mortgage. This DP is directly relevant to lifetime mortgage products with the following features: they are restricted to older customers, they do not have a fixed term, they generally have a no negative equity guarantee, and there is no obligation to make regular interest payments on the capital. For simplicity, this sub-set of equity release products is referred to as ‘ERMs’ for the purpose of this paper, but the PRA is aware that other definitions of ERMs are used in the industry.

ERMs allow capital to be released from residential properties without requiring the property to be sold. ERMs are loans secured by way of a mortgage on a residential property, repayable on ‘exit’ (death; or move to a care home; or voluntary repayment, either for an individual borrower or a couple) rather than at a fixed maturity date. In the United Kingdom (UK), loans are advanced as a lump sum, or through flexible drawdown facilities. In general it is possible to ‘port’ ERMs from one property to another if the borrowers wish to move house, subject to certain restrictions, which may include a requirement to make a partial repayment of the outstanding loan.

Loan interest is generally at a fixed rate, but can be variable or vary subject to a cap. In general, interest accrues to the loan balance without regular payments being made, so that the final repayment is larger than the amount lent, often significantly so. Sometimes interest payments can be made and these may be lower than the interest that would otherwise accrue. Such interest payments can be terminated by the borrower, in which case interest starts to accrue again. The accruing nature of the interest leads to the name ‘reverse mortgage’ being used in some territories.

In the UK, there is often a guarantee that on certain forms of repayment any excess of the accrued loan amount above the (sale) value of the property will be written off or waived by the lender, subject to certain conditions. This is known as a ‘no negative equity guarantee’ (NNEG). For an ERM product to meet the Product Standards within the Statement of Principles of the Equity Release Council, it must incorporate a NNEG. This means the NNEG has become a standard feature of the UK ERM market.

ERMs receivables are held – either directly or indirectly – by a range of different financial institutions, including life insurers, banks, building societies and other lenders. ERMs require long-term funding that is sufficiently flexible to adapt to the timing and amount of repayments, both of which may vary from expectations. In particular, annuity writers have liabilities with long-term and relatively predictable cashflows. So (taking into account their other capital and liquidity resources) some of these firms consider that cashflows from a suitable portfolio of ERMs offer a sufficiently good match for some of their annuity liabilities and provide a good risk/return trade-off, given the long duration and reasonably predictable cashflows of a sufficiently large portfolio of ERMs.

In the UK, ERMs are not actively traded in a secondary market, although the PRA is aware of some bilateral transactions between firms. Some ERM holdings have been externally securitised in the past, but the PRA is not aware of widespread use of securitisation as a means of funding ERMs in the UK.

It is common for lenders to require properties to be insured and maintained as part of the loan terms and conditions. There is a risk that maintenance may reduce over time as borrowers become older and potentially cash-poor, and the financial interest of the borrowers in the property reduces. This ‘dilapidation risk’ may lead to the performance (as an asset) of residential properties connected with an ERM being inferior to the performance of similar properties that do not have such a connection. Conversely, if the loan advanced is used to improve the property, then performance may be superior to similar but unimproved properties.

The responsibility for the sale of the property upon exit may, in some circumstances, rest with the lender who, for risk management purposes, may be willing to reduce the sale price in order to reflect a ‘quick sale discount’ on a vacant property, subject to obtaining the best price for the owner within reasonable timescales. If so, this will further increase the value of the NNEG. There may be a relationship between the desirability of offering a quick sale discount and market-wide movements in house prices.

Part of the loan interest rate can be considered as a charge for the cost of the NNEG. Higher interest rates lead to higher NNEG costs, other things being equal, and so (depending on how the ERM is priced) there is potentially a limit to how much the cost of the NNEG can be recouped through an increase in interest rates. Lenders therefore control their overall exposure to NNEGs primarily by restricting loan-to-value (LTV) ratios. LTVs are typically age-dependent, with LTVs lower at younger ages and increasing with age, reflecting changes in expected exit rates. Some lenders offer to advance larger amounts to borrowers in poor health, based on medical underwriting.

From the provider’s point of view, the future value of the ERM at any given exit date depends on whether or not the NNEG bites. If the NNEG does not bite, the loan plus accrued interest is repaid to the provider in full; if it does bite, the repayment is restricted to the value of the property. Thus the present value of the ERM is equal to the sum of: (i) the present value of the loan plus accrued interest at exit date, if and only if the NNEG does not bite; and (ii) the present value of receiving the property, if and only if the NNEG does bite. The computation of this involves, amongst other things, estimating the present value of receiving the property at exit, and – in order to estimate the probability of the NNEG biting – the volatility of the underlying property price.

Thus when the probability of the NNEG biting is low (typically at shorter durations) the value of the ERM approximates to the present value of receiving the loan plus accrued interest at exit. When it is high (typically at longer durations), the value of the ERM approximates to the present value of receiving the property at exit. Note that the present value of the ERM can never exceed the present value of receiving the property at exit, where a NNEG is in place.

The proportion of loans assumed to exit at any given date depends on the probabilities of death, entry into long-term care and early repayment. The mortality experience of the remaining borrowers can be expected to change as borrowers go into long-term care.

The challenges of valuing ERMs include estimating exit probabilities, estimating drawdown rates (for products permitting future drawdowns) and setting property-related assumptions. In addition, appropriate discount rates need to be set for the cashflows being valued. Some of these challenges are explored in the chapters that follow.

The former Individual Capital Adequacy Standards (ICAS) regime permitted insurers to derive a liquidity premium directly from ERMs. Where appropriate, this led to a reduction in the value of liabilities backed by ERMs. The current Solvency II regime has a similar concept in the form of the matching adjustment, but with more prescriptive rules than ICAS. In particular, ERMs do not have fixed cashflows and so do not meet the Solvency II eligibility criteria for inclusion in an MA portfolio. This has led some firms to restructure their ERM portfolios to meet these eligibility criteria

On 6 November 2015 the PRA published a Solvency II Directors’ update1 stating that during 2016 it would undertake an industry-wide review of ERM valuations and capital treatment. The Directors’ update referred to mark-to-model assets more generally but specifically mentioned ERMs, where there are particular challenges and a range of perspectives on the degree of risk embedded in ERMs and how they should be valued. This DP is the first part of this review.

ERM industry stakeholders (including without limitation life insurers, banks, building societies, other lenders, trade bodies, brokers, credit rating agencies, consultants, actuaries and auditors) are invited to participate in the DP by providing answers to the questions. The PRA also invites responses from academics, particularly those with experience of property valuation and the valuation of contingent claims in incomplete markets.