
Today we release the latest modelling of our mortgage probability of default, and a map showing the current and predicted default hot spots across Australia. The blue areas show the highest concentrations of mortgage defaults. The average is 1.2%, but our maps show those areas a little above the average (1.2%-1.7%) and the most risky (above 1.7%). The highest risks are more than twice the national average.
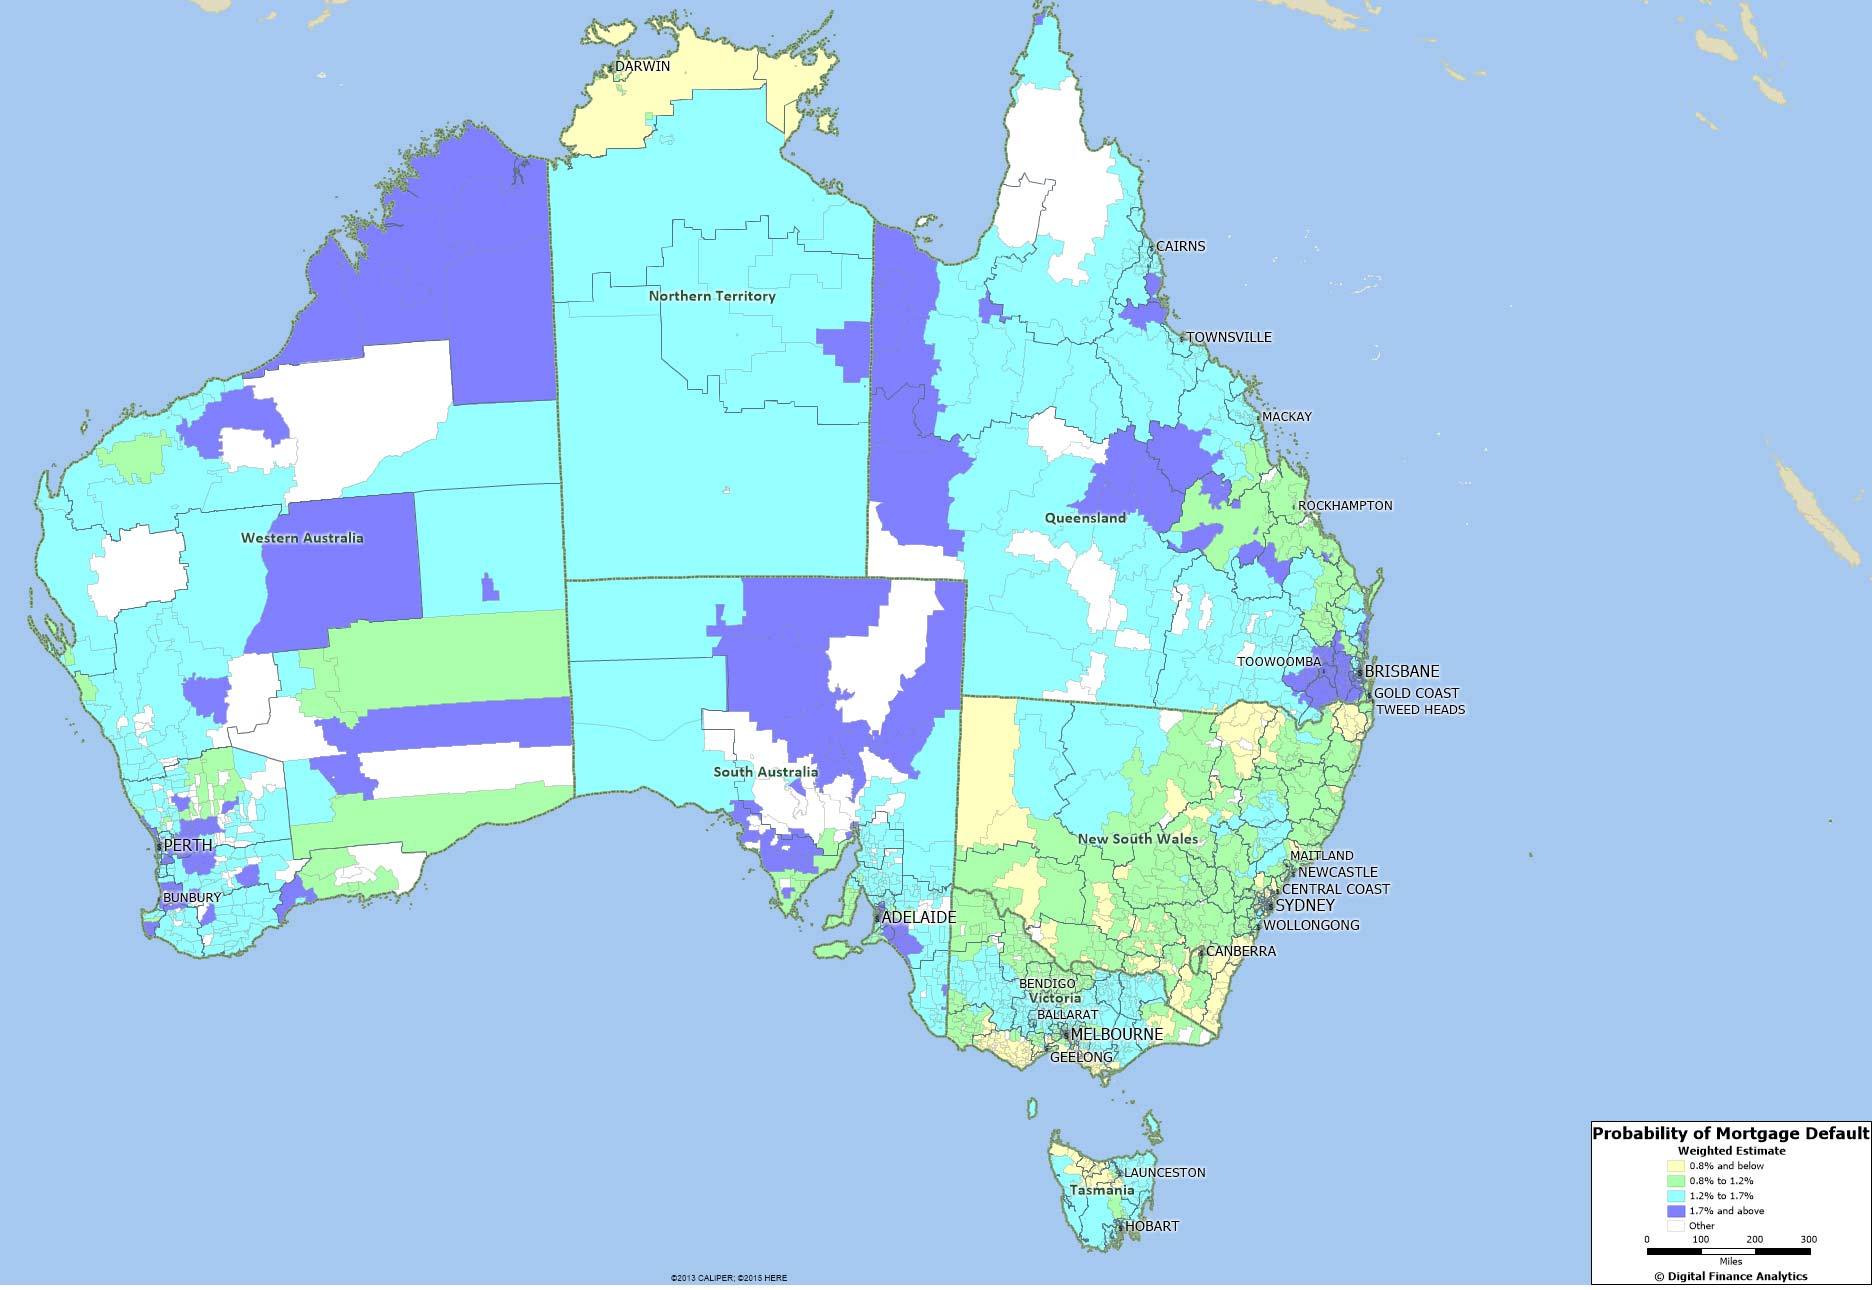 Mining heavy states and post codes are under the most pressure.
As part of our household surveys, we capture data on mortgage stress, and when we overlay industry employment data and loan portfolio default data, we can derive a relative risk of default score for each household segment, in each post code. This data covers mortgages only (not business credit or credit cards, which have their own modelling).
Given that income growth is static or falling, house prices and mortgage debt is high, and costs of living rising, (as highlighted in our Household Finance Confidence index) pressure on mortgage holders is likely to increase, especially if interest rates were to rise. In addition, the internal risk models the major banks use, will include a granular lens of risk of default.
So, some borrowers in the higher risk areas may find it more difficult to get a mortgage, without having to jump through some extra screening hoops, and may be required to stump up a larger deposit, or cop a higher rate.
In QLD, locations including Camooweal, Clermont, Theodore, Loganlea and Gulngai score the highest.
In NSW, locations including Quirindi, Stanhope Gardens, Duri, Greta and Brewarrina scored high.
In VIC, Berwick, Endeavour Hills, Darnum, Moonee Ponds and Pascoe Vale scored the highest.
In WA, Butler, Port Kennedy, Merriwa, Secret Harbour and Nowergup scored high.
In SA, Montacute, Marree, Macclesfield, Stirling and Uraidla scored the highest.