How Are Employment and Inflation Connected?

Inflation dynamics and its interaction with unemployment seem to be behaving differently since the Global Financial Crisis (GFC). Are external factors such as low interest rates and credit availability and other external variables influencing the current apparent dislocation of the assumed relationship between inflation and unemployment? Or is the underlying relationship, as described in the so called Phillips curve at fault? Perhaps we cannot assume, all else being equal, that in the current economic climate, lower levels of unemployment will necessarily translate to higher inflation.

The Phillips curve is a single-equation empirical model, named after A. W. Phillips, describing a historical inverse relationship between rates of unemployment and corresponding rates of inflation that result within an economy. Stated simply, decreased unemployment, (i.e., increased levels of employment) in an economy will correlate with higher rates of inflation. (Wikipedia).

Is the Phillips curve broken? This question is a central topic in macroeconomics as modified forms of the Phillips Curve that take inflationary expectations into account remain influential. Modern Phillips curve models include both a short-run Phillips Curve and a long-run Phillips Curve. This is because in the short run, there is generally an inverse relationship between inflation and the unemployment rate; as illustrated in the downward sloping short-run Phillips curve. In the long run, that relationship breaks down and the economy eventually returns to the natural rate of unemployment regardless of the inflation rate.

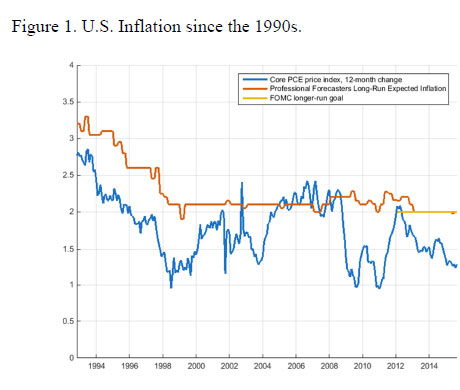
The key question is – how does unemployment affect inflation? Since the Great Financial Crisis (GFC) of 2008-2009, while inflation has declined, it has fallen less than was anticipated (an outcome referred to as the “missing disinflation”). More recently the currently low unemployment rates should have pushed the inflation rate closer to the Federal Open Market Committee’s longer-run inflation goal, but inflation has been running below the 2 percent target for an extended period.

IMF-PhilllipsSo an IMF working paper “Did the global financial crisis break the US Phillips Curve?” is worth looking at.

Clearly, if confirmed, a changing or non-linear, relation between inflation and unemployment would have significant implications for monetary policy. While a linear Phillips curve warrants a symmetric monetary policy response with respect to business cycle conditions, a nonlinear Phillips curve, where inflation increases rapidly when unemployment rate declines below the natural rate may imply preemptive measures are needed to counter inflation when the economy is closer to potential. If, on the other hand, the Phillips curve is very flat monetary policy should react more strongly to unemployment movements, relative to inflation.

In this paper, we shed light on the forces and, possibly changing, dynamics between inflation and activity since the GFC. In other words, did the GFC break the U.S. Phillips curve? Moreover, we investigate three hypotheses which have recently been put forward as factors which could explain why inflation is currently low:

(a) Financial frictions, and shocks could imply slow recoveries and persistently low inflation.

(b) Globalization has increased the role of international factors and decreased the role of domestic factors in the inflation process in industrial economies. These hypotheses originated from the concerns of some monetary policymakers of an increasing disconnect between monetary policy on one side and domestic inflation and long-term interest rates on the other.

(c) the last hypothesis pertains to the inability of stabilization policy – due to the effective lower bound on policy rates – to lower real interest rates enough to bring the economy back to long-run sustainable levels and to achieve long-run inflation goals. Policymakers have emphasized how persistently low inflation poses substantial risks if monetary policy is constrained by the zero bound, and could derail the economic recovery .

Using extensive modelling they examine a series of “(possibly) nonlinear vector stochastic dynamic process(es)”. They took account of the Federal Reserve lowered the federal funds rate to the zero lower bound (ZLB) where it remained until December 2015. “Once the ZLB, or a negative Shadow Funds rate, is obtained, the perception, if applicable, that the funds rate reacts differently e.g. can fall no further, would be captured by switching in coefficients plus switching in shock variances such that adverse shocks to the Shadow funds rate are obtained. Second, there could be a change in the relationship between the federal funds rate and the term spread either directly because of the negative Shadow rates, or because of nonstandard monetary policy measures that stand in for conventional monetary policy. This is the main reason why the term spread is included as a variable in the model”. They conclude:

We use large BVAR’s, DFM’s and MS-VAR models to investigate the possibility of non-linearity in the recent post-crisis dynamic of inflation and unemployment rate in U.S. data. In other words, did the GFC break the U.S. Phillips curve? We also study what conditioning information set is informative for inflation and unemployment. We find that changes in shocks is a more salient feature of the data than changes in coefficients and a model with time-varying coefficients in the policy rule fits better than all other models that allow a change in coefficients. The model with coefficient switching in the simple instrument rule with variance switching in all equations attain the highest marginal data density.

Moreover, conditional forecasts which condition on external variables and financial risk variables seems to come closest to describing the dynamics of inflation while credit variables are the most important conditioning variables of the post-GFC unemployment rate.

We show that financial and external variables have the highest forecasting power for inflation and unemployment, post-GFC.

In other words, the Phillips curve is not broken, but is swamped by external factors, which makes it a less useful and authoritative tool. We cannot assume, all else being equal, that in the current economic climate, lower levels of unemployment will necessarily translate to higher inflation. We think the missing and critical factor is low, or falling real wages.

Note: IMF Working Papers describe research in progress by the author(s) and are published to elicit comments and to encourage debate. The views expressed in IMF Working Papers are those of the author(s) and do not necessarily represent the views of the IMF, its Executive Board, or IMF management.

In a world of low rates, what else can the RBA and central banks do?

From The Conversation.

The world still needs the central banks to bail us out of trouble but the impact of monetary policy is complicated in a world of zero or near-zero interest-rate policy (ZIRP) and negative interest-rate policy (NIRP).

Money presents us with three alternatives: we can spend it, save it or invest it. Most households and governments do the first; financial institutions take the third option; and virtually no one saves. Except Asia, obviously.

In 2008, spending and investment froze during the global financial crisis (GFC). This forced central banks and governments to ultimately adopt unorthodox and largely unprecedented strategies. Two tools were available to governments: fiscal stimulus and looser monetary policy. Most governments adopted a mix of both.

However, there are political and financial limits to fiscal policy, particularly as governments grew increasingly overextended during the GFC. Consequently, since 2008, monetary policy has largely displaced fiscal policy as means of generating economic stimulus. Except in Sydney, at the Reserve Bank of Australia (RBA).

ZIRP it. ZIRP it good

The Bank of Japan (BoJ) was the first to adopt ZIRP, as it sought to deal with the aftershocks of the Heisei recession of the early 1990s. This was referred to as Japan’s “lost decade”, as it experienced stagnant growth, a condition still bedevilling the country today, despite the best efforts of Abenomics.

As the global financial crisis emerged throughout 2007–08, the US Federal Reserve, the European Central Bank (ECB) and the Bank of England sank hundreds of billions of their respective currencies into their foundering financial sectors. The People’s Bank of China injected massive liquidity into Chinese markets.

In Australia, the RBA slashed interest rates, with deep successive cuts in 2008–09. Looser monetary policy was matched by the Rudd government’s significant fiscal expansion to prevent the collapse of consumer spending.

The reason behind this fiscal pump priming, combined with the dramatic monetary measures, was clear: in late 2008, credit markets froze. Admittedly, there is much debate about how long and to what extent this occurred. However, the fear of contagion was so palpable that the interbank lending market experienced systemic dysfunction and, at the very least, credit rationing took place.

The problem for central banks is that they have relatively few monetary tools available to them. The traditional lever to prevent overheating is to exert monetary discipline by raising interest rates, thus increasing the cost of credit.

Conversely, under the crisis conditions of the GFC, the central banks slashed interest rates to encourage consumption. However, the US Federal Reserve, the Bank of Japan, the Bank of England and the European Central Bank reached their lower limits faster than the RBA, which never adopted ZIRP.

But that may be about to change. The RBA’s cash rate is at a historic low of 1.75%, and the bank may cut further as the Australian economy plateaus, combined with the uncertainty wrought by Brexit.

The new normal

Make no mistake: ZIRP and even perhaps NIRP are the new normal. Just ask Janet Yellen. When the Federal Reserve chairman increased US interest rates by 0.25% in December 2015, the markets reacted savagely. It was the first Federal Reserve (Fed) rate rise since 2006.

US Federal Reserve chair Janet Yellen. JIM LO SCALZO/AAP

Fourteen months earlier, Yellen had tapered off the US’s third quantitative easing program (QE3), ending it on schedule in October 2014. Between 2008 and 2014, the Fed had purchased over US$4.5 trillion in government bonds and mortgage-backed securities in three rounds of QE, plus a fourth program, Operation Twist (2011–12).

The outcome was an avalanche of “free” money. Why “free”? Because, in the long run, the real cost of the capital for commercial banks was zero, or less than zero.

The Fed was effectively printing money (although it’s more complex than that). The effects were clear: the US central bank was reflating the American economy, and by extension the global economy, by injecting massive amounts of liquidity into the system in an attempt to ameliorate the worst effects of the 2008–09 financial crisis.

US Fed moves this year

No one on the markets was surprised by the central bank’s December 2015 rate rise. The clear objective was to return some semblance of normality to global interest rates.

The problem is it didn’t work. The tapering-off of QE in late 2014 meant that the last sugar hits of stimulus were wearing off in 2015.

The Yellen rate rise, plus the clear intention of the Fed to incrementally drive rates higher, spooked the markets. In May this year, undeterred by gloomy US jobs figures, Yellen indicated that she would seek to raise US interest rates “gradually” and “over time” as US growth continued to improve. Her concern was that adherence to ZIRP would ultimately bite in the form of inflation.

Not anymore. Brexit has seen to that. It was one of the factors behind the Fed committee’s decision to keep interest rates on hold in mid-June.

ZIRP – or something approximating it – is becoming the “new normal” because cheap money has become structural; the global financial system is now structured around the persistence of low-cost credit. NIRP is thus the logical continuum of this downward interest rate spiral.

Negative interest zates

Until recently, most macroeconomic textbooks argued that zero was rock bottom for interest rates. The GFC shifted the goalposts.

This is where NIRP enters the picture: negative interest rates. How do they work? Typically, commercial banks will park their money in their accounts with the central bank, or in private markets, such as the London Interbank Offered Rate (LIBOR). Thus, their money never sleeps and earns interest 24/7, even when bank doors are shut.

But NIRP is different. Negative rates mean depositors pay for the privilege of a bank to hold their money. Which means depositors are better off holding the cash than placing the funds on deposit. Japan has experienced the results of a NIRP first-hand.

Bank of Japan (BOJ) Governor Haruhiko Kuroda decided to adopt negative interest rates. FRANCK ROBICHON/AAP

There is a method in this madness: the G7 central banks want commercial banks to lend, not to accumulate piles of cash. Consequently, the policy effect of both ZIRP and NIRP is to stimulate business and consumer lending in order to drive real economic activity. With piles of cash looking for investment placements, the shadow banking system of financial intermediaries may also drive enterprise investment.

However, ZIRP and NIRP are blunt instruments; the perverse outcomes of the stimulus programs of the US Fed, the Bank of Japan and the European Central Bank were artificially inflated stockmarkets and various sector bubbles (such as real estate, classic cars).

The combination of ZIRP and QE may have also created a “liquidity trap”. This means that central banks’ QE injections caused only a sugar rush and did not inflate prices, as one would normally expect from a significant expansion of the monetary base.

Instead, many developed countries have experienced multiple recessions and a prolonged period of deflation. In April this year, the Australian economy experienced deflation for the first time since the GFC, which compelled the RBA to make its most recent 0.25% cut in May 2016.

Yellen knows the global economy cannot retain ZIRP indefinitely. But, ironically, all of the central banks are caught in their own liquidity trap: unable to relinquish ZIRP for fear of market catastrophe; unwilling to abandon QE entirely as “the new normal” demands fresh injections of virtually cost-free credit.

A lack of interest

The Australian economy has done quite well by having interest rates above the OECD average, particularly since the GFC. This has encouraged significant foreign investment flows into Australia as global investors seek somewhere – anywhere – to park their cash as other safe-haven government bonds, such as the US, Japan and Germany, are in ZIRP or NIRP territory. It also doesn’t hurt that Australia’s major banks and government bonds are blue-chip-rated. And Australian sovereign bonds have excellent yields too.

If ZIRP is the new normal, that matters to the Reserve Bank of Australia. It also matters to all Australian home buyers, businesses, banks, pensioners, investors, students and credit card holders. Everyone, in other words.

ZIRP has created hordes of winners: mortgage interest rates are at historic lows. Property buyers who borrowed when rates were relatively high (at, say, 6-7%) are now paying less than 4%. Credit card rates are still astronomically high (20–21% or more), but balance transfer rates are zero. New credit issues in terms of consumer debt represented by unsecured loans (which is what a credit card is) have a real capital cost of zero. This is virtually unprecedented.

But ZIRP or near-ZIRP produces many losers as well. There is no incentive to save because rates are so low. Hoarding cash makes no sense.

Global surplus capacity reinforces deflation as both goods and commoditised services are cheap. Wages are terminal. Pension funds’ margins are smaller, thus expanding future liabilities and reducing the value of current superannuation yields.

In a world of ZIRP, is it any wonder that all of this cheap or (effectively) free cash has been stuffed into the global stock exchange and real estate markets, creating not only a double bubble, but double trouble?

The best things in life are free

QE is like heroin: the first hit is always free. The commercial banks got their first hit in 2008 and the prospect of going cold turkey sends them into paroxysms of fear.

The problem is that the dealers – the central banks – have started using their own product and are just as hopelessly addicted to both ZIRP and QE. To rudely cut off supply would destroy their own markets.

The RBA is not immune to the elixir of ZIRP. No central bank wants to assume responsibility for a recessionary economy; the RBA took enough heat for its monetary policy mismanagement of 1989-90, which induced the 1990s recession.

Unlike the Fed, the RBA is not about to fire up the printing presses and engage in rounds of QE, if it runs out of tools and is compelled to adopt ZIRP. The RBA is too conservative to engage in such policy in any case.

But this conservatism has a direct impact upon federal government fiscal policy, irrespective of whether the LNP or the ALP is in power. From Rudd to Turnbull, Treasury has been forced to increase its borrowing time and time again, blowing out the forward fiscal projections year after year.

No government has delivered a surplus because it is no longer possible. The RBA is partly responsible for this because, rather than expanding its balance sheet via QE, it has forced Canberra to accumulate government debt of more than $AU400 billion, which the overburdened Australian taxpayer will pay for.

Like most drug deals, this will not end well.

Author: Remy Davison, Jean Monnet Chair in Politics and Economics, Monash University

Can slower financial traders find a haven in a world of high-speed algorithms?

From The Conversation.

It sounds like a scene from “Jurassic World”: fast, agile predators pursue their slower, less nimble prey, as the latter flee for safer pastures. Yet this ecology framework turns out to be an apt analogy for today’s financial markets, in which ultra-fast traders vie for profits against less speedy counterparts.

In fact, the algorithmic traders (known variously as algos, bots and AIs) proliferating in financial markets may well be viewed as an invasive species that has upended the prevailing order in their shared habitat. A 2013 article asserts that the financial world has become a “techno-social” system in which human traders are shunted aside, unable to keep up with the bots interacting in a “new machine ecology beyond human response time.”

And in a rapidly evolving world of autonomous traders, past experience may not provide reliable assurance of safety and predictability. The hallmark of a flash crash is lack of an apparent triggering event, generating uncertainty that can further destabilize markets.

Is the regime of algorithmic traders making the financial world more dangerous? How can market innovation and regulations shape this habitat for better or worse? For policy makers, the pressing question is: how can we operate our markets so that they remain stable and efficient amid fundamental technological changes?

In my research on artificial intelligence and strategic reasoning, I’ve been exploring answers to these questions by modeling how the world of trading works.

‘Latency’ arms race

What makes this world especially different and unpredictable is the unprecedented speed at which trading bots can respond to information.

A slight edge translates into profit because of the way exchanges match orders. When new information arrives, the first trader to react is able to make money off of slower rivals, while any relative delay or latency of even a fraction of a millisecond can mean no trade and no profit.

This leads inevitably to a latency arms race in which the designers of trading algorithms adopt any available method to shave milliseconds or even microseconds – one millionth of a second – from response time.

Most exchanges and trading forums have catered to the high-frequency traders, providing premium access options and interface features that preserve or enhance the advantage of speed.

An exception is the alternative trading system IEX, featured in Michael Lewis’s Flash Boys and backed by institutional investors, which introduced a 350 microsecond delay on order submission to shield against high-speed bots. On June 17, the Securities and Exchange Commission (SEC) approved IEX’s application to operate as a public exchange – rather than only as a private trading platform – against strong opposition by high-frequency traders and competing exchanges.

Ending the latency race

But there is another way to neutralize small speed advantages: change the way markets time the matching of buy and sell orders.

Today’s typical market works by matching orders to buy and sell a stock or other asset on a continuous basis. For example, when a trader submits a request to buy a share of Apple at a specific price, the exchange matches it immediately if there is an offer from someone else to sell at the same price or less. This immediacy is what allows a trader able to react more swiftly to new information (say news about the latest iPhone) to profit off of slower rivals.

In a frequent call market, on the other hand, orders to buy and sell are matched at fixed intervals (such as once every second). So our Apple buyer with knowledge of the release of a big improvement in the iPhone wouldn’t be able to get a jump on rivals because her order wouldn’t transact immediately, giving time for others to “catch up.”

By ensuring that speed no longer categorically prevails, the incentive for shaving milliseconds and microseconds is virtually eliminated. Orders within the interval compete instead based on price, leading to a more efficient overall set of trades.

Regulators have taken notice. New York Attorney General Eric Schneiderman has publicly endorsed the frequent call market – also known as a frequent batch auction – to even the playing field. And SEC Chair Mary Jo White said it could help counter problems with algorithmic trading.

At present, however, no stock exchange operates as a full-fledged frequent call market. One major hurdle to adoption is perception: the view that faster is always better.

Another problem that some have raised is that it would only be viable if all exchanges adopted the method simultaneously because otherwise traders would always pick the venue offering the most immediacy.

But is this true? Given the option of trading on either a continuous market or a frequent call market, which one would investors prefer? Or, in the terms of our ecology metaphor, would they flock to the new habitat operating in discrete time intervals or stay in the traditional continuous domains?

Predator and prey

To answer this question, in research conducted at the University of Michigan, Elaine Wah and I developed a model with two markets, one continuous and the other a frequent call market.

In this model, traders are either fast (think high-frequency) or slow (such as institutional and retail investors). Each trader can choose to buy and sell in one of the two markets and so will prefer to pick the one that offers the highest expected trading gains, taking all others’ behavior as given.

If all the agents are in one market, no individual can benefit by going to the other, as there is nobody to trade with. We therefore focused on market attraction, measured in terms of the prevalence of conditions that would make one trader want to switch.

Our results show that fast traders prefer the continuous market, where they can make the most money, but only when the slow traders are also there. In other words, the predators need their prey in order to be profitable, which means they have a pronounced tendency to follow the slow traders to whichever market they go.

Slow traders, on the other hand, can evade their pursuers by fleeing to the market with fewer fast traders. If the fast traders are prevalent in both markets, then slower ones tend to seek refuge in the frequent call market, which offers some protection from faster traders with better information, as well as generally higher trading gains.

A recent paper by Zhuoshu Li and Sanmay Das from Washington University also found, under quite different assumptions, a tendency for the frequent call market to attract traders away from continuous markets.

Lessons for exchanges

What both of these studies suggest is that we may not need a top-down mandate to transform financial markets from continuous to discrete-time trading. Simply making the option available in one or two exchanges may capture the population, as the haven for slow traders can attract both the prey and the predators in pursuit.

High-frequency traders have been relentless in their pursuit of lower latencies and faster access to market-moving information, but ultimately it’s the continuous markets that deserve blame for allowing this predator-prey dynamic to take shape.

Neutralizing the advantage of tiny speed improvements with something like a frequent call market offers a clear-cut solution. The introduction of such a market will provide an attractive haven for investors, and widespread adoption could eventually send the latency arms race the way of the dinosaurs.

Author: Michael Wellman, Professor of Computer Science & Engineering, University of Michigan

UK Banking Risks Escalate

The Bank of England has released the latest edition of The Systemic Risk Survey, which is conducted by the Bank of England on a biannual basis, to quantify and track market participants’ views of risks to, and their confidence in, the stability of the UK financial system. This report presents the results of the 2016 H1 survey which was conducted between 11 April and 29 April.

UK-RisksProbability of a high-impact event and confidence in the UK financial system

  • The perceived probability of a high-impact event in the UK financial system over the short term has risen considerably. The
    perceived probability of such an event over the medium term has increased slightly. 56% (+46 percentage points since the
    2015 H2 survey) of respondents now consider the probability of a high-impact event as high or very high over the next year;
    37% (+6 percentage points) between one and three years ahead.
  • Confidence in the stability of the UK financial system has fallen since the 2015 H2 survey. Respondents are less likely to judge themselves as very or completely confident (14%, -15 percentage points since the 2015 H2 survey) and more likely as not very confident (10%, +4 percentage points).

Sources of risk to the UK financial system

  • The two risks to the UK financial system most cited by respondents were those of an economic downturn (mentioned by 73% of respondents, +1 percentage point since 2015 H2) and UK political risk, which increased significantly (+46 percentage points to 72%). UK political risk was also identified as the number one source of risk (+61 percentage points to 65%). In the history of this survey only one other risk has ever been identified by a larger proportion of respondents as their number one source of risk.
  • Around half of respondents citing an economic downturn specifically referenced a slowdown in global economic growth,
    rather than a UK-specific slowdown.
  • Almost all respondents that mentioned UK political risk explicitly referenced the possibility of the United Kingdom leaving the European Union.
  • The perceived risk of a cyber attack increased, albeit marginally, for the third consecutive survey to a new survey high
    (+2 percentage points to 48%). The proportion of respondents citing risk of financial market disruption/dislocation fell
    slightly (-7 percentage points to 37%). Perceived risks surrounding the low interest rate environment rose (+13 percentage
    points to 34%). Respondents perceived geopolitical risks to have fallen noticeably (-14 percentage points to 32%). The risks
    around regulation and taxes have increased (+9 percentage points to 28%), driven by concerns over regulation rather than
    taxation.

Risks most challenging to manage as a firm

  • UK political risk was most commonly cited as the risk most challenging to manage. The percentage of respondents
    mentioning this risk increased by 39 percentage points (14% to 53%). Only sovereign risk, in the period between 2011 and
    2013, has ever been perceived as a more challenging risk to manage since this survey began in July 2008.

RBA cash rate unchanged at 1.75 per cent

Today’s RBA note highlights that inflation will remain low for some time. This is a problem lodged firmly in many economies with ever lower cash rates. Assuming the RBA  sticks to their 2-3% target, this leaves the door open for another rate cut. However, we should also question whether even lower rates would have a net positive impact on growth, as savers would take another hit, businesses would be no more willing to borrow, whilst home lending would be stimulated further and it could also stoke investor housing as capital growth is still in play. All up, not a nice cocktail, when incomes are static or falling in real terms. Perhaps some latitude on the inflation target would make more sense.

At its meeting today, the Board decided to leave the cash rate unchanged at 1.75 per cent.

The global economy is continuing to grow, at a lower than average pace. Several advanced economies have recorded improved conditions over the past year, but conditions have become more difficult for a number of emerging market economies. China’s growth rate has moderated further, though recent actions by Chinese policymakers are supporting the near-term outlook.

Commodity prices are above recent lows, but this follows very substantial declines over the past couple of years. Australia’s terms of trade remain much lower than they had been in recent years.

Financial markets have been volatile recently as investors have re-priced assets after the UK referendum. But most markets have continued to function effectively. Funding costs for high-quality borrowers remain low and, globally, monetary policy remains remarkably accommodative. Any effects of the referendum outcome on global economic activity remain to be seen and, outside the effects on the UK economy itself, may be hard to discern.

In Australia, recent data suggest overall growth is continuing, despite a very large decline in business investment. Other areas of domestic demand, as well as exports, have been expanding at a pace at or above trend. Labour market indicators have been more mixed of late, but are consistent with a modest pace of expansion in employment in the near term.

Inflation has been quite low. Given very subdued growth in labour costs and very low cost pressures elsewhere in the world, this is expected to remain the case for some time.

Low interest rates have been supporting domestic demand and the lower exchange rate since 2013 is helping the traded sector. Financial institutions are in a position to lend and credit growth has been moderate. These factors are all assisting the economy to make the necessary economic adjustments, though an appreciating exchange rate could complicate this.

Indications are that the effects of supervisory measures have strengthened lending standards in the housing market. Separately, a number of lenders are also taking a more cautious attitude to lending in certain segments. Dwelling prices have risen again in many parts of the country over recent months. But considerable supply of apartments is scheduled to come on stream over the next couple of years, particularly in the eastern capital cities.

Taking account of the available information, the Board judged that holding monetary policy steady would be prudent at this meeting. Over the period ahead, further information should allow the Board to refine its assessment of the outlook for growth and inflation and to make any adjustment to the stance of policy that may be appropriate.

Retail Turnover Rose 0.2% in May

Australian retail turnover rose 0.2 per cent in May 2016, seasonally adjusted, according to the latest Australian Bureau of Statistics (ABS) Retail Trade figures.

This follows a rise of 0.1 per cent in April 2016.

In seasonally adjusted terms, there were rises in food retailing (0.7 per cent), other retailing (1.4 per cent) and cafes, restaurants and takeaway food services (0.3 per cent). Department stores (0.0 per cent) was relatively unchanged. There were falls in household goods retailing (-1.1 per cent) and clothing, footwear and personal accessory retailing (-1.2 per cent) in May 2016.

In seasonally adjusted terms there were rises in New South Wales (0.7 per cent), Victoria (0.6 per cent) and South Australia (0.3 per cent). Tasmania (0.0 per cent) was relatively unchanged. There were falls in Western Australia (-0.7 per cent), Queensland (-0.4 per cent), the Northern Territory (-0.6 per cent) and the Australian Capital Territory (-0.3 per cent) in May 2016.

The trend estimate for Australian retail turnover rose 0.2 per cent in May 2016 following a 0.2 per cent rise in April 2016. Compared to May 2015, the trend estimate rose 3.3 per cent.

May-2016-Trend-RetailOnline retail turnover contributed 3.2 per cent to total retail turnover in original terms.

South Australian digital property market now live

From IT Wire.

Online property exchange PEXA says the introduction of legislation allowing online property conveyancing in South Australia makes buying and selling property in the state easier, with conveyancers, solicitors, banks, credit unions and mutuals now able to digitally exchange property.

The SA state government e-conveyancing legislation took effect on Monday after 150 years of “pen and paper” conveyancing processes.

PEXA chief executive Marcus Price says e-conveyancing will bring South Australian consumers fast, safe and efficient transactions.

“People buying and selling homes will increasingly become aware that there’s a better way to exchange property that diminishes delays and other pain points associated with manual settlements.

“I congratulate and thank Brenton Pike for driving this innovation and reform as SA registrar-general and, nationally, in his role as chairman of the Australian Registrars’ National Electronic Conveyancing Council.

“Going digital puts an end to costly cheques and piles of documents. Crucially, conveyancers and solicitors acting on behalf of buyers and sellers can say goodbye to sitting on hold in bank call centre queues and travelling to Grenfell Street to attend settlement.

“Like the ASX did for the exchange of shares, PEXA removes manual processes and paperwork when exchanging property. Land registries, financial institutions and practitioners all transact together, online via a secure platform with funds settling through the Reserve Bank of Australia.”

Price cites a Core Logic RP Data report valuing South Australia’s property industry at $228 billion, and says the industry now has an inclusive, collaboration tool that brings the conveyancing and legal profession unprecedented connectivity.

“Importantly, 80 financial institutions have signed up to PEXA. A growing number are now actively transacting. In addition, an increasing number of practitioners are inviting their peers to join the network. More than 2500 have signed up in the PEXA-ready states. This will increase with SA coming on board.”

What a hung parliament could mean for super

From The Conversation.

The Australian superannuation system is already complex to navigate without the added uncertainty of looming changes. These changes may not even eventuate if the Coalition fails to gain the support it needs in parliament.

Superannuation reform was a key feature of the 2016-17 Budget handed down the week before the election was called. The Coalition, ALP and Greens all acknowledge in their policies that the current system of tax concessions favours the wealthy, who are able to contribute more to superannuation.

However the three detailed policies take different paths to reform and the final outcome may be determined by the balance of power in the new government.

Low income earners

Firstly, all are agreed that low income earners should not pay more tax on their superannuation than on their other earnings. The Low Income Superannuation Contribution is due to be repealed with effect from 30 June 2017: the Coalition and ALP propose to allow a tax credit of 15% that will effectively cancel the tax paid by the superannuation fund on contributions by low income earners.

The Greens propose a progressive tax on contributions, with a nil rate for low income earners, and would also allow a government co-contribution of 15% for people earning less than the tax free threshold of A$18,200.

Concessional (untaxed) contributions

The concessional contribution caps for the 2016-17 year are $30,000 or $35,000 for people over 50. The Coalition has proposed reducing the cap to $25,000, effective from 1 July 2017. The ALP and the Greens has not proposed any changes to these caps. However the Greens do propose a progressive tax rate on contributions based on a discount of 15% on the marginal tax rate on the contributor’s income.

Currently superannuation contributions are taxed at 30% instead of 15% to the extent that the contributor’s income, including superannuation contributions, exceeds $300,000. Both the ALP and the Coalition will reduce that threshold to $250,000. Under the Greens progressive tax sale this threshold would be reduced to $150,000.

Non-concessional (taxed) contributions

There is a clear difference between the Coalition and ALP policies.

Non-concessional contributions allow a person to contribute after tax funds into superannuation, which pays a flat rate of 15% tax on investment earnings, instead of the marginal rate of tax that would apply if invested personally. For 2016-17 a person can invest $180,000 pa or $540,000 over three years.

The Coalition proposes a lifetime cap of $500,000, including any contributions made after 2007. Where a person has already exceeded the cap there would be no penalty, but further contributions would not be permitted.

The ALP has not made any proposals in relation to the cap, and has campaigned against including pre-budget contributions in the lifetime cap.

Tax on earnings of the superannuation fund

Currently superannuation fund earnings are taxed at 15% until it starts to pay a pension. From that time the superannuation fund pays no tax on income set aside to pay the pension. Both major parties propose to limit this exemption, but will use different mechanisms.

The Coalition Transfer Balance Cap proposal caps the value of the assets that can earn exempt income at $1.6 m. The balance over this cap can remain in a fund taxed at 15%.

The ALP will exempt income up to $75,000 pa, which represents a return of about 4.7% on $1.6 m.

Although the outcomes are comparable, ultimately the ALP proposal gives more certainty in planning future income streams, as the exempt amount is less dependent on the rate of return achieved by the superannuation trustee.

Superannuation pension streams

There have been no proposals to remove the tax exemption for pensions received by a person over 60, or to change the tax concessions on lump sum withdrawals.

However the Coalition has proposed a change to the tax concessions on transition to retirement schemes. Currently such arrangements are built on the income of the superannuation fund becoming exempt from tax: the Coalition has proposed removing this exemption in the fund which will reduce, but not eliminate, the tax benefit. The ALP has no policy in this area, but has campaigned against the proposal.

Prospects for reform

It’s highly likely that the changes to the lifetime cap will proceed, with the support of both parties. The extension of a 15% credit to the superannuation account of low income earners will also proceed; regardless of who forms government. Both of these measures are likely to be supported by the Greens and Nick Xenophon Team as well as the two major parties.

The other budget proposals must pass two hurdles. Assuming that the Coalition does gain enough seats to form government, the election campaign highlighted division among the conservatives in respect of the lifetime cap on non concessional contributions, the cap of $1.6 million in pension assets and the changes to transition to retirement pensions.

If these measures are presented to the parliament, the position of the ALP is not clear. Although the published policy says no measures other than the lifetime cap change and the cap on exempt earnings will be introduced, there have been suggestions that the ALP will consider some of the other measures.

It’s unlikely that the ALP will support measures that it regards as retrospectively changing the rules . However it would not be unusual to backdate any new limits to budget night when investors were given notice of the proposals.

Without the support of the ALP, the Coalition would have to convince the Senate crossbenchers of the merits of the reforms.

Author: Helen Hodgson, Associate Professor, Curtin Law School and Curtin Business School, Curtin University

Companies may be misleading investors by not openly assessing the true value of assets

From The Conversation.

Some companies are taking years to recognise asset impairments, and may be misleading investors who are not privy to the valuation decisions. Research shows this is because managers of many firms think or hope that assets are not overvalued.

This occurs when companies either don’t recognise, or delay the recognition of asset impairments. These asset impairments represent a downward adjustment in the value of assets, to what is called “recoverable amount”. This is determined by either the value the asset could be sold for, or its value to the business right now.

One example of this process of recognising asset impairments can be easily seen in Nine Entertainment Corporation Ltd in 2015. Through the first half of 2015 the share market value declined significantly, and by year end its book value (the value of net assets on the balance sheet) would have exceeded the firm’s market value.

This was probably occurring as investors revised their estimates of future returns in response to changes in the television industry and increasing competition from pay television, internet-based television and other online media. These factors are indicators of declining asset values, which are explicitly identified in the regulation, and this requires a test for asset impairment by the firm.

Next, Nine would have determined the recoverable amount of the assets. The company would have had to estimate future returns and, while there are extensive guidelines on how this should be done, considerable judgement is still required. The end result in this case was an asset impairment of A$792 million that resulted in Nine reporting a loss for the year.

The Australian Securities and Investment Commission (ASIC) regularly reviews the financial reports of listed firms. Where necessary, it seeks their explanations for particular accounting treatments. Risk-based criteria are used to select which firms are reviewed and in some instances this leads to material changes in their reports.

The most recent review by the corporate regulator into end-of-year financial reports for 2015 found the biggest number of the queries (11 out of 24) into accounting related to the valuation of assets.

It is unlikely this is a consequence of poor regulation. The regulation sets out clear criteria, identifying the circumstances when asset impairment should be formally considered (i.e., where indicators of impairment exist) and the basis for calculating the amount of asset impairment.

In some cases determination of asset impairments should be straight forward. For example, where firms are unprofitable and the book value exceeds the market value of equity, the indicators of impairment are readily observable to all because it can be identified using “firm level” information.

However, in other cases it is not so straightforward and determining whether impairments are necessary and calculating the recoverable amount is then much more difficult.

Asset impairments are required to be evaluated at the level of business units, or what the regulation refers to as “cash-generating units”, rather than at the firm level. Accordingly, while asset impairments may be necessary in some business units, the need for or amount of asset impairments may be obscured in firm-level information.

For example, Arrium is clearly experiencing financial problems and has made a number of asset impairments. But it is not all bad; some of its business units are profitable. When the firm level information is considered it may start to mask the very poor performance in other business units. Hence, whether the need for asset impairment is obviously necessary will depend on relative size and number of poorly performing business units.

Significant judgement will be required in these cases. This includes defining business units and attributing assets to them. Only then can future returns be estimated, and this can never be done with certainty. If there are problems with the exercising of this judgement, then maybe the assumptions on which asset impairment decisions are based should be made clear and disclosed.

Unfortunately, the people who use these financial statements, such as investors, are often kept in the dark because firms are only required to disclose the assumptions behind their judgements if an impairment is actually made. However if these disclosures were always made, it would either support the asset values reported, or alternatively confirm that asset impairments are really necessary.

In the absence of these disclosures, investors and other users of financial statements do not get important up-to-date information about future returns that would underpin share prices.

It’s time to amend the regulation and reveal the explanations for not recognising asset impairments. Whenever there are indicators that impairment is necessary, companies should be required to disclose their assumptions even if the decision is not to impair.

Doing this will highlight how asset impairments are being (or, more critically, not being) determined and assets valuation will always be more transparent.

Authors: Peter Well, Professor, Accounting Discipline Group, University of Technology Sydney; Brett Govendir, Lecturer, University of Technology Sydney;  Roman Lani, Associate Professor, Accounting, University of Technology Sydney.


International capital comparison update – APRA

APRA has issued an update on Australian Bank capital ratios. They show that banks in Australia have lifted their capital base in the past year, (e.g. CET1 from 11.7% to 13.5% on an international comparison basis  at December 2015), but APRA also underscores the fact that even higher capital ratios will be required to meet tighter rules, and to ensure that local banks do not slip down the international ranking, so as to maintain their ratios as “unquestionably strong”. This is because regulators are driving ratios higher in many countries.

Higher capital costs of course, and in in the normal course of business, will lead to more expensive loans and lower returns to shareholders. We think dividends will be under pressure in the next couple of years.

It is also worth saying that APRA is disclosing aggregate data, so variations across individual banks will be masked. This makes an interesting comparison to data from the FED where the results of capital stress tests are reported at an institution level. We think APRA should report capital ratios by individual institution, but of course they won’t.

In July 2015, APRA published the Information Paper International capital comparison study (2015 study) as an important first step in addressing the Financial System Inquiry (FSI) recommendation to set capital standards such that Australian authorised deposit-taking institution (ADI) capital ratios are ‘unquestionably strong’.

In its final report, the FSI suggested that for banks to be regarded as unquestionably strong they should have capital ratios that position them in the top quartile of internationally-active banks. APRA’s 2015 study, which adjusted for differences in measurement methodology across jurisdictions and uses a number of different measures of capital strength, found that the Australian major banks were well-capitalised, but not in the top quartile of international peers.

In particular, APRA’s 2015 study found that, based on the major banks’ capital adequacy ratios at 30 June 2014, a 70 basis point (bp) increase in capital ratios would be required to position the major banks’ Common Equity Tier 1 (CET1) ratio at the international 75th percentile (i.e. the bottom of the top quartile) and that they would likely need to increase their capital adequacy ratios by a larger amount to be comfortably positioned in the top quartile over the medium to long term.

The Basel Committee on Banking Supervision (Basel Committee) recently published an updated quantitative impact study (QIS)1 including the capital ratios of internationally active banks as of 30 June 2015. Based on the same methodology used in APRA’s 2015 study and using the latest Basel QIS, APRA has recently reviewed the major banks’ relative position to their international peers. To incorporate the capital raisings undertaken by the major banks, particularly during the second half of 2015, this update is based on their capital ratios as at December 2015.

As detailed in APRA’s 2015 study, the major banks’ weighted average comparison CET1 ratio was estimated as 11.7 per cent as at June 2014. Chart 1 shows that by December 2015, this ratio had increased by 180 bps to 13.5 per cent. This increase was the result of a range of factors, but the largest single driver was the substantial capital raisings by the major banks in the latter part of 2015. The differential between the CET1 ratio under APRA’s requirements and the international comparison ratio also increased: in broad terms, the differential as at December 2015 was 350 basis points.

On a relative basis, the strengthening of the major banks’ CET1 ratios placed them, on average, at approximately 40 bps above the June 2015 Basel QIS 75th percentile of 13.1 per cent for Group 1 banks.2 The improvement in the relative position of the major banks in Chart 1 is likely to be somewhat overstated by the timing differences between the international (June 2015) and Australian (December 2015) data. On average, the 75th percentile CET1 ratio in the Basel QIS has tended to increase by approximately 25-35 basis points each half year, suggesting the 75th percentile would be somewhat higher had December 2015 QIS data been available to APRA. Nevertheless, notwithstanding this timing difference, the relative positioning of the Australian major banks’ CET1 ratios now seems broadly in line with the benchmark suggested by the FSI.

Chart 1: CET1 ratios of Basel QIS and major banks3

Bar graph showing CET1 ratios of major banks compared to the distribution of Basel QIS banks. The 2015 study bar shows the CET1 ratios of Australia (headline) at 8.6%, Australia (Basel QIS) at 9.6% and Australia (comparison ratio) at 11.7%. The 2016 update bar shows the CET1 ratios of Australia (headline) at 10.0%, Australia (Basel QIS) at 11.1% and Australia (comparison ratio) at 13.5%.Source: APRA data

Furthermore, since the 2015 study the relative position of the major banks’ other weighted average comparison capital ratios have improved compared to the distribution of Basel QIS Group 1 banks.4 As shown in Chart 2, the major banks’:

  • comparison Tier 1 ratio of 14.8 per cent is positioned in the top quartile as compared to the third quartile as at June 2014; and
  • comparison Total capital ratio of 16 per cent is positioned at the bottom of the top quartile as compared to the median of the distribution as at June 2014.

The relative position of the major banks’ Tier 1 Leverage ratio of 5.4 per cent has also increased to a level above the median (but still below the top quartile) of the distribution of Basel QIS Group 1 banks. This compares to the banks’ position below the median in the 2015 study.

Chart 2: Capital adequacy ratios of Basel QIS (June 2015) and major banks (Dec 2015)

Bar graph showing capital ratios of major banks compared to the distribution of Basel QIS banks. Total capital of Australia (headline) is 13.8%, Australia (Basel QIS) 13.1% and Australia (comparison ratio) 16.0%.Source: APRA data

As noted above the major banks have undertaken significant capital raisings since the 2015 study, which has significantly improved their capital adequacy positon relative to international peers. That said, the trend of international peer banks strengthening their capital ratios continues. Forthcoming international policy developments will also likely mean that Australian banks need to continue to improve their capital ratios in order to at least maintain, if not improve, their relative positioning. The final design and calibration of these reforms will not be decided until around the end of 2016, and it would be prudent for Australian ADIs to continue to plan for the likelihood of strengthened capital requirements in some areas.

As detailed in the 2015 study, APRA’s analysis on the relative positioning of major bank capital ratios is intended to inform, but not determine, its approach for setting capital adequacy requirements. Recent regulatory actions (such as that applying to mortgage risk weights announced in July 2015), and the resulting improvement in the major banks’ international capital comparison, provide the necessary time for APRA to consider the full range of factors that are relevant to satisfy the FSI’s unquestionably strong recommendation. Critically this includes assessing the impact of the Basel Committee reforms as they are finalised and considering how other measures of resilience, such as liquidity, funding, asset quality, and recovery and resolution planning can assist in achieving the FSI’s objective.

APRA intends to provide further insight to these broader considerations once the Basel Committee has completed its deliberations on the international framework around the end of 2016.

1 Basel Committee, Basel III monitoring report, March 2016.

2 Basel QIS Group 1 banks comprises approximately 100 internationally active banks with Tier 1 capital of more than 3 billion Euros.

3 In Charts 1 and 2 the Australia (headline) ratios are determined under APRA’s prudential framework. The Australia (Basel QIS) ratios are derived from the Basel QIS which requires banks to report their regulatory capital base in an internationally-consistent manner. The Australia (comparison ratio) ratios are calculated using the methodology set out in the 2015 study.

4 Consistent with the 2015 study the reported Basel QIS and comparison Tier 1 and comparison Total capital adequacy ratios have not been adjusted for the impact of transitional legacy capital as this issue affects banks in most jurisdictions. The major banks’ headline Total capital ratio is higher than their Basel QIS Total capital ratio as APRA’s framework allows for phasing out of legacy capital instruments