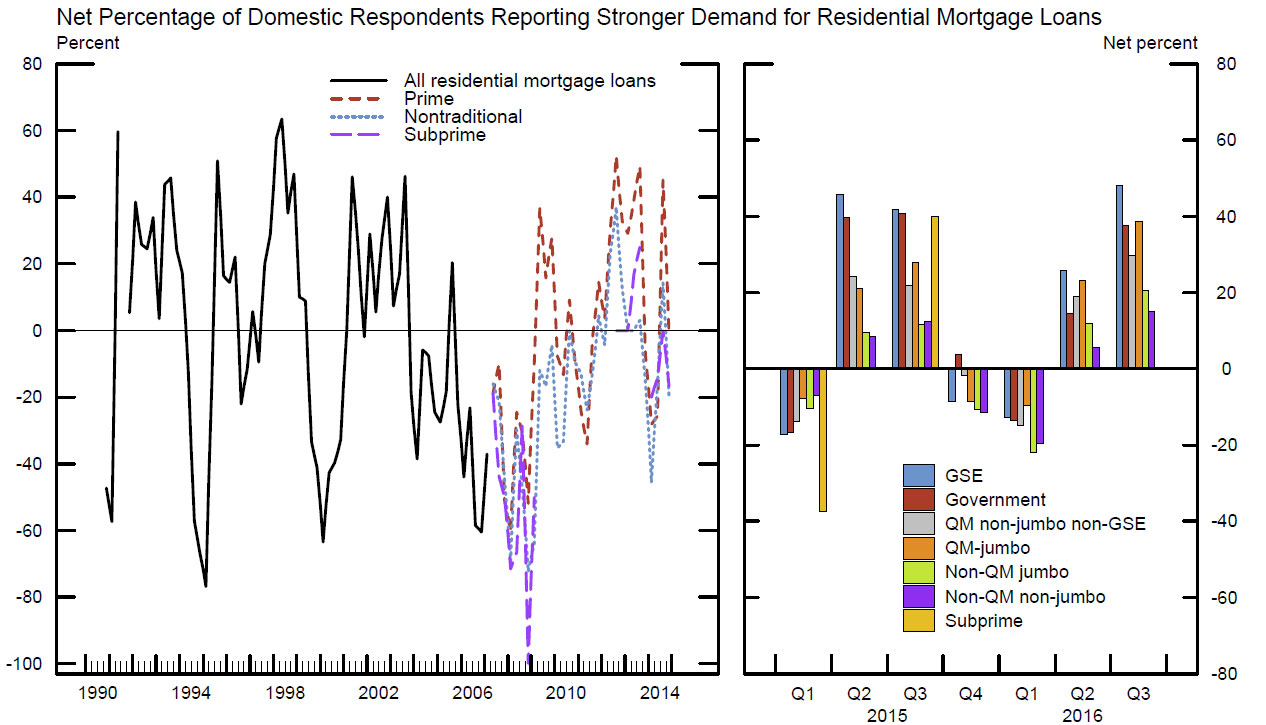
The FED says banks reported that demand for most types of Residential Real Estate loans strengthened over the second quarter.
Responses to a set of special annual questions on the approximate levels of lending standards suggested that banks’ lending standards banks continued to report in the July 2016, that on balance, domestic banks lending standards for all five categories (GSE-eligible mortgages, government-insured mortgages, jumbo mortgages, subprime mortgages, and HELOCs) remained tighter than the midpoints of the ranges observed since 2005. Of note, a major net fraction of banks reported that the current level of standards on subprime residential mortgage loans is tighter than the reference point.
The report also discusses commercial lending and consumer loans.
Regarding loans to businesses, the July survey results indicated that, on balance, banks tightened their standards on commercial and industrial (C&I) and commercial real estate (CRE) loans over the second quarter of 2016. The survey results indicated that demand for C&I loans was little
changed, while demand for CRE loans had strengthened during the second quarter on net.
Banks’ lending standards for all categories of C&I loans are currently easier than the midpoints of the ranges that have prevailed since 2005, except
for syndicated loans to below-investment-grade firms. However, banks also generally indicated that standards on all types of CRE loans are currently tighter than the midpoints of their respective ranges.
Banks indicated that changes in standards on consumer loans were mixed, while demand strengthened across all consumer loan types.
The UK Prudential Regulation Authority (PRA) proposes to set out a revised approach to IRB risk weights for residential mortgage portfolios and guidance as to how firms model probability of default (PD) and loss given default (LGD) for these exposures. The effect will be in some cases to lift the amount of capital held against mortgages.
This follows a review of the causes of variability of residential mortgage risk weights for firms with permission to use the IRB approach to calculate credit risk capital requirements which showed that first firms’ approaches to modelling PD vary. The majority of firms either use a highly point-in-time (PiT ) approach or a highly through-the-cycle (TtC) approach. In both cases a deficiency in risk capture was identified. Secondly, firms’ house price fall assumptions for UK residential mortgage LGD models vary widely.
So the PRA proposes that firms would be expected to adopt PD modelling approaches that avoid the deficiency in risk capture identified in the PiT and TtC models currently used by firms, and calibrate their models using a consistent and appropriate assumption for the level of model cyclicality.
The PRA also proposes to expect firms not to apply a house price fall assumption of less than 25% in their UK residential mortgage LGD models.
The PRA expects, in general, that these changes will result in firms having to recalibrate existing models rather than develop new ones. The PRA proposes that they will come into effect by 31 March 2019, though the PRA may on a case by case basis allow a longer period for firms to meet these expectations.
By way of background:
in December 2014, the Financial Policy Committee (FPC) raised concerns about excessive procyclicality and lack of comparability of UK banks’ residential mortgage risk weights in the 2014 UK stress test. The FPC mentioned in December 2015 that work was underway to try to investigate these issues, stating that in “the United Kingdom, the FPC and PRA Board are also considering ways of reducing the sensitivity of UK mortgage risk weights to economic conditions. The 2014 stress test demonstrated that the risk weights on some banks’ residential mortgage portfolios can increase significantly in stressed conditions”.
In implementing PiT models in the United Kingdom, firms’ residential mortgage models estimate a PD for the next year based upon the previous year’s default rate. This means that PDs are based only on very recent experience.
The PRA believes that for residential mortgages, this approach leads to capital requirements that are excessively procyclical. This is because under this approach mortgage assets, which are long term and cyclical, are calibrated based only on short term experience. This can lead to Pillar I capital requirements which are too low in an upturn and too high in a downturn, because a short term change in default rates leads directly to a change in the capital requirement for what is a long term asset. In turn this means that capital ratios may also appear too good in an upturn and too bad in a downturn.
A procyclical capital framework, where capital requirements are high in a downturn and low in an upturn, can encourage credit exuberance in a boom and deleveraging in a downturn. With major UK firms holding around £1 trillion of UK residential mortgage exposure, this is an asset class where excessive variability of capital requirements can be detrimental to financial stability.
TtC models, as implemented by UK firms, adopt a static approach whereby the PD does not vary with changes in the general economy. These models tend to use a relatively limited number of inputs, that do not change with time, to estimate average default rates for each borrower over an economic cycle. The borrower’s PD does not therefore change with economic conditions, and capital requirements vary much less than with PiT models.
In the UK firms use a form of TtC approach known as ‘variable scalar’ that use as inputs the PDs derived from relatively PiT models. Variable scalars then transform the average PiT PD for a portfolio into a static TtC PD, by using a multiplier, or scalar, that varies through time.
The PRA has found that, for residential mortgage portfolios, firms using TtC approaches, including variable scalar approaches, are unable to distinguish sufficiently between movements in default rates that result from cyclical factors (for example, factors that impact the economy in general) and those that result from non-cyclical reasons (for example, the specific performance of one borrower). These approaches only take account of a small number of risk drivers that do not change with time, and the PRA has found that this results in risks not being sufficiently captured. For example, if a particular portfolio deteriorates due to poor underwriting (rather than due to a downturn), then capital requirements calculated using variable scalar approaches may not increase as they should.
A UBS survey of bank management worldwide reveals fintech will help boost bank revenues by 3.8 per cent over the next three years.
The UBS Evidence Lab surveyed 61 banks to gauge the objectives, targets and expectations of management of fintech.
The study shows impact (both negative and positive) of fintech on revenues net of cost benefits is estimated at 3.8 per cent over the next three years.
However, the effect is more pronounced in emerging markets where boost to revenues is projected to be 5.1 per cent. In developed markets, the boost to revenues is only 1.3 per cent.
The UBS survey found that 38 per cent of bank management respondents currently have a partnership with a fintech company offering a service other than mobile banking.
This is expected to rise to 51 per cent in the next 12 months.
UBS said investment in fintech has boomed in recent years, with more than US$50 billion invested in the sector since 2010 – including US$22 billion of investments in 2015 alone, according to an Accenture report.
“As the so-called ‘fourth industrial revolution’ approaches, the pace of growth in fintech investments shows no signs of abating, with the emergence of new areas of fintech innovation, from blockchain and smart contracts to robotics, artificial intelligence and the internet of things,” UBS said.
“Against a backdrop of rapid change, banks cannot afford to stand still and do nothing.
“Players that are quick to embrace innovation and digitalisation, possibly via partnerships and collaboration, will be well-placed to maximise opportunities to improve revenues and efficiency while mitigating disruptive pressures.
“In contrast, banks that are slow to adapt and invest are at risk of losing their competitive strength, market positioning and ultimately their earnings power.”
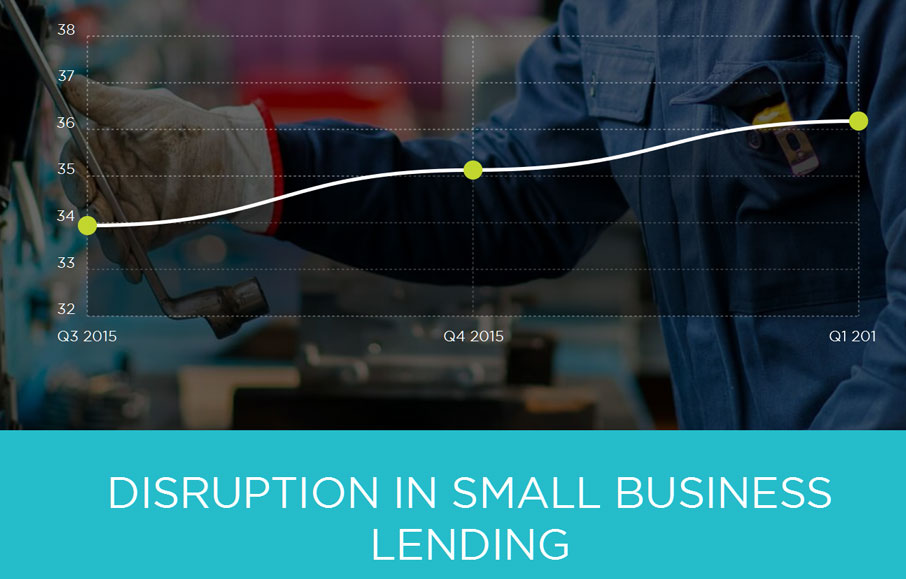
The latest edition of the Disruption Index, a joint initiate between Moula and Digital Finance Analytics, shows disruption continues apace. In the latest results, focussing on small business lending, more of the market is in play, with an overall disruption score of 36.18, up 2.99%.
SME service expectations continue to rise with the continued deployment of online applications and tools, in concert with the ongoing rise in mobile, always on smart devices. There has been a significant rise in awareness of non-traditional funding alternatives this quarter, following recent publicity and government innovation statements on fintech. As a result, a slightly higher proportion of SMEs are willing to trade their data.
Business confidence amongst borrowing SMEs has risen, as a result of the announced budget tax changes, and more favourable business conditions, especially in the east coast states. This was offset by a fall in confidence in WA and SA.
While knowledge of non-bank lenders is starting to increase, we are still seeing low usage of such credit options by small businesses (at less than 10% of all businesses in the sample); with increasing awareness, and increasing focus on the fintech sector by media commentators, we expect that non-bank lending to small businesses will become mainstream in time.
SME expectation of the time it should take to access unsecured finance has continued to collapse, with the most recent observation at 6.5 days. This is reducing quickly, and highlights the small businesses sector’s increasing awareness of alternatives in the market, coupled with the expectation that lending decisions should be fast in an era of data availability.
We are witnessing a significant trend in terms of borrower’s preparedness to provide electronic access to private information, mainly in the form of bank and accounting data feeds. This trend has been evolving quarter on quarter, with the most recent quarter showing an 11% increase in loan applicants that permission data, and a doubling since the Disruption Index began a year ago.
The key interpretation here, we believe, is that consumers and small businesses have accepted that data permissioning and data transfer are:
necessary to access new financial service offerings, and
data transfer is generally accepted as being secure.
The Disruption Index is an important tool which will highlight the changing face of financial services in Australia. There is no doubt that new business models are emerging in the context of the digital transformation of the sector, and bank customers are way ahead of where many incumbents are playing. The SME sector in particular is underserviced, and it offers significant opportunity for differentiation and innovation.
Digital Finance Analytics says that in the last three months we have seen a significant shift in attitudes amongst SMEs as they become more familiar with alternative credit options and migrate to digital channels. The attraction of online application, swift assessment and credit availability for suitable businesses highlights the disruption which is underway. There is demand for new services, and supply from new and emerging players to the SME sector.
Moula, the data-driven lending platform for small businesses has announced the appointment of former Managing Director of Xero, Chris Ridd, to its board as it positions itself for significant growth. They also released the latest edition of the Disruption Index, which measures the digital intrusion of new players into the Financial Services Sector. Ridd’s appointment comes off the back of strong growth for Moula over the past twelve months, as Australian small businesses change the way they access loans.
The Disruption Index, shows that the number of data-approved loan applicants has doubled over the past year. The Disruption Index index has been jointly developed by Moula and research and consulting firm Digital Finance Analytics (DFA). It is an initiative designed to track the waves of disruption in Australia in the small business lending sector.
Business confidence among SMEs seeking finance has risen over the past quarter as a result of taxation changes outlined in the recent Federal Budget along with more favourable business conditions, according to the latest findings from the Disruption Index,
Figures from the Disruption Index reflect the changing way in which SMEs access finance, including:
the number of data-approved loan applicants has doubled over the past year as more businesses become comfortable with providing bank and accounting data to access unsecured finance
SMEs want faster access to unsecured finance, with the average expected wait time reducing from 7.5 days to 6.5 days over the past year
The Hon. Philip Dalidakis, Minister for Small Business, Innovation and Trade welcomed the role that alternative lenders like Moula play in supporting the economy.
“Having access to capital is one of the most important requirements for a small business to get off the ground or stay operating.”
“It is wonderful to see fintech companies like Moula providing our small businesses with innovative new ways to access capital and manage their finances at the same time. This is another great local success story that cements Victoria’s growing reputation as the number one tech and startup destination in the Asia Pacific region.”
A fully Australian-owned and operated platform, Moula enables businesses to grow by providing loans that are approved via a short online application process.
“Small business owners know that to survive in business you need to meet customer expectations. We live in an age of instantaneous transactions with the increasing availability of data at our fingertips. This means that the pace of business has increased exponentially and in line with that, so too have customer expectations. The lending space is no different,” said Moula CEO and co-founder Aris Allegos.
Over the past twelve months, Moula has aligned itself with best-in-class partners including Liberty and Xero to deliver its unique lending solution to Australian SMEs.
“The Disruption Index indicates a significant shift in the way SMEs expect to access finance, and there is a huge opportunity to help SMEs grow through accessible finance that is based on a thoroughly transparent, data-driven approach. Having somebody of Chris’ calibre on the board, with his track record of building exceptional businesses, is a tremendous boon to Moula,” Allegos said.
“He has a genuine talent and a passion for this space. He ‘gets’ small businesses and the challenges they face and is a huge advocate for what Moula is trying to achieve — to help Australian SMEs grow via a simple loan application that is fast, affordable and responsible.”
As a Xero preferred financial services partner, Moula was the first online lending platform globally to use Xero’s API integration to analyse and underwrite a business loan.
“Over the course of my five years at Xero Australia, I saw a marked shift in the way SMEs use online data to streamline business process and drive growth. The findings from the Disruption Index support this with a slightly higher proportion of SMEs willing to trade their data,” Chris Ridd said.
“There is an opportunity to help support the continued success of small businesses. Lending based on the strength of accounting data is a unique point of differentiation in the market, and one that is the way of the future for finance-as-a-service.”
Ridd joins the board of five executives, including Moula co-founders Aris Allegos and Andrew Watt, Sherman Ma, Managing Director of Liberty Financial and tech entrepreneur Nathan Cher.
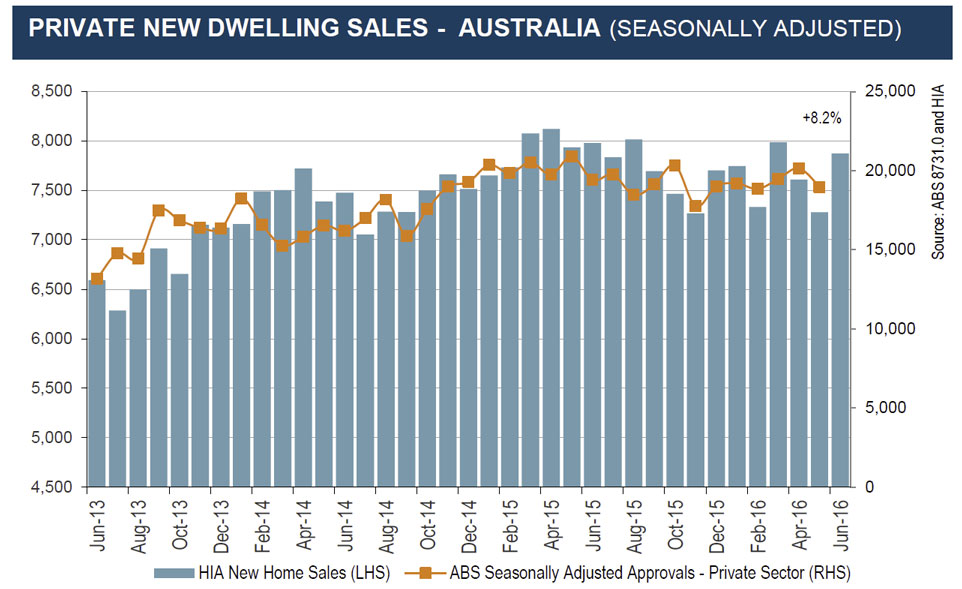
The HIA New Home Sales Report, a survey of Australia’s largest volume builders, shows that total new home sales ended 2015/16 on a higher note, said the Housing Industry Association.
“The overall trend is still one of modest decline for New Home Sales, but a bounce of 8.2 per cent in June 2016 highlights the resilience of the national new home building sector,” commented HIA Chief Economist, Dr Harley Dale.
“The overall profile of HIA New Home Sales is signalling an orderly correction to national new home construction in the short term, as are other leading housing indicators,” noted Harley Dale.
“Below the national surface, the large geographical divergences between state housing markets have been a prominent feature of the current cycle – that will continue. The New Home Sales series highlights this fact. Comparing the June quarter this year to the same period last year, detached house sales are down very sharply in South Australia (-21.4 per cent) and in Western Australia (-27.5 per cent), yet sales are up by 17.0 per cent in Victoria and by 7.1 per cent in Queensland. New South Wales rounds off the detached house coverage provided by the New Home Sales report and sales are down by 7.3 per cent on an annual basis.”
The sale of detached houses bounced back by 7.2 per cent in the month of June 2016. ‘Multi-unit’ sales continued their recent recovery, growing by 11.5 per cent after a lift of 4.9 per cent in May. In the month of June 2016 detached house sales increased in all five mainland states with the largest increases occurring in Queensland (+14.9 per cent) and WA (+9.1 per cent). Detached house sales increased by 7.5 per cent in NSW, 3.7 per cent in South Australia, and 2.2 per cent in Victoria.
According to CoreLogic, the preliminary clearance rate rose this week, up from last week’s 67.9 per cent to 73.9 per cent.
The level of activity across the capital city auction market also increased this week, with 1,585 auctions held compared to 1,329 auctions last week. Despite the week-on-week rise in activity, the number of auctions held this week continues to track lower than the corresponding week last year when 1,903 auctions were held, however, the difference in clearance rate (74.6 per cent) was minimal. In general, winter is typically a quieter season for auctions prior to the ramp up in Spring, and over the past nine weeks, the volume of auctions held across the combined capitals has been around 20 per cent lower than what was seen over the comparable time frame last year, largely driven by less properties being taken to auction across the Sydney market, despite the ongoing strength in the clearance rate.
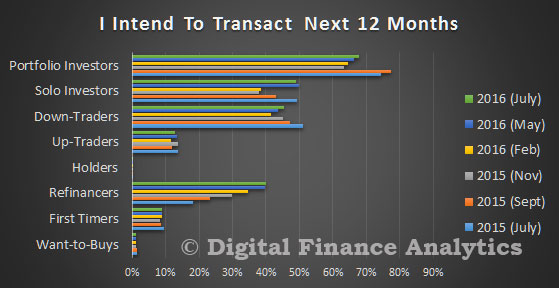
We continue the results from the latest Digital Finance Analytics household surveys, by looking at property investors, who now make up around 35% of all residential property borrowers. This is much higher than in any other similar economy (e.g. UK 17%). The appetite for investment property is still strong, and despite some tightening of lending criteria and slowing capital growth momentum, investors still wish to transact. Bank lending to investors in June 2016 rose by 0.1% or $0.6 billion.
As a reminder, we showed that investors (either those with one or two properties – solo investors, or those with a portfolio of properties – portfolio investors) were the most likely to purchase, even compared with those seeking to refinance.
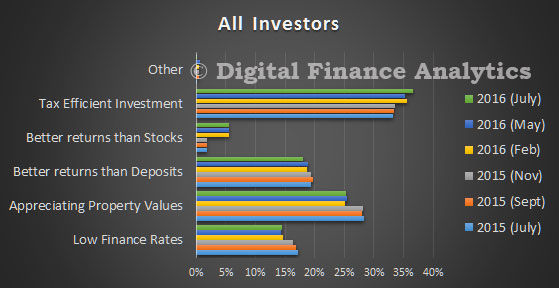
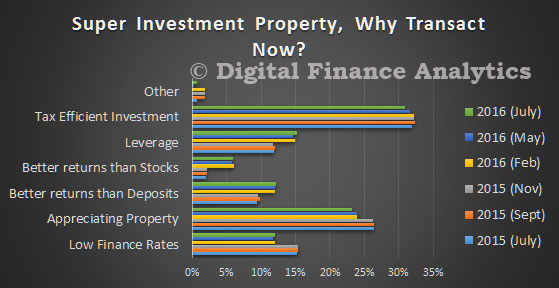
The driver to transact relate firstly to the tax effectiveness of the investment (37%) and capital gains from appreciating property values (25%). Low finance rates are helping, and investment property is perceived as offering better returns than bank deposits or stocks. We know that many in the eastern states will not make positive pre-tax returns, but taking tax breaks into account, they are still ahead, and will remain so unless there is a significant fall in home prices.
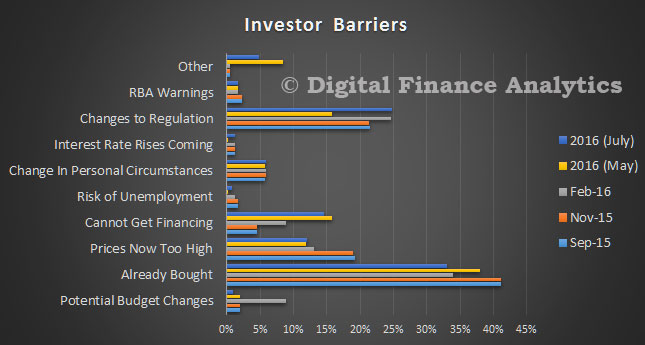
There are some barriers which investors have to negotiate, the most obvious is they have already bought (40%), potential changes to regulation (25%), and inability to get financing (15%). Risks relating to budget changes have dissipated, and some are concerned about static or falling rents (bundled in the other category at around 5%).
Solo investors have similar drivers with a focus on tax efficiency and potential capital gains, supported by low finance rates. We note that they have lower expectations of future gains than other investors (portfolio and those investing via SMSF).
Looking in detail at SMSF property investment, tax effectiveness, leverage and potential capital gains all drive the decisions. We did note some concerns about changes to superannuation regulation, especially around the caps, but this has not deterred prospective purchasers.
There are about four percent of SMSF’s holding residential property, and typically it comprises just a proportion of the total fund. A further three percent are actively considering adding in property to their SMSF.
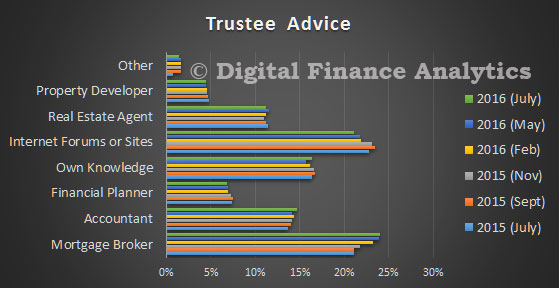
It is also worth noting that mortgage brokers are becoming more influential in providing advice to trustees seeking SMSF advice, alongside accountants. Internet forums and web sites still play a significant role in providing advice to trustees. 17% say they know enough, and rely on their own knowledge and experience.
So, investors will continue to sustain the market, and should the RBA cut rates again tomorrow, we should expect additional momentum, thanks to lower funding costs and paltry returns from bank deposits. Property investors are making logical decisions, given past performance, but at some point the tide just has to turn. But at the moment, returns from property simply outperforms other investment classes, and are perceived to be “as safe as houses”.
Next time we will round out the survey results by looking at some of the other property active segments.
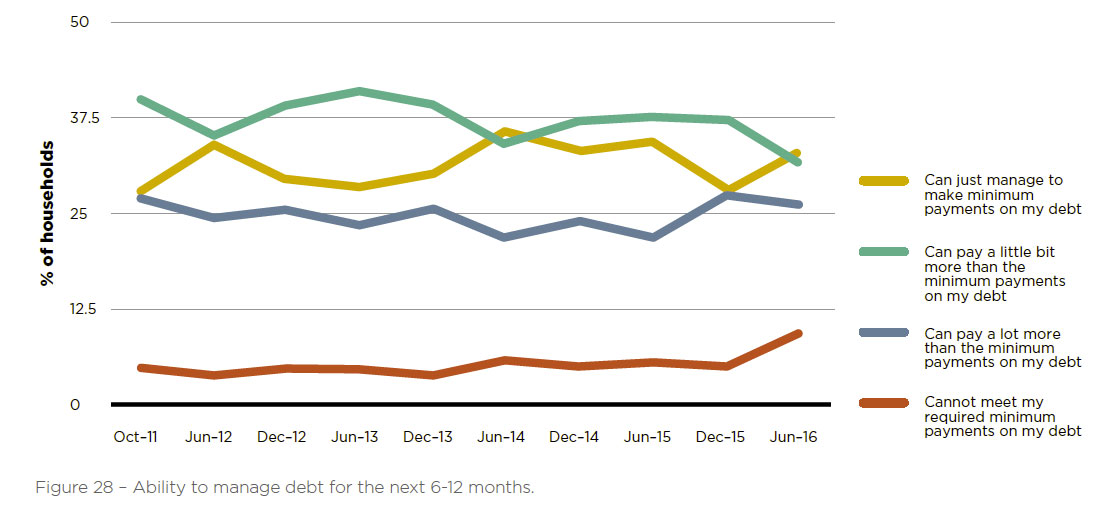
ME’s tenth biannual Household Financial Comfort Report shows
marked deterioration in Australian households’ confidence in their
‘ability to manage debt over the next six to 12 months’, doubling from
about 5% over the past few years to 10% as at June 2016.
‘Single parents’ reported the highest levels of concern in their ‘ability to meet minimum debt repayments over the next six to 12 months’ (19%), followed by ‘couples with young children’ (15%) and ‘young singles/couples’ (12%). Consistent with an expected rise in debt stress, more households ‘paying off or owning a home’ reported to be drawing on their home equity to ‘pay off debt’ (up 4 points to 11%) and ‘to make ends meet’ (also up 4 points to 10%) during the first half of 2016.
There is a marked increase in households feeling vulnerable to income shocks associated with wage cuts, fewer hours worked and a lack of suitable jobs as well as lower dwelling prices in some parts of Australia, all of which increases debt stress. With a lack of cash savings or equity buffer in their home, there’s a notable increase in households expecting to be unable to service their debts, despite record low borrowing costs.
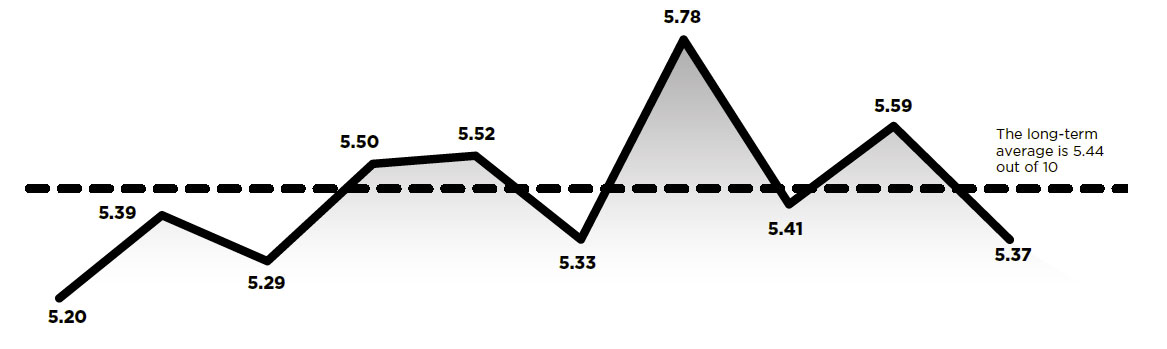
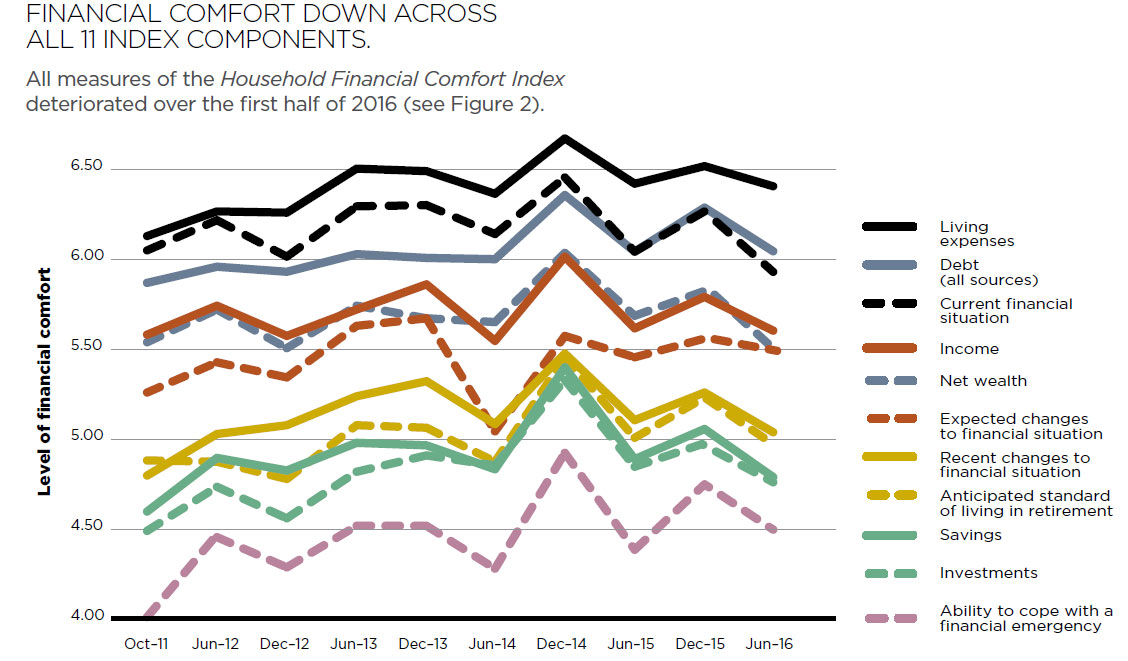
As for the overall finding, ME’s overall Household Financial Comfort Index – a measure of households’ perceptions of their financial comfort − dropped significantly by 4% to 5.37 out of 10 in the six months to June 2016.
This result means about 90% of Australian households reported low-to-mid financial comfort, with only 10% reporting high comfort. The result reverses the increase in comfort reported in December 2015, and is the fourth lowest financial comfort level since ME commenced the survey in late 2011.
All 11 index components deteriorated, with the largest falls seen in ‘net wealth’, ‘income’, ‘cash savings’ and ‘investments’ as well as households’ ‘ability to handle short-term income loss’ and ‘anticipated standard of living in retirement’. The Report identified a number of factors contributing to the significant deterioration in perceived financial comfort.
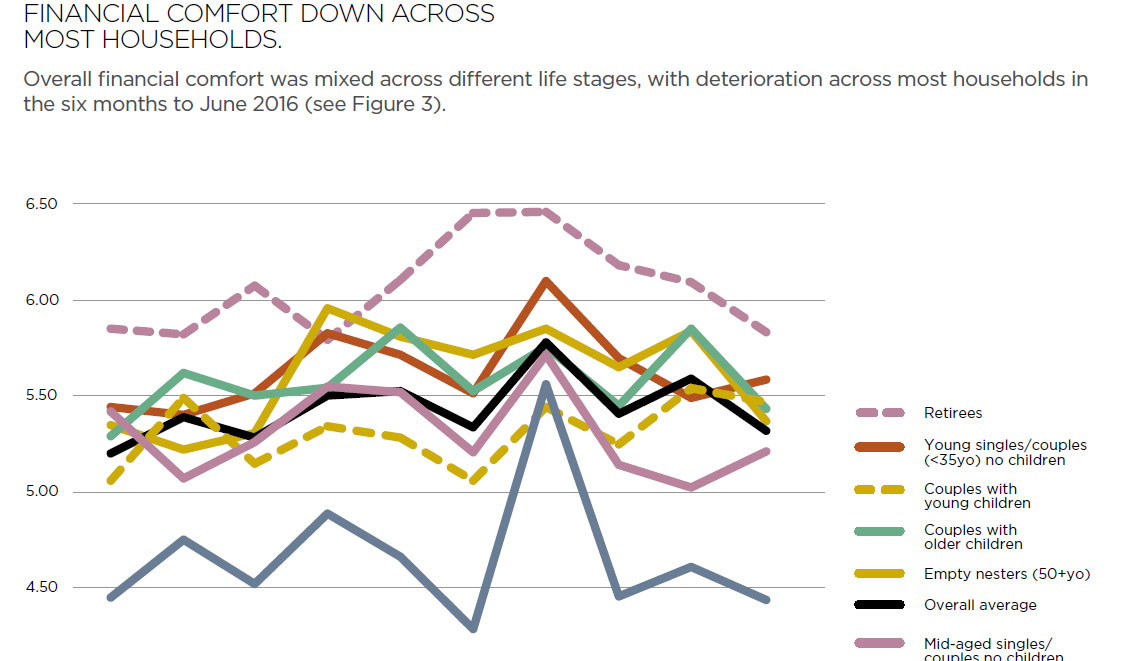
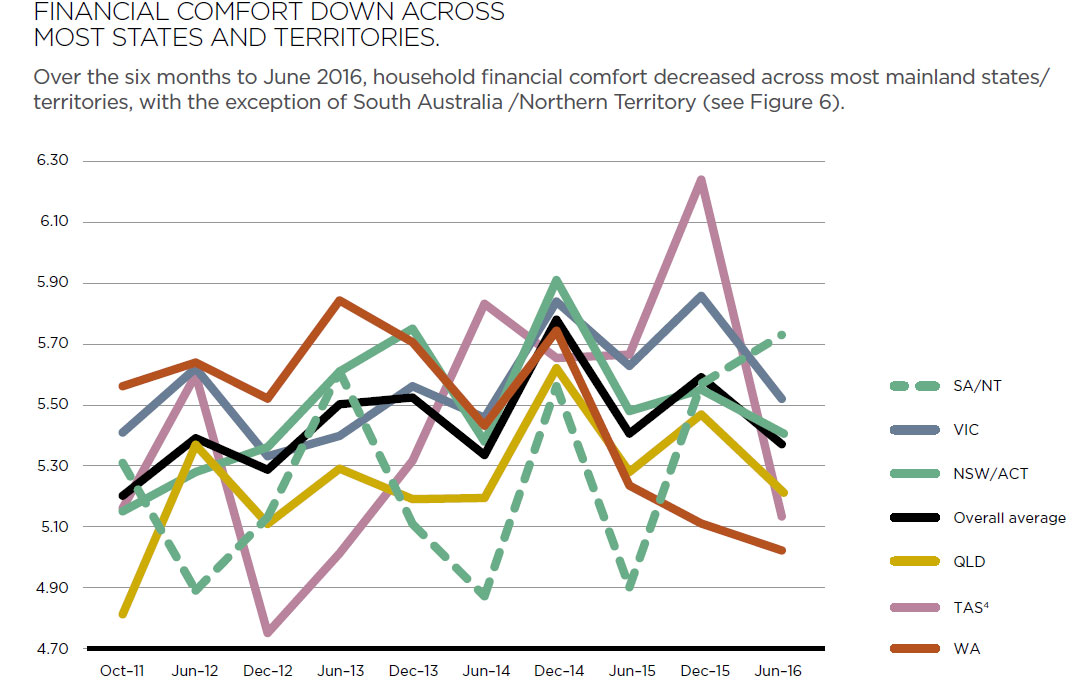
South Australia was the most financially comfortable mainland state in Australia, rising 2% to a historical high of 5.74 out of 10, while all other mainland states experienced a fall. Comfort levels in Western Australia fell 2% to a record low of 5.02 out of 10. While financial comfort in Victoria as a whole experienced a 6% drop to 5.52, Melbourne reported the highest comfort level of any city at 5.80 out of 10 – down only 2%, and still well ahead of Sydney, which reported a 4% drop to 5.58 out of 10.
The findings clearly indicate heightened concerns around the adequacy of income, the cost of necessities, lack of job availability and security as well as deterioration in expectations about meeting minimum debt payments and maintaining a standard of living in retirement.
In terms of generations1, the comfort of ‘baby boomers’ fell the most of any generation (down 7%) to the lowest level reported for that age cohort in the past couple of years (5.42 out of 10) – lower than ‘Gen Y’ (down only 2% to 5.46), but still above ‘Gen X’ (steady at 5.18).
‘Baby boomers’ reported greater perceived stress with ‘income’, ‘cash savings’ and ‘net wealth’ in the past six months to June 2016, despite continued gains in actual income and net wealth across households on average. ‘Baby boomers’ also reported greater worries with the ‘cost of necessities’ and the ‘ability to maintain lifestyle in retirement’ as well as the ‘level of government assistance available’ and ‘impact of legislative change on their financial situation’.
The findings add to a number of recent policy debates such as changes to superannuation. As many as 45% of ‘baby boomers’ said they ‘expect to be worse off after the recent Federal Budget’. Furthermore, ‘retirees’ reported their lowest levels of comfort since the survey began, although they’re still the most financially comfortable of any household life stage.
Australia’s anti-dumping system has become tool for protecting industries which aren’t competitive. Over time federal government has cranked up penalty charges on imports, such as steel, deemed unfairly under-priced, to protect these businesses. It’s Australian consumers who bear the cost.
In its latest Trade and Assistance Review, the Productivity Commission found a pronounced spike in anti-dumping duties. The average duty on imports considered “dumped” (sold below market prices) was 5% each year between 2006 and 2011. Between 2012 and 2015 it rose 15%.
This is running against the global trend. The World Trade Organisation (WTO) reported last year that among G20 economies, increases in anti-dumping duties was abating.
The rules of the WTO allow members to impose duties on imports if they are found to be sold at prices less than the cost of the product and in quantities that distort the import market.
Typically, such imports in Australia include steel, power transformers, heavy machinery, food products, plastics, paper and other metals. How these duties are imposed is determined by the Anti-Dumping Commissioner.
Free market economists query the concept of dumping. If a product is put on the market by a business at a price below cost, is that not a standard commercial practice to offload excessive inventories or to flood the market with goods in order to build a market presence?
The WTO rules are loose enough to provide plenty of room for interpretation of what can be classified as dumping. One problem with this is that blocking imports assessed as under-priced and harming local producers is common during recessions.
The WTO began analysing the incidence of imposition of new trade restrictions including anti-dumping measures after the Global Financial Crisis. It found they multiplied three or four times.
When governments cut tariffs, as the Hawke Government did in the late 1980s, political pressure to impose new restrictions on cheaper imports was expected. So it set up an independent regulator (the Anti-Dumping Authority) to rule if imports were unfairly-priced and undermined Australian policy to open markets. Strict criteria were set.
But as tariffs started to reduce, Australian farmers and manufacturers pressed the Howard Government to loosen them and the Authority was abolished.
Responsibility for assessing complaints was shifted from an independent regulator to a Minister or senior official accountable to a Minister. This opened a channel for political pressure.
And over time, the interpretation of what was a “dumped” product was progressively expanded. The amount of time defendants had to respond to claims of dumping was also progressively reduced diminishing their opportunity for equal hearing.
The Gillard Government went further, creating an Anti-Dumping Commissioner. It is now official government policy endorsed by the Coalition government that the Commission is to “level the playing field”. Incredibly, this is now official terminology.
The Productivity Commission assessed that rulings by the Commissioner distinctly favoured domestic producers.
Australia’s anti-dumping system has become a protectionist tool. The Commission reports the average duty imposed over the last six years was 17%, the median 11%. Where Australia still imposes tariffs, the average is 5%.
Former Prime Minister Tony Abbott helps a worker at Independent Steel Company in Queanbeyan, Thursday, May 31, 2012.Lukas Coch/AAP
Liberal National Party Governments have been as receptive to this as Labor Governments. As Prime Minister, Tony Abbott wanted the system toughened and advocated reversal the onus of proof when importers were accused of dumping. Legal common sense prevailed and this was dropped.
Instead, the then relevant Minister, Christopher Pyne, announced a tightening of procedures to assess dumping. According to the former Assistant Minister for Science, Karen Andrews, the Commission would also monitor trends which pointed to dumping. This came at the time of the serious financial problems facing the steel works in Wollongong and Whyalla.
The Government has negotiated important Free Trade Agreements with Australia’s Asian neighbours. If the commitments in those agreements to reduce tariffs are obviated by subsequent decisions by the Anti-Dumping Commission to impose new higher duties on imports, this would undermine Australia’s credibility as a promoter of growth through open markets.
Australia should not forget steel from China, a target of anti-dumpers, is made from Australian iron ore and Australian coal which are much larger industries and earners for Australia than its steel industry. The coal and iron ore industry workforce combined is 98,000 and the workforce at Bluescope and Arrium is 10000.
Cutting tariffs in the nineties gave Australia the highest consistent growth rate of any OECD country for over 25 years. As global growth slows, what is the sense of reintroducing protection in Australia?
Author: Alan Oxley, Chair, APEC Study Centre, expertise international trade law, economics, Asian regional development, RMIT University

 Responses to a set of special annual questions on the approximate levels of lending standards suggested that banks’ lending standards banks continued to report in the July 2016, that on balance, domestic banks lending standards for all five categories (GSE-eligible mortgages, government-insured mortgages, jumbo mortgages, subprime mortgages, and HELOCs) remained tighter than the midpoints of the ranges observed since 2005. Of note, a major net fraction of banks reported that the current level of standards on subprime residential mortgage loans is tighter than the reference point.
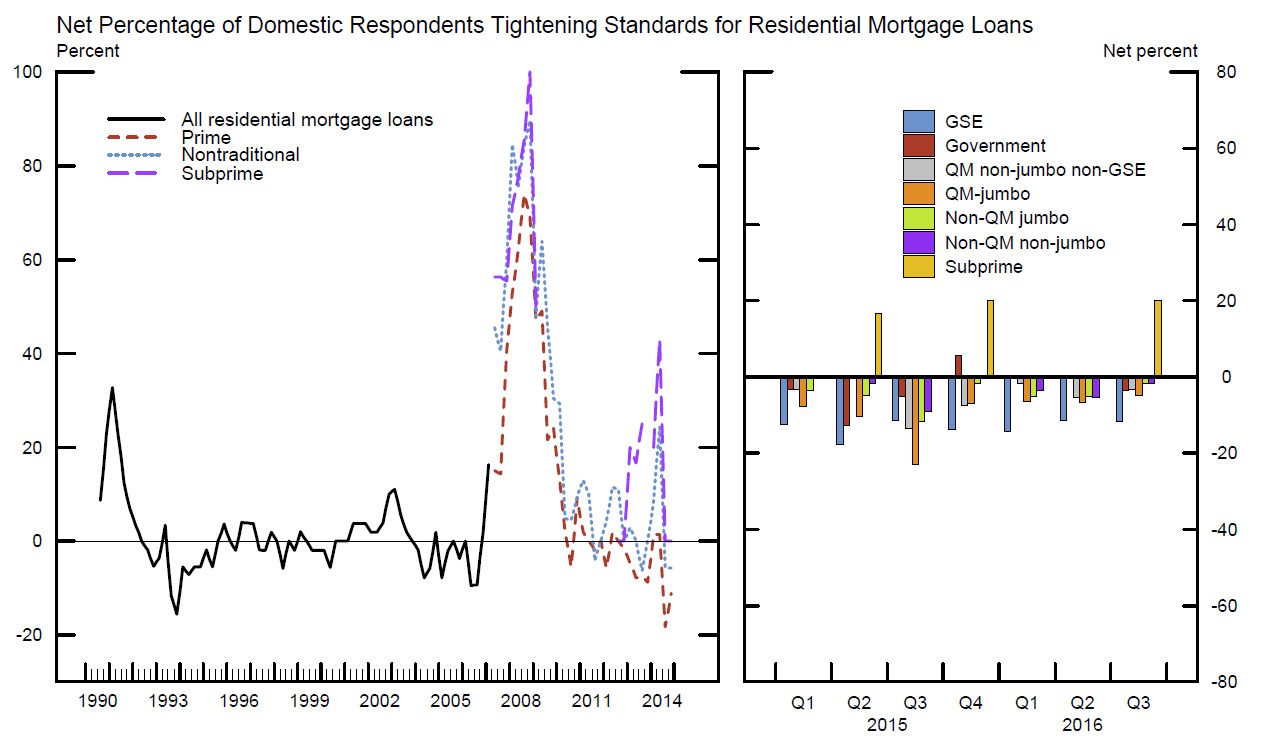 The report also discusses commercial lending and consumer loans.