Auction Clearances Continue To Motor

Latest preliminary data from APM Pricefinder shows continued momentum in auction sales today.  Nationally, 1,912 were listed and 78.9% cleared, compared with 75.8% of 1,599 listed last week, and 68.4% on a slightly higher listing last year. Sydney led the way at 81.6%, compared with 79.6% last week on higher volumes.

apm-24-sep-2106-1

Melbourne was also higher at 79.6% on 950 listing, compared with 78% on 793 properties last week. Adelaide 77% of the 86 listed, and Brisbane cleared 53% of the 103 listed. Canberra hit 66% of the 56 properties listed.

So once again, the main action was in Sydney and Melbourne, with clearance rates at extreme levels – who says the market is tanking?apm-24-sep-2106

The End of the Commission Remuneration Model In Financial Services?

The wind of change seems to be blowing though the financial services sector as the focus on doing the right thing for customers increases. The industry’s dirty secret is that many in the sector are rewarded on a commission basis for selling products and services, irrespective of whether they are right for the customer concerned. Recent scandals have been all about the interests of the industry coming ahead of consumers, whether employed by the firm, or an “independent” advisor.

commissionThis entrenched practice took root as players sought to boost profit by cross selling and up-selling more products to their customers, and targets, plus commissions became a pretty standard, if undisclosed, practice when working with third party advisors.

Whether a bank teller, a financial advisor, a mortgage broker, or other bank employee; behaviour is likely to be influenced by expectations of personal remuneration. This is not transparent to the consumer, who relies on the advice.

But this week we may be seeing signs of a new set of practices emerging. Westpac has said it will no longer pay sales commissions to bank tellers, but performance will be assessed by customer satisfaction. Changes are also afoot in the sales force too.

From next month we’re planning to remove all product related incentives across our 2,000 tellers in the Westpac branch network. Rather, their incentives will be based entirely on customer feedback about the quality of service they received in the branch.

We have also revisited the way we reward specialised sales roles in our network. We will no longer vary reward values based on different products; but rather our people will be rewarded for meeting the full range of our customers’ needs.

The Hansard record of the new RBA Governor’s comments this week made some interesting points about remuneration in financial services and the cultural issues arising.

Mr THISTLETHWAITE: You mentioned earlier your mandate in terms of financial systems stability. There has been a whole host of scandals in recent years with the banks, particularly with their wealth management arms. It is an issue that this committee is going to inquiry into in the coming months. This is a bit of a left-field question, but, from a regulatory perspective, if you were redesigning our financial system regulation in Australia what would you change?
Dr Lowe: I do not think a whole redesign is required.
Mr THISTLETHWAITE: Would you change anything?
Dr Lowe: APRA is the financial regulator, so it is not the Reserve Bank. And APRA has made many changes to the nature of financial regulation recently—really around capital and liquidity. So I think the finance sector feels like it has gone through a period of very accelerated regulatory change. It is best, probably, to kind of let that settle and see how the system adjusts to it. I sense that you are asking about other types of regulation that really go to the issue of bank culture.
Mr THISTLETHWAITE: Is there anything you want to say about that?
Dr Lowe: I cannot help but agree with you that there have been too many examples of poor outcomes, particularly in the wealth management and insurance industries. That is disappointing to us all.
Maybe I can make two other remarks—and, again, a broader perspective. The Australian bank system has performed well over a couple of decades. We did not have the excessive risk-taking culture in the lead-up to the financial crisis. I think that is really important. If we had a really bad risk-taking culture, we could have ended up in the same situation as many other countries did. Part of it is due to APRA’s good regulation, but the banks did not develop this culture that we saw overseas. So that has given us more stability. Again, that is a first-order point.

In terms of behavioural issues—it is hard. I think it comes down to incentives within the organisations, and that is largely remuneration structures. That is a responsibility of management. And, probably, APRA can play some constructive role in encouraging remuneration structures that create the right incentives within organisations. If there was one thing that I could focus on—it is not my responsibility; it is not the Reserve Bank’s responsibility—is making sure that the remuneration structures within financial institutions promote behaviour that benefits not just the institution but its client.
What I would like to see is, really, banking return to be seen as a strong service profession. I do not know how far away from that we are. Banking, historically, has been a profession—a profession of stewardship, custodians, service, advisory, counsellor. Is not a marketing or product-distribution business; banking is a profession.

I like the Banking and Finance Oath. I do not know whether you have seen this, but a number of people have signed up to this, including me, and I encourage others to do it as well. Its first line is: ‘Trust is the foundation of my profession.’ We have got to move beyond people just signing this oath to actually making that in practice. I do not run a commercial bank. I do not know how to embed within a commercial bank the idea that trust is the foundation of the noble profession that we do. It is largely about incentives and remuneration.

The Australian Bankers Association had previously announced a Independent Review of Product Sales Commissions and Product Based Payments

The final report is expected to provide an overview of product sales commissions and product based payments in retail banking and other industries, identify possible options for better aligning remuneration and incentives so that they do not result in poor customer outcomes and set out actions which may be considered by banks and the banking industry to implement the findings.

This puts the current ASIC remuneration review of mortgage brokers in a new light perhaps. The outcomes are expected in December. However, this review is being done in secret. As we said in an earlier post:

ASIC has evidently released the final scope of its review of remuneration in the mortgage broking industry – but only to industry insiders. According to media, the corporate regulator has confirmed it will review the remuneration arrangements of “all industry participants forming part of the value distribution chain”. This includes lending institutions, aggregation and broking entities, and associated mortgage businesses – such as comparison websites and market based lending websites – and referral and introducer businesses.

But why, we ask, was the scope not publicly disclosed? Why are ASIC seeking input only from industry participants? We agree the remuneration review is required – but the lack of transparency is a disgrace.

Our guess is that commissions will not be banned, and the findings will focus more on better disclosure.

It is worth remembering that before that the changes to FOFA were disallowed in the Senate in late 2014. The changes would have made if easier for employees to receive incentive payments for product sales.

So now the climate appears to be changing. Will other banks follow Westpac’s lead? Will the remuneration review lead to changes to commission structures (especially trails) or a ban? Could we be seeing signs of fundamental cultural change in the industry? And will consumers be better off?

Worth reflecting on the changes which have emerged in the UK.

From April 2016 investment middlemen, including financial advisers and do-it-yourself investment brokers, will no longer be able to accept commission payments from fund companies.

The changes coming into force are the final phase of a series of new rules that started to apply at the start of 2013, which stopped advisers receiving ongoing, or “trail”, commission on new investments.

This rule has applied to brokers since April 2014. Since this date brokers have not been able to receive ongoing trail commission on new businesses, due to the legislative changes.

But until April 2016 commissions could still be deducted from earlier investments. And it is that backlog of investment which, for many, will soon become cheaper.

From April, instead of taking commissions, all middlemen will have to charge an explicit fee, expressed either as an hourly rate or as a percentage of savers’ investment pot.

The new rules were ushered in to remove any potential bias. But – and this is the catch – these old-style payments will not cease for some investors, such as those who went direct to the fund provider, or invested through a bank.

The ‘Huge Uncertainty’ in Some Australian Apartment Markets

From Business Insider.

Australia is building an extraordinary number of high rise apartments right now. Everywhere you look, there seems to be a new development under construction, especially in Australia’s southeastern capitals.

And, going off recent building approvals data, it seems that there are a whole lot more coming.

Like a number of other commentators, Bill Evans, chief economist at Westpac, is uneasy about Australia’s high rise construction boom, stating in a research note released today that “huge uncertainty prevails in this market”.

The source of this uncertainty, says Evans, is the heavy involvement of Chinese buyers in the market, something that has helped propel the building boom in recent years along with the increased prevalence of housing investors.

“The number of high rise apartments currently under construction in March this year (ABS latest) has surged to 110,000 – including 44,000 in New South Wales; 34,000 in Victoria; and 23,000 in Queensland,” says Evans.

“However, a significant proportion of the buyers are offshore based, so called FIRB buyers,” he adds.

According to a recent survey conducted by ANZ in consultation with the Australian Property Council, foreign investors accounted for 23.9% of all property sales in Australia during the June quarter of 2016. The proportion of sales in Victoria and New South Wales were the highest in the country, accounting for 30.8% and 25.4% of all sales over the same period.

With so many apartments being sold to foreigners, many of them to Chinese, it is clear that much of the residential building boom, and beyond that the outlook for prices, is determinant on the continued involvement of foreign investors.

According to Evans, this creates heightened risks for the sector should the buying start to dry up.

He suggests that recent moves from Chinese policymakers to stymie capital outflows from the country not only heighten risks for apartment prices and settlement on newly constructed apartments, but are also a crucial cog in Australia’s economic transition, the booming residential construction sector.

“At some point, the Chinese authorities, who appear to have stabilised last year’s spectacular near USD 1 trillion loss in foreign reserves, may decide to slow this leakage,” says Evans.

“Certainly we have seen marked evidence of a tightening of capital controls, particularly for the non-corporate sector. That tightening of capital controls might also impact the construction boom.”

Adding to the uncertainty, Evans says that Australian banks have stopped funding FIRB buyers, suggesting that this presents “risks to local developers who may have sold more than 50% of their stock to these buyers”.

“It is generally accepted that apartment buyers in the Melbourne CBD have incurred some capital losses, while Sydney purchasers are seeing their profits squeezed,” he says. “These liquidity and capital loss prospects may discourage foreign buyers, with the result of sharply slowing the apartment construction cycle.”

Evans, like others, is unsure how it will all play out, noting that possible outcomes range “from ongoing spectacular momentum to a sudden liquidity driven slowdown”.

In the case of the latter, he says “one part of the recent boost to Australia’s growth story might fade quickly”.

The sentiment expressed by Evans is similar to that communicated by a growing number of analysts.

In a research note released in early September, Ivan Colhoun, chief markets economist at the National Australia Bank, suggested that the presence of a large numbers of foreign investors in these markets complicates not only the outlook for prices but also settlement risks.

“Recent trends and reports suggest there has been a modest increase in delays in settlement rather than outright non-settlement. And it is typically foreign buyers that are now finding it somewhat harder to access finance and/or expatriate finance (the latter largely from China),” he wrote.

Cameron Kusher, research analyst at CoreLogic, suggested in May that tighter restrictions on overseas buyers from Australian banks was a factor that could amplify settlement risks for newly built apartments in the years ahead.

“Mortgage lenders have recently tightened their lending criteria, subsequently some people who have committed to off-the-plan units may not be able to borrow as much as they could at the time of signing the contract,” said Kusher.

As a result, Kusher noted that there was a clear risk that some properties may be be worth less than the price they were purchased for, heightening settlement risks.

“Many of the units are coming up for settlement in similar locations and will compete with existing unit stock,” he said.

“With so much stock coming online at once there is an increasing concern as to whether settlement valuations will actually meet the contract price of these units.”

The UK is sinking deeper into property inequality – here’s why

From The Conversation.

Outrage has been mounting over the untaxed incomes of the global elite, foreign ownership of urban land and soaring rents in the private rental sector. Much of this boils down to two key matters: who owns property, and how they are treated.

The UK, it seems, is a place that makes it very easy for individuals to generate a great deal of wealth from property, with little concern for social justice or the provision of affordable housing.

But this problem is not uniquely British. Across the world – and particularly in many developing countries experiencing fast economic growth – capital is flowing rapidly into real estate. And increasingly, governments are waking up to the need to effectively capture some value from these investments, for the public good. Yet, as my research shows, this can be extremely difficult to achieve due to complex historical legacies around land, as well as deeply entrenched vested interests.

Consultants from the UK and other rich countries are often the first on hand to provide advice and propose systems of property and land taxation, to enable governments in poorer countries to bring in revenues that reflect the real value of developments. Meanwhile, ironically, the UK’s primary property tax – a monthly “council tax” paid by residents to local authorities – remains scandalously out of line with modern property values.


House prices are rising – but council tax isn’t (London, 1995 to 2015). Alasdair Rae, University of Sheffield

Of course, property inequality looks very different in British cities than it does in cities in developing countries. In many African cities, a clear majority of people live in slum conditions, the like of which are (thankfully) consigned to the past in Britain. Yet the property markets are being transformed by very similar processes.

International capital flows are central in both cases: wealthier migrants from low-income countries now based in the US and Europe often channel their earnings into untaxed property back home, while the UK solicits property investments from footloose international elites Whatever the context, the outcome is largely the same: luxury properties abound, often unoccupied and almost always undertaxed, while governments fail to provide proper incentives for developers to invest in cheap housing.

These issues are particularly concerning in poorer countries, not only because of the scale of inequalities and gaping absences of affordable housing, but also because investments in luxury properties divert funds from other sectors, which urgently need capital to make the nations’ economies more productive.

What to tax?

It seems clear that governments of both poor and rich countries need to find ways to reduce the appeal of massive investments in high-end property, and to spend more on housing and services for low-income groups. The question is: how?

Stamp duty is obviously one mechanism for capturing some of the value of property, but as this is a one-off payment it deals with only part of the problem. Updating the council tax is an important step in the UK – though this will be very politically difficult.

More fundamentally, however, simply updating council tax bands sidesteps major questions about exactly what we should be taxing when we tax property. Given the state of the UK property market, a proper debate is needed on these issues. But as this is also a global issue, the UN’s biggest conference on urban development issues in 20 years should also provide a forum for discussing this at the global level.

One possibility that has aroused significant interest is a land value tax. The idea is that public investments in infrastructure – rather than private individuals’ effort – make land valuable. So, the government should “recapture” this value for further public investment, by taxing property owners a proportion of the annual rental value of their land.


Less vacant land. Sinkdd/Flickr, CC BY-NC-ND

Some argue that taxing land also encourages people to use land productively, and deters speculation; in other words, if you are paying a relatively large amount of tax on a plot of land, you will want to make the best possible use of that land (by building a tall tower, for example), in order to maximise your profit.

By contrast, taxing buildings discourages investment and development, so many proponents of land value taxation argue that structures should simply be ignored. There is a certain progressive logic to this: for the most part, growth in land value provides a windfall to the owner, so it seems like a fair revenue to tax.

Should buildings be off the hook?

But a land value tax could have some undesirable consequences: exempting buildings from taxation encourages developers to build for maximum profit – and this often means constructing expensive, luxury residences for wealthy investors. What’s more, large buildings impose on the surrounding residents and public spaces in a number of ways which can be seen to warrant taxation – for example by blocking light, generating traffic and adding to pollution and noise.

In countries where forms of land taxation are relatively high, but building taxes small or non-existent, there is a tendency to speculate on buildings for which there is no obvious demand. This can be particularly harmful when there isn’t sufficient public infrastructure or services to support these looming edifices.

If we consider property tax as a means of redistributing wealth from the rich to the less well-off, then it makes sense to tax buildings. After all, why should one person be able to own a large, immovable asset without paying tax on it, when others pay tax on so many goods, services and incomes? Is it really fair for the residents of high-rise developments to pay a small fraction of a land value tax, regardless of the actual value of the luxurious apartment which they occupy (or, more accurately, don’t occupy)?

No – taxing property wealth is not only about taxing the windfall of increased land values: it is about acknowledging that the playing field of society is not level, and that the rich should pay more because they can. And it’s not just a question of social justice – it’s also about the kinds of incentives we want to create for investment, and the kinds of lifestyles that this promotes. We should not be so keen to encourage intensive investment in land that we exempt buildings – no matter how extravagant and unnecessary – from any kind of tax.

In many developing countries, innovative approaches to valuing and taxing property are being proposed and piloted, and concerted efforts are being made to overcome political resistance. The UK would do well to follow suit and bring its system of property taxation into the 21st century.

Politicians fear these issues, and public discussions about property tax has fallen all but silent since the failure of the previous Labour government’s “mansion tax”. No solution is simple; but not talking about it won’t solve anything at all.

Author: Tom Goodfellow, Lecturer, University of Sheffield

Westpac to Remove all Teller Product Related Incentives

Westpac Group CEO, Brian Hartzer, at a speech to the Australia Israel Chamber of Commerce in Melbourne called for ongoing and significant changes to the way banks work with their customers.

westpac-atm-pic

The trust gap.

Having said all that, it is impossible to convince someone of the value you’re adding if they don’t trust you. And we need to recognise, that, as an industry, we have a trust gap.

Trust is at the heart of banking. And trust in banking is like trust in any other relationship: It requires that we treat people fairly and honestly.

As a result of things some bankers have done, or the way banks have responded when things have gone wrong, some people have concluded that banks—and bankers—are only out for themselves.

And banks only have themselves to blame for that.

We need to recognise that at times we have not met the expectations of the community. People are saying things need to change. They do need to change.

The good news is they are changing.

Across the industry we are changing processes and we are changing behaviours.

At Westpac we are going back to basics and reviewing all of our products, policies, and processes, to make sure they are working in our customers’ interests.

I’ll give you one small example.

Last week some of you may have read about a mistake we made with one of our products. We weren’t applying a discount properly on some accounts for younger customers. The fees needed to be manually reversed and in some cases they weren’t. Through our reviews we identified the mistake, reported it to ASIC, refunded the money, and have now put automated systems in place to make sure it won’t happen again. Procedural mistakes like this are not acceptable. And they do nothing to help banks regain trust from people who are already skeptical.

Yes, we found it and fixed it: Part of the Westpac ethos is that if we get it wrong we put things back on track.

But this small example shows the need for constant vigilance and continuous improvement on the part of the banking industry.

We’re also focusing on our culture more broadly, reinforcing our goal of being one of the world’s great service companies.

Let me be clear: I am proud of the 40,000 people who work at the Westpac Group. I know that overwhelmingly they come to work each day wanting to deliver great service and help their customers.

Across the company, complaints have fallen by over 70 per cent in the last four years. Over the past three months we had three times as many compliments as complaints in our branch network. This gives me confidence we are on the right track—but we know we need to do more.

We are putting our financial advisers through ethics training, and are incorporating the principles of the banking oath into our code of conduct for all employees.

We are also changing practices that might be seen as creating potential conflicts of interest.

Through the Australian Bankers’ Association we are working to agree on steps the industry can take to eliminate the perception of conflicts of interest in the way front line staff are paid. An independent expert is reviewing those practices and we will adopt whatever is agreed.

Having said that there are things Westpac can do on our own, and we’re moving ahead.

From next month we’re planning to remove all product related incentives across our 2,000 tellers in the Westpac branch network. Rather, their incentives will be based entirely on customer feedback about the quality of service they received in the branch.
We have also revisited the way we reward specialised sales roles in our network. We will no longer vary reward values based on different products; but rather our people will be rewarded for meeting the full range of our customers’ needs.

This is all part of making sure that when our customers walk into a branch, they don’t have cause to question the quality of service that they’re getting, or the motivation of our people.

At the same time we’re reinforcing standards of behaviour, and enforcing consequences when people fall short.

We’re appointing an independent customer advocate who is empowered to resolve issues for our customers. And who can overturn decisions made by our internal dispute resolution process.

And we’re investing more in our compliance and oversight capabilities, to make sure we can quickly spot and resolve issues when they occur.

We’re also continuing to give back to the community, through our support of the Westpac Rescue helicopters, the Westpac Bicentennial Foundation, which gives a hundred scholarships a year, volunteering leave and matching gifts for staff, and 200 Westpac community grants of $10,000 each this year alone.

It’s part of why the Dow Jones Sustainability Index has just recognised Westpac as the world’s most sustainable bank, for the third year in a row.

And we’ll continue to take action now, Royal Commission or not.

Housing Affordability at ‘Crisis Levels’

From The Real Estate Conversation.

Shadow Treasurer Chris Bowen has spoken about the decline in Australia’s housing affordability, saying we are ‘a nation that can no longer house its own children.’

Shadow Treasurer Chris Bowen has delivered a passionate speech at left-leaning public-policy think tank, the McKell Institute, outlining the decline in the middle class in Australia, and listing worsening housing affordability as one of the main problems facing an increasingly pressured middle class.

Housing-Key

In the speech, Bowen said Australians’ aspirations for home ownership were perhaps stronger than anywhere else in the world, but that it was becoming “an aspiration which, for far too many, is becoming a pipe dream.”

“Overall home ownership in Australia is at a 60-year low,” said Bowen.

“In 1982, 62 per cent of people aged 25-34 owned their own home. By 2012, this had collapsed down to just 42 per cent,” he said, citing the recent HILDA report.

People today are paying 15 times their annual income to purchase a new home, said Bowen, compared with five times 25 years ago.

“Young people unable to crack into the housing market strips them of one of the most fundamental wealth drivers through their lifetime,” said Bowen, concluding that housing affordability is at “crisis levels”.

Bowen says Australian who can not afford to buy their own home are cut off from an important source of capital, as many fulfill their aspirations by borrowing against the family home.

“For many it (home ownership) is a means to a broader aspiration, of access to the capital which is built into the family home,” said Bowen.

Bowen believes the government should be playing a greater role in improving housing affordability.

“At the Federal level, our tax system continues to provide very generous tax concessions to property investors and zero assistance to first home buyers,” he said, explaining that Labor’s changes proposed during the recent election campaign were designed to deliver more balance to home owner and investor incentives.

“Our policy to limit negative gearing to new properties puts first home buyers on a more level playing field with investors, provides a stimulant to new construction to add to supply and, together with capital gains tax reform, adds $37 billion to the budget over the next ten years,” he said.

The Property Council has welcomed the Shadow Treasurer’s commitment to make housing affordability a primary policy issue for the Opposition.

“Mr Bowen’s speech recognises a central tenet of the Australian success story: high rates of home ownership across all parts of Australian life are critical to social cohesion and economic security”, said Ken Morrison, Chief Executive of the Property Council of Australia.

Morrison said he agrees it’s important that the next generation is not priced out of the housing market, but said he disagrees with the Shadow Treasurer about the means to achieve this.

“While we have differences with the Opposition about its tax policy for housing, we take this speech as an invitation to explore other areas where we can encourage high rates of home ownership and increased housing supply,” said Morrison.

“Our concern about the Opposition’s current negative gearing policy is that it is not an answer to the worsening state of housing affordability,” said Morrison.

“The McKell Institute and the Grattan Institute are the Opposition’s biggest supporters of its negative gearing policy, but even they concede that the impact on house prices will be minimal. McKell argues it will curtail prices by a modest 0.5 per cent a year and Grattan argues a 2 per cent fall in the price of housing,” Morrison said.

Morrison said he believes that changes to stamp duties would be a more effective tool in addressing housing affordability.

“Our challenge is supply and finding sensible ways to reduce costs in the market place. It is worth noting that the biggest beneficiaries of high house prices are state governments who are collecting enormous stamp duty and land tax receipts,” said Morrison.


How Best To Measure House Prices

Recently the RBA has been talking about house price metrics, and in their recent outings have been downplaying data from CoreLogic preferring metrics from other sources. Was this a case of selecting the data which best fits with your world view? As we said at the time:

The statistical “fog of war” appears to have descended on Australian home prices, partly fueled by the RBA’s recent statements, and the latest chart pack data. Because of perceived issues with the CoreLogic data series, we see plots from a number of data providers.

housing-pricesToday Tim Lawless from CoreLogic has discussed the issue of metrics in “A refresher on housing market measurements“.  Naturally he defends CoreLogic’s work, but it is also worth reading to see how complex the question actually is. We think the trend is the important perspective. But of course the picture is complicated when metrics are rebaselined without full disclosure.

Housing is Australia’s largest asset class, worth an estimated $6.7 trillion, so it’s important to measure the performance of this very important asset class in an accurate and timely manner. Recently there has been a lot more focus on the measurements of housing market performance, so it’s timely to provide a summary of the primary methods used for measuring housing market performance from a value/pricing perspective.

The complexities of property data

Before we go into the different measures, it’s worthwhile providing a brief refresher on property data which provides some background about why measuring housing market performance is a complex undertaking.

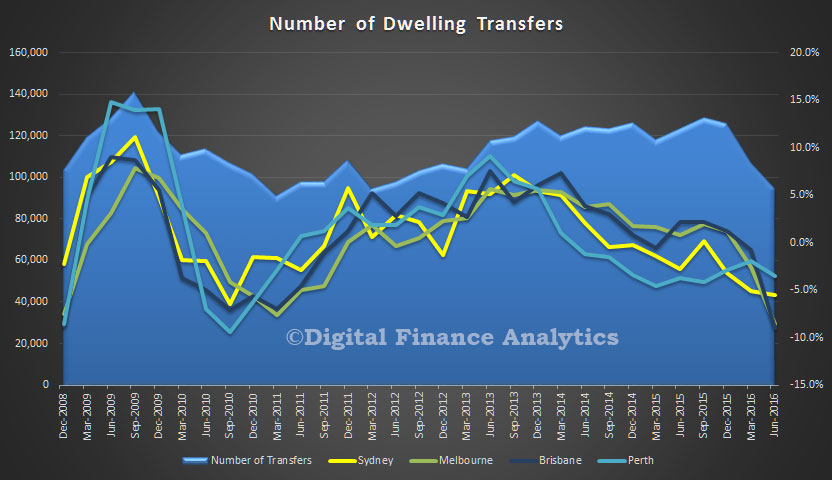
Firstly, compared with the equites markets, housing is an illiquid asset class. Individual properties are transacted, on average, every 8-10 years. The infrequency of transactions implies that the vast majority of residential properties are excluded from most housing market measurements which are reliant on transactional activity.

Secondly, housing is fundamentally nonhomogeneous; dwellings are unique in their characteristics based on their location and attributes, which makes the measurement of price and value shifts more challenging.

Additionally, the quality and timeliness of property data varies remarkably from state to state and between the private sector data providers. State governments collect a base level set of data which needs to be cleaned and augmented with more timely data and additional data sets such as attribute information to ensure a more complete and timely measure of housing markets is derived.

Regardless of the methodology used to measure dwelling price or value shifts, having housing data that is of the highest quality possible is the first and most important step in producing a reliable and accurate measure of the housing market.

CoreLogic collects and maintains the most comprehensive and current property and mortgage database, with more than 4.2 billion decision points across Australia and New Zealand that is growing in size every day. More than 60% of housing market transactions are collected directly from the industry, which provides a much more timely view of the housing market than relying solely on government provided transaction data.

What indicators are available to measure housing market conditions?

Housing market indices range in complexity from a simple median price indicators, which is subject to large amounts of bias and revision, through to a stratified median, repeat sales index and hedonic regression models. Each of these methods will provide different results for measuring price or value shifts across the housing markets.

Outside of these methodological differences, there will be further differences in results based on the data held by each of the private and public sector index providers as well as the way the data is cleaned, the sampling method, what geographic regions are being reported and what time frames the measures are reported across.

Simple median price

The median is simply the middle sales observation across a series of transactions. The median sale price is subject to a range of biases which can skew the middle observation up or down. Bias in median price can be caused by buyer types who are more active or less active in the market (for example, if first home buyers become more active there is likely to be a downwards bias in the median observation due to more transactions occurring at the affordable end of the pricing spectrum). Bias can also be found if there are changes in the types or quality of stock transacting and the median can be very volatile in markets with low turnover or where there are dramatic differences in the quality of housing. The advantage of median price is that it is very simple to compute and is easy to understand and interpret.

Simple median price measures are generally utilised by some of the real estate institutes and are still a common way of reporting price movements at the suburb or postcode level. Simple medians are useful for understanding what the middle observation for pricing is across a particular region over a specified point in time, however they aren’t all that useful for measuring capital gains over time due to the volatility and bias associated with this measure.

Stratified median

The stratified median measure, although still a measure of the middle observation, attempts to overcome the compositional bias of median price measures by dividing the market into separate strata’s, or segments, that are more alike. The Australian Bureau of Statistics, who use a stratified median measure, bases their stratification across dwelling types, the long term median price and socio economic indicators as specified here: . The ABS index is released quarterly after a significant lag and is non-revising.

Domain also use a stratified median approach, however no documentation appears to be publically available on their method or stratification approach. The Domain index is revisionary, however there is no transparency around the level of revision between quarters. Also, Domain do not appear to release their index results in a freely available format online.

The stratified median approach is a substantial improvement over the simple median for measuring price change across the housing market. As outlined in the simple median method, despite attempts to control for bias, the stratified median approach can be affected by changes in buyer activity or inactivity and by changes in the types or quality of dwellings that are transacting in the market.

It is important to note that non revising stratified median indices will not include off the plan sales data if the sale date has occurred more than three months prior to the reporting date. The reason for this is that such data tend to be quite lagged and reported by the Valuer General after settlement, which can occur several years after the sale date.

Repeat sales

A repeat sales index relies on identifying sales pairs and measuring the capital gain across these individual resales. The repeat sales method is very useful for measuring the demonstrated capital gain across individual properties that have resold, however the method excludes all transactions that don’t have a previous sale associated with the property. Inherently, the repeat sales method excludes new properties, which is a significant weakness at a time when a record amount of new housing stock is entering the market place. Additionally, the repeat sales index can be biased by property resales that have been affected by capital works (eg renovations and subdivisions) and can also be biased by properties that are transacted more frequently such as units and investment owned properties which generally have a higher turnover rate.

Residex (which is a CoreLogic owned company) publish a repeat sales index which is revisionary and released quarterly.

Off the plan sales are not accounted for in repeat sales indices as this methodology requires at least two sales for a property to make it eligible for inclusion.

Hedonic regression

The hedonic method of measuring housing market performance aims to track the true value shifts across the overall portfolio of housing, rather than price based movements based on observations of only those properties that have transacted. The hedonic imputation technique, which is used exclusively in Australia by CoreLogic, imputes the value of every Australian dwelling each day, taking into consideration every single data point we knew about the housing market at the point in time of calculation. Factors such as lot size, the number of bedrooms and bathrooms, car spaces and whether the home has a swimming pool or view are some of the hedonic attributes factored into the analysis. Based on a flow of around 1,400 new transactions received each day as well as a constant flow of new attribute data, our most accurate view of the imputed value of the property market is updated each day.

The benefits of a hedonic regression index include the sheer timeliness of the reading (virtually a real time indicator), the lack of any bias that can push the index higher or lower, as well as the fact that the index tracks true value shifts across the entire housing asset class rather than only across those properties that have recently transacted.

CoreLogic provides free public access to a full 12 month back series of the daily hedonic index, as well as a monthly summary of the end of month index results across each capital city by dwelling type. The index is published on the first working day of each month and has been independently peer reviewed and audited, the results of which are published on the CoreLogic web site, along with full documentation of the hedonic method used to build the index.

In summary, there are a variety of measures available to track dwelling prices and values across Australia. Each method presents its own pros and cons and there will always be differences in the results based on the different methods being uitlised, but also based on the differences in data quality, cleaning and sampling techniques, data timeliness, geographic context and time frames of the calculation. Other technical differences will also play out in the data based on specific ways each method treat the underlying data sets. For example, using a settlement date rather than a contact date in the analysis will show a difference in results, particularly at a time when a great deal of off the plan unit sales are flowing into the market where the difference between the contact date and settlement date could be several years.

While there will be divergence in these measurements of price and value changes from period to period, over a longer period, each of the methods used will tend to show broadly similar results. One notable exception is the presence of off the plan transactions, which will cause the hedonic index to diverge from repeat sales and non-revising median indices from time to time. Repeat sales indices and non-revising median indices (in particular based on sales data over the prior quarter) are more likely to broadly track one another because they both exclude off the plan sales.

CoreLogic privately calculates all of the indices described above, however our primary reference for measuring the change in house and unit values is the hedonic regression index thanks to the timeliness of the measure, the absence of any bias in the measurement and the fact that the index measures value growth across the entire housing portfolio rather than only those properties that have transacted.

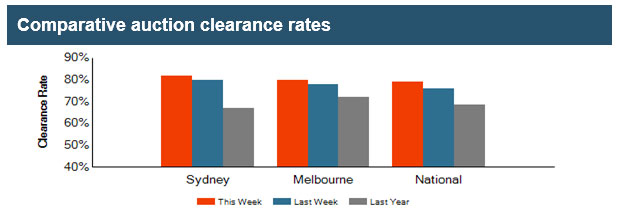
In order to get a complete understanding of the housing market there is a vast array of other housing market measures that need to be viewed in context with indices that measure price and value movements.  CoreLogic also provides weekly updates on auction markets and clearance rates, private treaty metrics such as average selling time and vendor discounting rates, transaction numbers, listing counts and rental information as some examples.

Additionally the performance of the housing market will vary substantially across the different product types and geographically, so it’s important to analyse the housing market at more granular levels than just capital city dwelling performance.

At CoreLogic, we place the utmost importance on our data and analytics assets.  We dedicate more than $20 million each year in acquiring and maintaining our data sets.  Our collection, analysis and research methods are audited regularly, and we are independent of any real estate, media or banking interests.  CoreLogic continues to grow with over 480 people employed in ten locations in Australia and New Zealand. Over 20,000 customers and 150,000 end users in property, finance and government use CoreLogic services and platform more than 30,000 times a day.

Contagion In A Finance-Connected World

Interesting speech from Kristin Forbes, External MPC Member, Bank of England “Global economic tsunamis: Coincidence, common shocks or contagion?

She explores why countries are sometimes highly vulnerable to major events that occur outside their borders, while at other times seem fairly immune. Why do some negative events turn into global tsunamis – while others are just local ripples? Here are some extracts. The full analysis however is worth reading. It highlights the significance of markets that are more globally linked than ever before.

Consider 2 major periods of stress in the global economy: the Asian Crisis (1997-98) and the Global Financial Crisis (2008-2009).

stress-boe

Figure 3 shows equity indices during these events for the region/country where the stress originated (in red), plus other major country groups. The Asian Crisis corresponded to sharp falls in equity indices for the Asian economies under stress (not surprisingly). These falls were mirrored (albeit to a lesser extent) in the advanced economies outside the euro area, but seemed to have minimal effect on other emerging markets. The euro area seemed immune to the Asian wave, with sharply higher – instead of lower – returns. In contrast, the Global Financial Crisis sharply affected equity indices not only in the US, but in all country groups. The equity indices for all groups are basically on top of each other for almost a year from June 2008; the Global Financial Crisis is aptly named and was clearly a global tsunami.

boe-stress-3

Did these disparate spillovers in equity markets correspond to similar patterns for what people in these countries care about most – real incomes and growth? Figure 4 shows GDP growth to answer this question. The Global Financial Crisis continues to merit its name – corresponding to precipitous and simultaneous declines in growth in each region, followed by simultaneous rebounds. Patterns during the Asian Crisis, however, are quite different than for equity markets. GDP growth in the advanced economies is stronger and more stable than implied by the falls in this group’s equities. GDP growth in the other emerging markets is more negatively affected than implied by the relative stability in their equity markets. And growth in the euro area is middle of the pack – showing none of the outperformance suggested by the region’s strong equity returns.

This lecture attempts to better understand these different patterns of global spillovers – especially during periods of economic stress. It addresses a number of questions. Why do economic tremors in one country sometimes evolve into devastating tsunamis in others – and sometimes fade into small ripples? When do international spillovers in financial markets also harm incomes and economic growth? How have these relationships evolved over time? And perhaps most important, how can countries create ‘tidal breaks’ against these powerful waves originating outside their borders?

The results have important implications for investors. I’ll show you that equity markets around the world move together much more closely now than in the past. This makes it more difficult for investors to diversify their portfolios and to generate returns through ‘alpha’ (differentiating oneself from average market movements). I will also provide some insights on why this has been happening and what to watch to predict when these patterns change. A common, global factor has been playing a more important role in causing markets to move together. This is affected by changes in global risk sentiment, commodity prices, and changes in US monetary policy, with events in China recently playing a more important role. Particularly striking, equity markets around the world seem to all respond in more similar ways than in the past to these global factors. It is as if they are all now sailing in the same type of boat.

This analysis also has important implications for policymakers. Policymakers are continually concerned that negative shocks originating abroad will spread to their own shores. This analysis helps understand when this concern is more likely to become a reality – and exactly what to be concerned about. It shows that sharp reactions in financial markets should be put into context. These movements certainly matter – but the international spillovers to growth and incomes tend to be much smaller than in financial markets. For policymakers concerned about supporting and stabilizing domestic incomes in the face of these external waves, this is good news. The waves emanating from abroad in financial markets can be imposing – and do have important domestic effects – but these effects on the real economy are usually more muted.

Finally, and perhaps most important, although policymakers can usually do little to stop the events that generate waves abroad, they should not despair. Certain policies can make a country more resilient. Steps such as reducing leverage and strengthening banking systems can mitigate the effects of dangerous international waves.

She concludes: There are some periods and regions where GDP growth rates do move more in sync, however, such as during the Global Financial Crisis and today in the euro area. Moreover, movements in financial markets will have important effects on incomes and growth over time, especially if they persist. When do countries become more synchronized? The analysis here suggests that common shocks play an important role, especially changes in global risk measures, global commodity prices, US monetary policy, and more recently changes in China’s economic outlook. Contagion (when the bad news originates in a specific country or countries) has also played a role, but has been less important than global events in driving the increased synchronization in equity markets over time. Perhaps most important, countries worried about the effects of these common shocks and contagion need not despair. Steps such as reducing bank leverage and strengthening financial systems appear to be powerful in terms of increasing their resilience to these adverse winds blowing from abroad.

Mortgage Refinance Momentum Remains Strong

Continuing our examination of the latest household survey results, today we look at the refinance segment. This sector of the market is poorly understood, not least because refinance of investment loans are not separately reported in the official statistics.  However, yesterday we got some insights from the new RBA Governor’s handout pack.

It shows that currently more than 30% of all home loan approvals are for refinancing (and this data includes estimates of investor refinancing). This is an all time high.

Graph 12: Refinancing Approvals

Actually, the average term for a home loan is dropping, to below 4 years, and a quarter of the book is churning each year. Here is the reason.

Graph 11: Variable Housing Interest Rates

New loans are being deeply discounted, (compared with rates being paid by loan holders). The RBA says:

The spread between the benchmark SVRs and the lowest available advertised rates has increased in recent years. The difference reflects both advertised and unadvertised discounts. It is not unusual for the discounts to be up to 1½ percentage points. Changes in discounts only affect new borrowers (and not the existing stock of mortgages).

This discounting is supported by lower funding costs.

Graph 13: Cash Rate and Funding Costs

As a result, bank net interest margins are largely unchanged.

Graph 1: Net Interest Margin

The gap is being closed by lower deposit interest rates (other than for long-dated term deposits which the RBA says accounts for about 2% of bank funding only).

So against this backcloth, the 1.3 million households in the refinance segment are seeking to refinance, driven by the desire to reduce monthly payments (38%), better rates (18%) or to lock in an attractive fixed rate (17%). Poor service only accounts for a small proportion of the transactions.

survey-sep-2016-refinanceIf we analyse the drivers by loan size, we see that brokers are tending to be more proactive when the loan is larger, and here refinance is more about releasing cash than just a lower rate. Indeed, much of this cash release is going back into the investment property sector, as we discussed yesterday.

survey-sep-2016-refinance-driversOverall, households with loans in the $250-500k band are most likely to refinance.

survey-sep-2016-re-sizeLarger loans are more likely to be refinanced to an interest only loan.

survey-sep-2016-ref-rtpe So refinancing activity is supporting market momentum. Though total dwelling transfers are down, as shown by the ABS data, released this week, remember that a refinanced transaction would not necessarily be counted.

This chart, using ABS data, shows the total transfers of all dwellings (houses and other) and we see a fall in total transfers from Sept 2015, a peak of more than 120,000 to below 100,000 per quarter. Mapping the main centres, and smoothing the data a little, we see that Brisbane fell 10%, Melbourne 9% and Sydney 6%. So beware using this data to argue that housing momentum is easing, it is not that simple. The latest data may also be revised later by the ABS.

transfers-sep-2016So, refinancing is an important element in understanding the current dynamic, and there are more households in the market now for a refinanced deal than a year ago. This explains the adverts “has your home loan got a 3 in front of it?” as shown below….

ybr-advert

Population On The Rise – Melbourne To Become Largest City

The ABS released their latest population data today, based on March 2016.  Sustained population and household growth is expected, which will support property values for some time to come. We have more than 9.2 million households and recent growth has been supported by net migration.

Total population is north of 24 million and overall Australia’s population grew by 327,600 people (1.4 per cent). Of this, net overseas migration added 180,800 people to the population (2 per cent higher than the previous year), and accounted for 55 per cent of Australia’s total population growth.

Natural increase contributed 146,800 additional people to Australia’s population, made up of 304,300 births (1.6 per cent lower than the previous year) and 157,500 deaths (1.7 per cent higher).

Over the year, net overseas migration was the major contributor to population change in New South Wales, Victoria, South Australia and Tasmania, whilst natural increase was the major contributor in all other states and territories.

pop-by-stateVictoria’s population has hit 6 million growing by 1.9 per cent, adding an extra 114,900 people to the population. This is the fastest population growth for Victoria since 2009 and is well above Australia’s growth rate of 1.4 per cent. New South Wales was the next fastest state, increasing by 1.4 per cent. Queensland and the Australian Capital Territory were not far behind, with both growing at 1.3 per cent.

Net overseas migration was the main contributor to growth in Victoria, adding 62,800 people to the population over the year ending March 2016. The remainder of Victoria’s population change was explained by natural increase (+37,600) and net interstate migration (+14,500).

The Victorian population is projected to reach 7 million in 2024 and the forward projections to 2036 show more households in Greater Melbourne than Greater Sydney.

pop-by-state-2036-citiesOverall household  estimates for 2036 show a population of more than 12 million households, up from 9.2 million in March 2016.

pop-by-state-states-2036Of course these long range estimates are indications only, but it would appear demand for property will be sustained – another reason why it is unlikely we will see a major property correction anytime soon.