The Top Digital Suburbs In The Sydney Region

Where do most digitally active households reside? This is becoming an increasingly important question, as mobile penetration and use climbs. It fundamentally changes the optimal marketing approach and channel strategy.

Using data from our household surveys we track the proportion of households with a preference for using digital devices – especially smartphones – for their banking interactions and other online activities. The latest data, which will flow in due course to our next edition of the Quiet Revolution – our channel analysis report – shows that there are large numbers of digitally savvy consumers and small businesses who want more digital, and less branch. They want a “mobile first” offering.

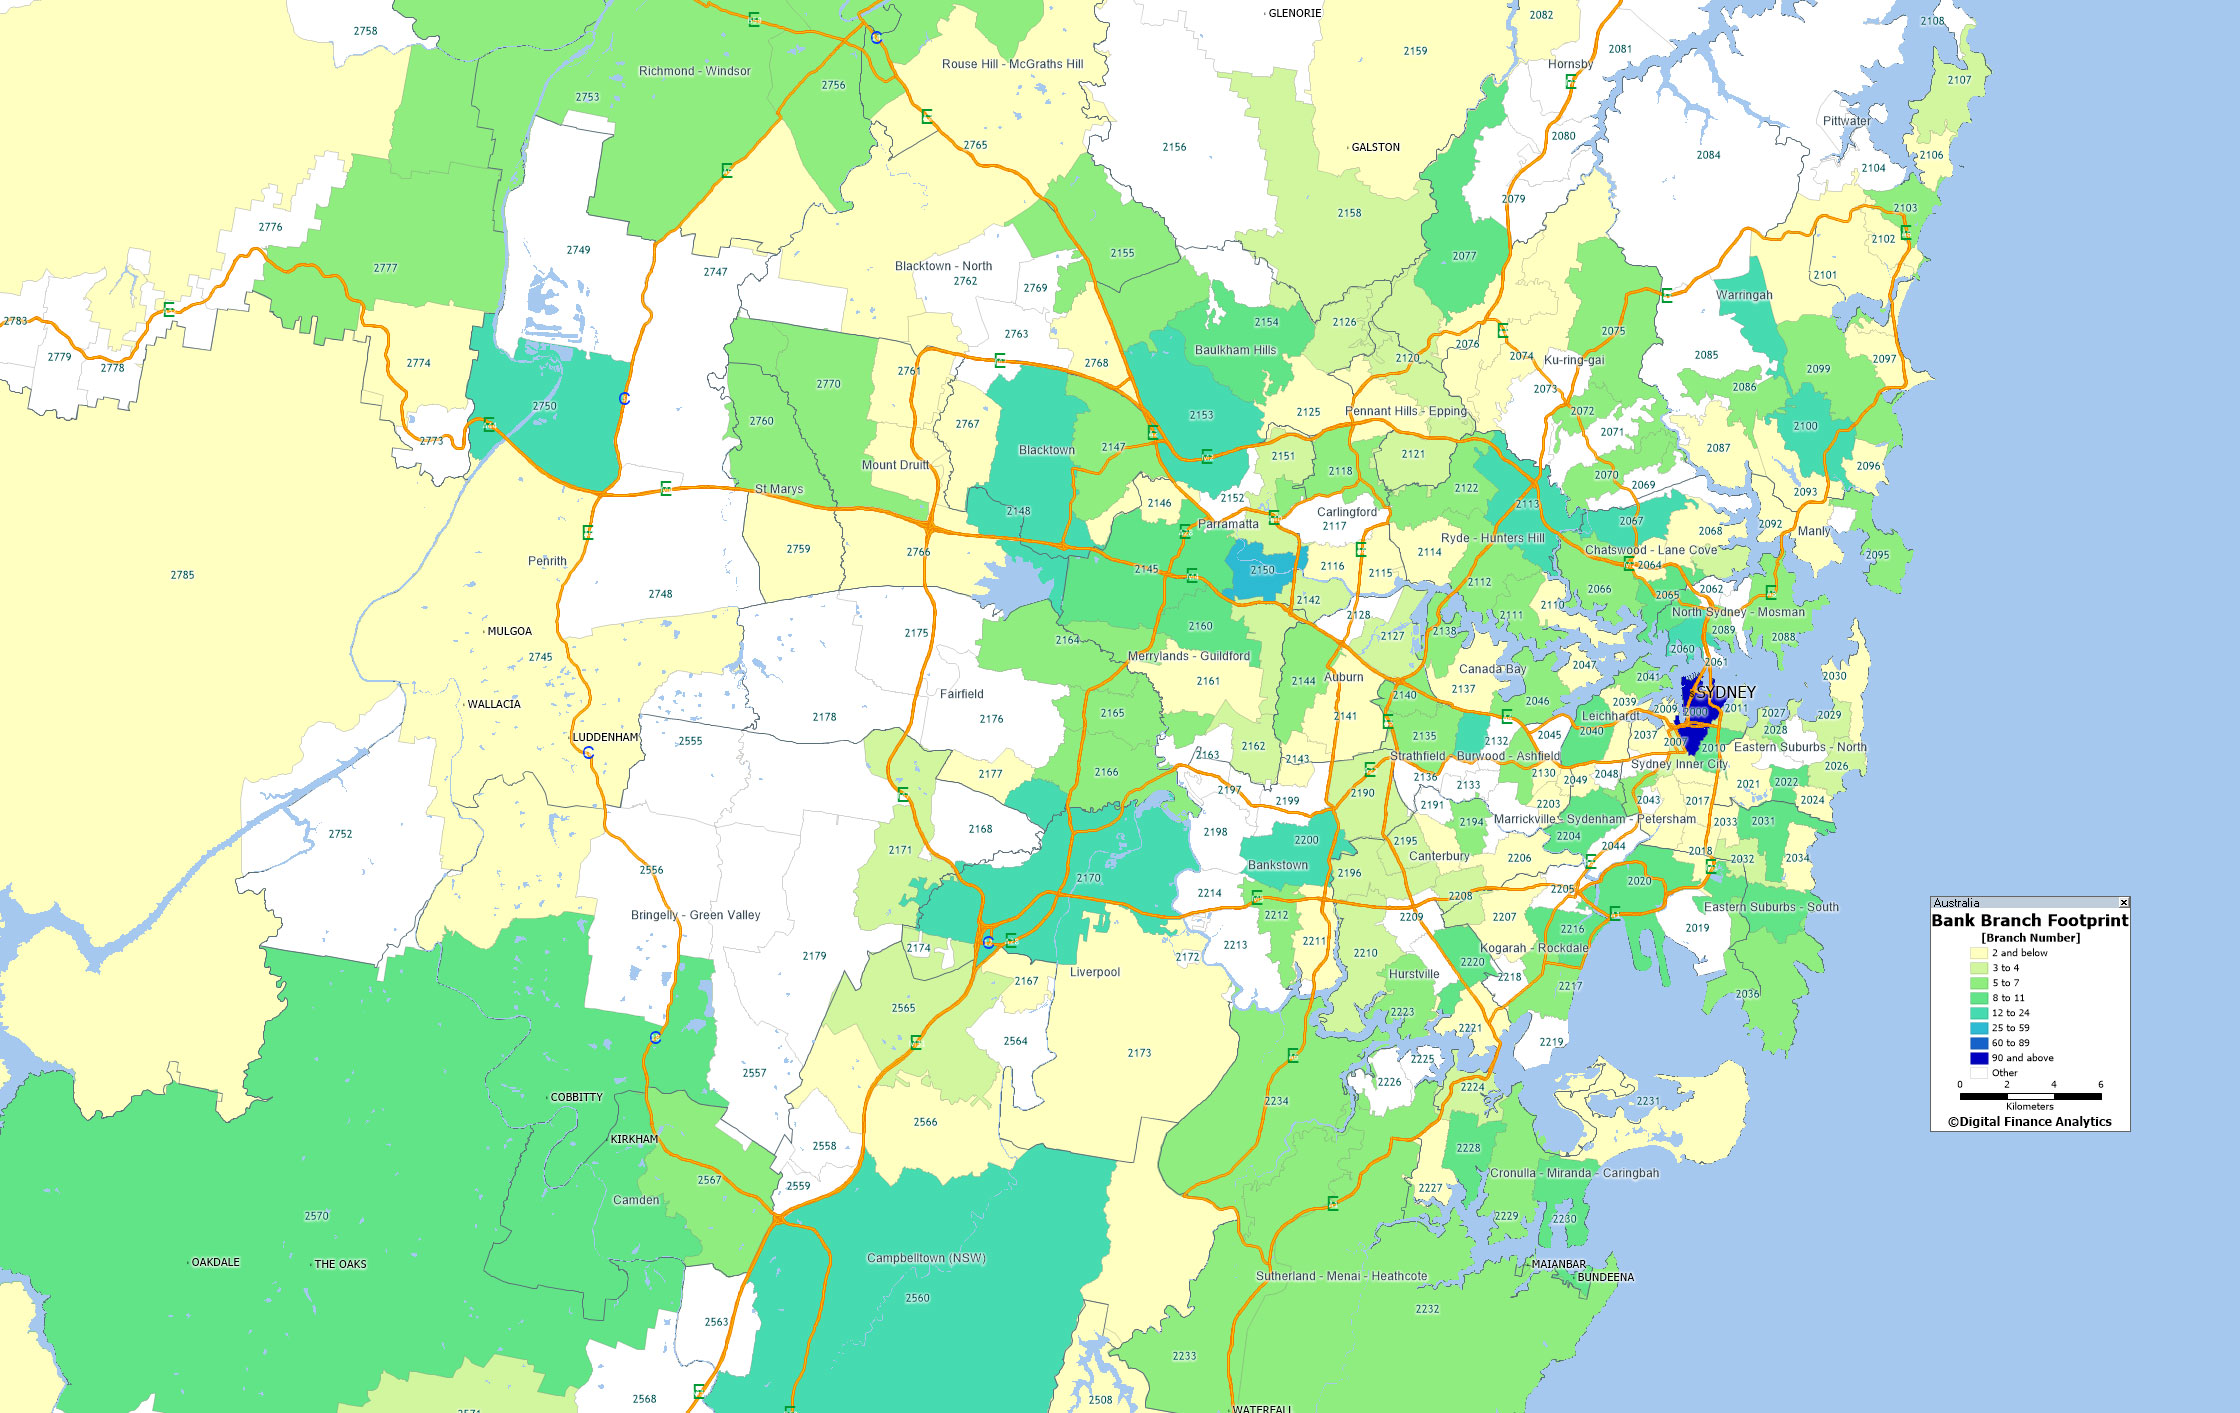
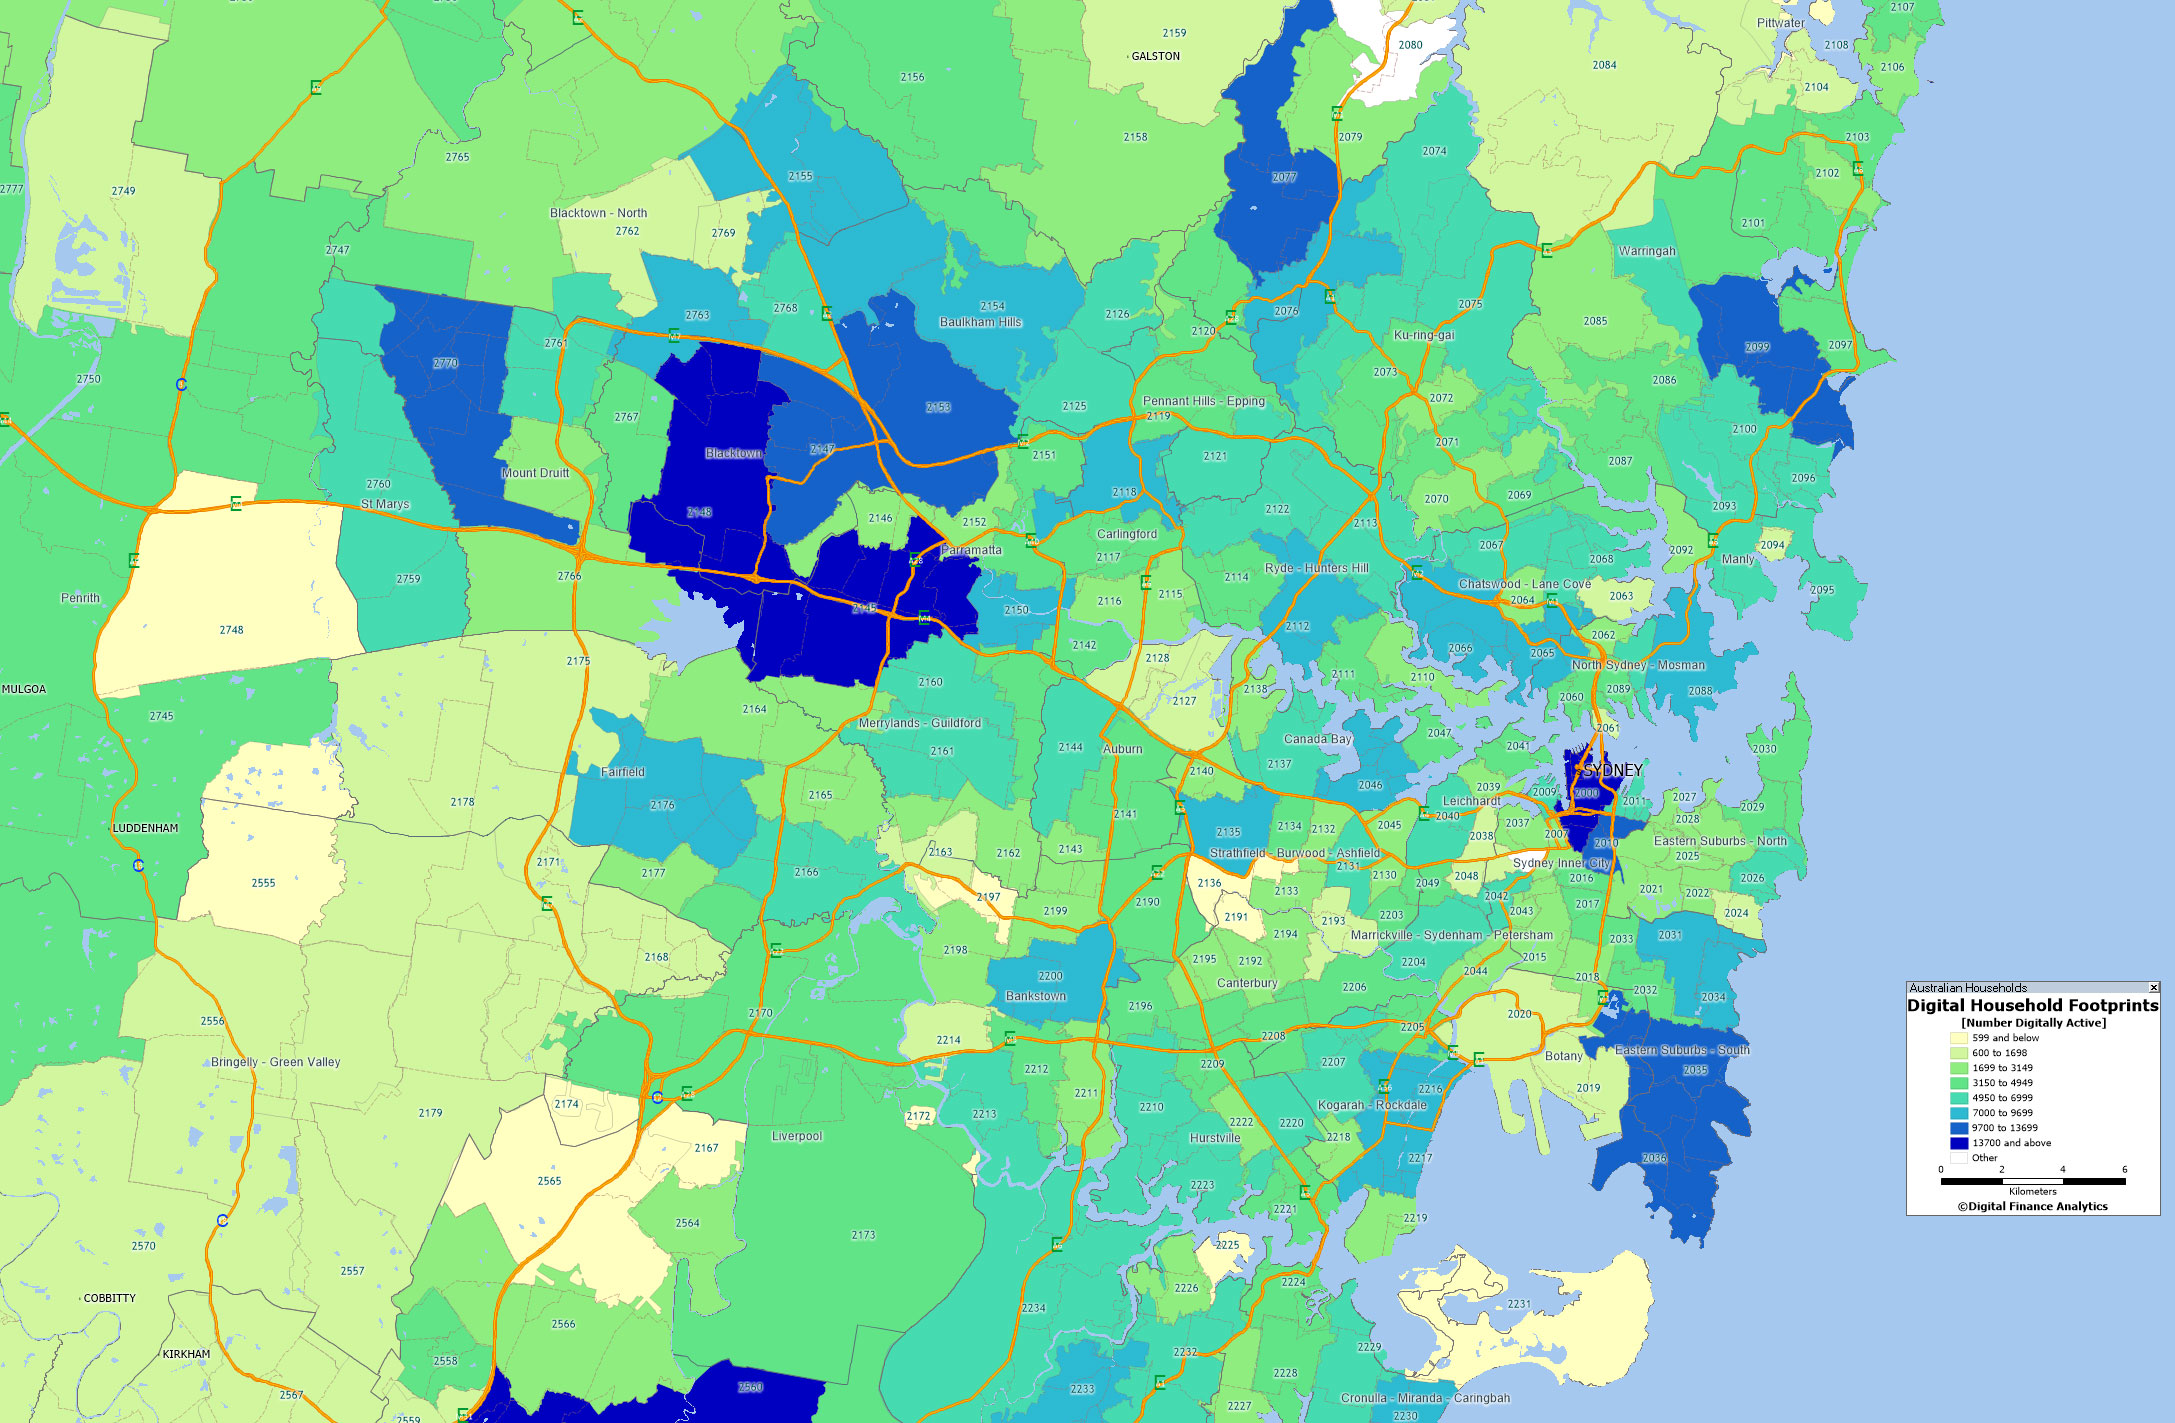
To illustrate this we have mapped the number of households by digital segments – identifying those seeking a mobile first solution – to postcodes. Then we also map the current branch representation, based on the latest APRA points of Presence report. There is a striking mismatch between the two.

Lets take the Sydney area as an example.  Below is the branch representation, with the largest number of branches in the Sydney CBD, and a smattering across the region.

Branch-Footprint-SydneyNow looking at the representation of mobile first households, we see a very large number in Sydney CBD, as well as hot spots across the Sydney basin.

Digital-Footprint-SydneyHere is the top 10 listing by number of digitally aligned – mobile first – households in NSW. They vary by segment, age, zone and region.

Dig-Table-Sydney
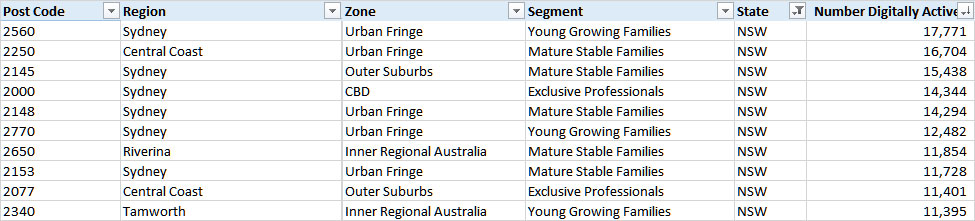
This information is useful to anyone wishing to engage with these households because it highlights where the centre of gravity for online initiatives should be focussed. The point is that although households are in the digital world, they still have a geographic centre. Digital still has a geographic sense.

Looking at the banks, it seems that they are not heeding the geographic concentration of mobile first households, and nor are they fully comprehending the changes afoot. We think it likely there will be significant stranded costs in the branch network, and insufficient focus on “mobile first”banking offerings.

Households are leading the way.

Next time we will look at the state of play in Brisbane and subsequently explore developments in other regions, before revealing the top ten digital suburbs in Australia.


CommSec pays $700,000 in infringement notice penalties and refunds $1.1 million in brokerage

ASIC says Commonwealth Securities Limited (“CommSec”) has paid a total penalty of $700,000 to comply with two infringement notices given to it by the Markets Disciplinary Panel (“MDP”), and has voluntarily refunded $1.1 million in brokerage to more than 25,000 clients.

Complaint-TTy

Confirmations: disclosure of crossings and trading as principal

The MDP had reasonable grounds to believe that CommSec contravened subsection 798H(1) of the Corporations Act by reason of contravening:

  • rules 3.2.3 and 3.4.1(3)(f) of the ASIC Market Integrity Rules (ASX Market) 2010; and
  • rule 3.4.1(3)(f) of the ASIC Market Integrity Rules (Chi-X Australia Market) 2011.

These rules relate to confirmations of transactions which require disclosures in relation to crossings and trading as principal.  A crossing occurs where a market participant acts for both the buyer and the seller in a transaction.

Failure to disclose crossings

Between 1 August 2010 and 13 February 2014, CommSec issued 114,841 confirmations to retail clients whose orders were executed as crossings but which did not contain the required statement that the transactions had involved a crossing, namely:

  1. between 1 August 2010 and 13 February 2014, in relation to trading on the ASX market, CommSec issued 6,579 confirmations which failed to include the required disclosure of crossings. This failure was caused by different fields being used by the systems of CommSec and another NZ-based financial services company to identify crossings for the purposes of marking confirmations;
  2. between 1 August 2011 and 9 October 2012, in relation to trading on the ASX market, CommSec issued 56,522 confirmations which failed to include the required disclosure of crossings. This failure was caused by the CommSec’s systems not being able to interpret all of the different condition codes relating to crossings;
  3. between 15 August 2011 and 9 October 2012, in relation to trading on the ASX market, CommSec issued 46,231 confirmations which failed to include the required disclosure of crossings. This failure was caused by a configuration flag within CommSec’s settlement system not being turned on;
  4. between 17 October 2011 and 18 December 2013, in relation to trading on the ASX market, CommSec issued 1,768 confirmations which failed to include the required disclosure of crossings. This failure was caused by a system platform change for the settlement of options market contracts, which contained an incorrect data field, as a result of which it was unable to correctly identify that a crossing had taken place; and
  5. between 15 March 2012 and 26 April 2013, in relation to trading on the Chi-X market, CommSec issued 3,741 confirmations which failed to include the required disclosure of crossings. This failure was caused by CommSec’s retail and institutional participant identifier numbers being treated as two separate participants by Chi-X’s systems.

Failure to disclose trading as principal

Between 16 May 2011 to 13 February 2014, CommSec issued 50,484 confirmations to retail clients in relation to which CommSec had entered into transactions as principal but which did not contain the required statement that CommSec entered into the transactions as principal and not as agent, namely:

  1. between 16 May 2011 and 13 February 2014, in relation to trading on the ASX market, CommSec issued 3,949 confirmations which failed to state that CommSec entered into the transactions as principal. This failure was caused by different fields being used by the systems of CommSec and another NZ-based financial services company to identify principal trading for the purposes of marking confirmations;
  2. between 15 August 2011 and 9 October 2012, in relation to trading on the ASX market, CommSec issued 46,231 confirmations which failed to state that CommSec entered into the transactions as principal. This failure was caused by a configuration flag within CommSec’s settlement system not being turned on; and
  3. between 26 February 2013 and 6 March 2013, in relation to trading on the ASX market, CommSec issued 304 confirmations which failed to state that CommSec entered into the transactions as principal. This failure was caused by the introduction of new operator references in CommSec’s system which did not contain the phrase typically used by CommSec to indicate when a related entity was the originator of the orders.

The MDP specified a penalty of $400,000 for the alleged contraventions.

CommSec voluntarily refunded approximately $1.1 million in brokerage to more than 25,000 clients, and notified 48,205 clients of the lack of disclosure and to provide corrective disclosure.

CommSec also co-operated with ASIC throughout its investigation and did not dispute any material facts.

Download the infringement notice

The compliance with the infringement notice is not an admission of guilt or liability, and CommSec is not taken to have contravened subsection 798H(1) of the Corporations Act.

Verification of identity of selling shareholders

The MDP had reasonable grounds to believe that CommSec contravened subsection 798H(1) of the Corporations Act by reason of contravening rule 5.5.2 of the ASIC Market Integrity Rules (ASX Market) 2010. This rule requires a trading participant to maintain the necessary organisational and technical resources to ensure that, among other things, trading messages submitted by the participant do not interfere with the efficiency and integrity of the market.

The MDP has reasonable grounds to believe that, between 2 August 2010 to 14 April 2013, CommSec did not have in place adequate organisational and technical procedures or controls that verified the name and address on an issuer sponsored holding matched that of the client who provided the instructions prior to submitting the orders for the sale of the holdings.

The MDP specified a penalty of $300,000 for the alleged contravention.

Download the infringement notice

The compliance with the infringement notice is not an admission of guilt or liability, and CommSec is not taken to have contravened subsection 798H(1) of the Corporations Act.

Default Risk On The Up, Moody’s

Moody’s says that markets are now relatively sanguine about default risk, effectively concurring with the baseline forecast of Moody’s Default Study. However, compared to baseline default forecast, more can go wrong than right.

After rising from September 2014’s current cycle low of 1.6% to July 2016’s 5.5%, the baseline forecast sees the US high-yield default rate peaking in early 2017 at roughly 6.5%. Thereafter, the baseline prediction has the default rate receding to 4.9% by July 2017.

The baseline forecast is bordered by considerable downside risk. In addition to the baseline view, Moody’s Investors Service supplies optimistic and pessimistic projections for the default rate. The optimistic scenario projects a 5.3% average default rate for January-July 2017 that hardly differs from the 5.6% projected average of the baseline view. In stark contrast, January-July 2017’s 13.7% average expected default rate of the pessimistic scenario towers over the baseline forecast.

On balance, the default forecast suggests that the best days of the current credit cycle have passed. Even if the optimistic backdrop holds true, the default rate is likely to remain above-trend given the presence of an economic recovery. That is: The optimistic scenario predicts a range of default rates that exceeds both the average and median default rates of economic recoveries. Even if the optimistic view is correct, the default rate may still exceed its average, or trend, of an economic upturn.

Since the 1981-1982 recession, whenever the US lagging 12-month high-yield default rate either mostly or entirely overlapped an economic recovery, the default rate revealed a median of 3.4% and an average of 4.1%. By contrast, the default rate generated a median of 10.7% and an average of 9.6% whenever the yearlong observation period either mostly or entirely overlapped a recession.

Moodys-Sep02

Recessions joined three of the four prior climbs by the default rate to 6.5%. Following each of the three previous episodes showing a climb by the default rate up to 6.5%, the default rate continued its ascent. After first reaching 6.5% in February 2009, April 2000, and February 1990, the default rate eventually crested at 14.7% in November 2009, 11.1% in January 2002, and 12.4% in June 1991. Coincidentally, a recession overlapped each of the default rate’s last three peaks. In addition, the equity market suffered deep setbacks at some point during the 12 months prior to the peaking of the default rate.

Only once has an ascent by the default rate to 6.5% not been followed by a recession within 12 months. The lone exception occurred during the mid-1980s, or when the default rate first approached 6.5% in July 1986. Thereafter, the default rate formed a localized peak at the 7.0% of April 1987.

The 1986-1987 climb by the default rate was linked to a profound deceleration by the annual increase of corporate gross-value-added — a proxy for corporate net revenues — from 1984’s patently unsustainable 12.1% surge to the 3.8% of the year-ended March 1987. Partly because of a less pronounced slowing of employment costs to the 6.4% annual increase of the year-ended March 1987, operating profits went from soaring higher by 20.8% annually in 1984 to contracting by -9.1% annually for the 12-months-ended March 1987.

However, during the ensuing two years, corporate credit quality benefited from an 8.2% average annual advance by corporate gross-value-added that stoked an accompanying 14.9% average annual increase by operating profits.

Thus, the market’s current expectation of a limited rise and subsequent fall by the high-yield default rate implicitly assumes a major rejuvenation of net revenues. As derived from the US National Income Product Accounts (NIPA), corporate gross-value-added slowed from the 5.4% annual increase of the year-ended June 2015 to the 2.1% of the year-ended June 2016. Partly because the deceleration by net revenues was more pronounced than the comparably measured ebbing of employment cost growth from 5.4% to 4.7%, the annual percent change of operating profits switched direction from the 4.7% increase of the year-ended June 2015 to the -6.8% contraction of the year-ended June 2016.

AU$ Forex and Derivative Volumes Down

In April 2016, the Reserve Bank conducted a survey of activity in foreign exchange and over-the-counter (OTC) interest rate derivatives markets in Australia. Using data from the BIS and the RBA summary, here is a snapshot. This was part of a global survey of 52 countries, coordinated by the Bank for International Settlements (BIS). Similar surveys have been conducted every three years since 1986.

Globally, the Australian dollar remains the fifth most traded currency, although its share of turnover decreased by 1½ percentage points to around 7 per cent.

OTC-2016-FX2The AUD/USD remains the fourth most traded currency pair, having also accounted for a slightly decreased share of global turnover.

Activity in Australia’s foreign exchange market has moderated since the previous survey in April 2013. Total turnover fell by around 25 per cent, compared with a 5 per cent decrease in global turnover over the same period.

OTC-2016-FX3Nonetheless, the Australian foreign exchange market remains the eighth largest in the world.

OTC-2016-FX4Activity in Australian OTC interest rate derivatives markets declined markedly over the three-year period, primarily reflecting a decline in turnover of forward rate agreements.

OTC-2016-RD3The BIS data highlights the high volume of US$ Swaps, relative to other currencies. AUD is in fourth position.

OTC-2016-RD1The USA and UK dominate the derivative markets, with Australia in seventh position.

OTC-2016-RD2The preliminary results of the global turnover survey and links to other participating jurisdictions’ results are available from the BIS website. More detailed results for the Australian market are available on the 2016 BIS Triennial Survey Results – Australia page.

The BIS will also publish global data on outstanding OTC derivatives as at June 2016 in November.

The Reserve Bank will publish Australian data on outstanding OTC derivatives at that time.

The Timing of Labeling a Bank “Too Big to Fail” Matters

From the St. Louis Fed On The Economy Blog.

When banks that are considered “too big to fail” (TBTF) are on the verge of failure and are subsequently saved by the government, many argue that the government is bailing out stock and bond holders at taxpayer expense. However, exactly who gets bailed out may be unclear. An Economic Synopses essay argues that it depends on when the institution is labeled TBTF.

Balance-Pic

Director of Research Christopher Waller noted that current stock and bond holders of failing banks get bailed out if the institutions are unexpectedly declared TBTF at the moment they are about to default. This is because markets haven’t had time to incorporate the TBTF news into asset prices.

However, it’s when banks are considered TBTF prior to default that the issue of who gets bailed out becomes murkier. Waller quoted authors of a 2004 book Ron Feldman and Gary Stern about the problem: “‘The roots of the TBTF problem lie in creditors’ expectations … and the source of the problem is a lack of credibility’ that the government will let them fail.”1 Waller wrote: “It is exactly this timing that makes it difficult to determine who benefits from TBTF.”

A TBTF Announcement and Reaction

Waller gave an example of a bank (which he simply called bank A) that had been declared TBTF by the government. In response, the prices of the bank’s stocks and bonds would rise to reflect this new information. Subsequent offerings would also have higher prices, again due to the TBTF designation (and corresponding lack of default risk).

Investors who buy this bank’s stocks or bonds after the announcement, however, wouldn’t necessarily see a benefit. Waller noted that the TBTF status should be fully incorporated into asset prices, assuming financial markets are efficient. He wrote: “In short, new buyers are paying for the TBTF insurance via higher equity and bond prices. They do not receive a windfall from the TBTF status assigned to bank A.”

What If the Bank Is Allowed to Fail?

Waller also addressed what would happen if the bank was still allowed to fail after the TBTF designation was given. He wrote that initial bond and stock holders who sold after the announcement would not care, as they already received the insurance premium and would not be affected by the failure.

The current holders, however, would have paid a premium for the insurance, only to lose their investments anyway. Waller wrote: “Hence, it is not surprising that they would be upset by the government’s action. Who wouldn’t be upset after paying for insurance that didn’t pay off when it should have?”

Conclusion

Waller wrote: “To summarize, the value of being designated TBTF is capitalized into the price of a firm’s equities and its bonds. TBTF provides a windfall capital gain to shareholders and creditors at the time of the designation. But after that, new buyers of equities and debt are paying for that status. Consequently, determining who gets ‘bailed out’ when an institution is TBTF is a more complicated task than it appears.”

Notes and References

1 Feldman, Ron; and Stern, Gary. Too Big to Fail: The Hazards of Bank Bailouts. Washington, D.C.: Brookings Institution Press, 2004.

Cities will just be playgrounds for rich if poor keep being pushed to suburbs

From The Conversation.

Successive governments in Europe have impressive visions for the future of our cities. These reject the divisive urban model of earlier decades, where richer people moved to low-density, car-dependent suburbs, leaving inner cities predominantly to the poor.

In the sustainable cities of the future, the vision is to attract richer people back to city centres. This will reduce their need to travel and increase public transport use. Importantly, these movements are supposed to bring about more mixed communities of people from different walks of life, living alongside one another harmoniously.

To achieve this urban renaissance, the UK has, for example, been directing housing development towards brownfield sites in the core of cities, limiting greenfield development at the edge. It has also been among those pushing substantial investment through urban regeneration schemes in land preparation or infrastructure.

Sure enough, this has halted and in some cases reversed the population losses which core cities have experienced for decades as richer people have been attracted back to the centres. Yet poorer people are being pushed out; poverty is “suburbanising”. We have seen this pattern in the US and more recently in England, particularly London.

Scotland’s four largest cities are also experiencing this trend, as new data confirms. In Glasgow, Edinburgh, Aberdeen and Dundee, the share of each city’s population living near the centre either stayed the same or rose between 2004 and 2016. At the same time, the proportion of poorer people has been falling (see graphs below).

Income-deprived population living in central city (%)

Non-deprived population living in central city (%)

The central area of Edinburgh has seen a loss of approximately 4,000 people in low income households over the period. In Glasgow, Scotland’s biggest city, where this trend has been identified before, the figure is approximately 6,000. For the smaller cities of Aberdeen and Dundee, the losses were around 400 and 700 respectively.

Segregation

What is driving this change? As city living has become more popular, poorer households are finding it harder to compete for housing. Social housing stock has fallen for decades, meaning those in poverty are having to rely more on renting privately. When cities attract wealthier people, landlords can charge rents that poorer people struggle to afford.

Meanwhile, recent welfare reforms have successively cut the housing benefits that subsidise rent payments for those on low incomes – at the same time as inequality levels have been rising more generally. The net result is that these people are pushed towards cheaper areas, away from the more central neighbourhoods.

Edinburgh’s Royal Mile. Andy Ramdin, CC BY-SA

As in other countries, this suburbanisation of Scottish poverty looks to be a steady but largely hidden process. If it continues, the cities of the future will be far from the visions set out by policymakers and planners.

Instead, they will continue to be marked by segregation and deep division, only now with poorer households pushed to the edge. That has potentially serious implications for these people’s welfare, particularly their ability to access employment. It also threatens broader social cohesion. If politicians are serious about their visions for the future, it is time we recognised these trends and started talking about how to halt them.

Author: Nick Bailey, Professor of Urban Studies, University of Glasgow;
Jonathan Minton, Quantitative Research Associate, University of Glasgow

Bank Profits Down 27%, Provisions Up To June 2016 – APRA

APRA has released the quarterly ADI performance statistics. On a consolidated group basis, there were 156 ADIs operating in Australia as at 30 June 2016, the same as a year before, despite some changes.

Here is a summary chart for the combined four majors to June 2016.

APRA-Majors-June-2016We see a rise in gross advances, and higher tier 1 capital, though CET1 fell a little. Shareholder capital relative to the lending book rose slightly, but at 5.45% in June, the big banks remain highly leveraged businesses.

Looking more broadly across all ADI’s, the net profit after tax was $27.7 billion to 30 June 2016. This is a decrease of $10.4 billion (27.3 per cent) on the year ending 30 June 2015.

The cost-to-income ratio for all ADIs was 50.7 per cent for the year ending 30 June 2016, compared to 47.4 per cent for the year ending 30 June 2015 while the return on equity for all ADIs was 10.3 per cent for the year ending 30 June 2016, compared to 15.2 per cent for the year ending 30 June 2015.

The total assets for all ADIs was $4.64 trillion at 30 June 2016. This is an increase of $225.3 billion (5.1 per cent) on 30 June 2015. The total gross loans and advances for all ADIs was $2.98 trillion as at 30 June 2016. This is an increase of $139.0 billion (4.9 per cent) on 30 June 2015.

The total capital ratio for all ADIs was 14.1 per cent at 30 June 2016, an increase from 13.1 per cent on 30 June 2015. The common equity tier 1 ratio for all ADIs was 10.2 per cent at 30 June 2016, an increase from 9.5 per cent on 30 June 2015.

The risk-weighted assets (RWA) for all ADIs was $1.84 trillion at 30 June 2016, an increase of $31.1 billion (1.7 per cent) on 30 June 2015. Impaired facilities were $15.0 billion as at 30 June 2016. This is an increase of $0.6 billion (4.2 per cent) on 30 June 2015.

Past due items were $13.0 billion as at 30 June 2016. This is an increase of $0.7 billion (6.0 per cent) on 30 June 2015; Impaired facilities and past due items as a proportion of gross loans and advances was 0.94 per cent at 30 June 2016, unchanged from 0.94 per cent at 30 June 2015; Specific provisions were $7.1 billion at 30 June 2016. This is an increase of $0.6 billion (8.6 per cent) on 30 June 2015; and Specific provisions as a proportion of gross loans and advances was 0.24 per cent at 30 June 2016, an increase from 0.23 per cent at 30 June 2015.

Retail Turnover Unchanged In July

Australian retail turnover was relatively unchanged (0.0 per cent) in July 2016, seasonally adjusted, according to the latest Australian Bureau of Statistics (ABS) Retail Trade figures. This follows a rise of 0.1 per cent in June 2016.

The trend estimate rose 0.1 per cent in July 2016 following a 0.1 per cent rise in June 2016. Compared to July 2015 the trend estimate rose 2.7 per cent.

Retail-Trend-Jul-2016

In seasonally adjusted terms, there were rises in food retailing (0.7 per cent), cafes, restaurants and takeaway food services (1.2 per cent), other retailing (0.2 per cent) and clothing, footwear and personal accessory retailing (0.3 per cent). There were falls in department stores (-6.2 per cent) and household goods retailing (-0.7 per cent) in July 2016.

In seasonally adjusted terms, there were rises in Queensland (0.5 per cent), South Australia (0.5 per cent), Western Australia (0.3 per cent), the Australian Capital Territory (1.2 per cent), Tasmania (0.5 per cent) and the Northern Territory (0.4 per cent). There were falls in Victoria (-0.6 per cent) and New South Wales (-0.2 per cent).

Online retail turnover contributed 3.1 per cent to total retail turnover in original terms. Compared to July 2015, online retail rose 4.1 per cent.

Ban on excessive surcharging by large businesses starts today

The Australian Competition and Consumer Commission is reminding large businesses of a new ban on charging consumers excessive payment surcharges, which commences today.

What makes a large business? Gross revenue of 25 million dollars or more, Gross assets worth 12.5 million or more, Number of employees 50 or more. For the ban on excessive surcharging, large business is defined as having two of the above.


“The new law limits the amount a large business can charge customers for use of payment methods such as most credit and debit cards. Businesses can only pass on the permitted costs of the payment method such as bank fees and terminal costs,” ACCC Chairman Rod Sims said.

“The new law has caused many large businesses to review their pricing practices. We expect to see a move from flat-fee surcharges for purchasing items like flights, towards percentage-based or capped surcharges. The ACCC is aware that some event ticketing companies are intending to change their pricing practices from 1 September such that consumers will no longer be charged fees based on the payment method chosen.”

The RBA has indicated, as a guide, that the costs to merchants of accepting payments by debit cards is in the order of 0.5%, by credit card is 1-1.5%, and for American Express cards it is 2-3%. Some merchants’ costs might be higher than these indicative figures.

For the first year the law only applies to large businesses, defined as having two of the following: gross revenue of $25 million or more, gross assets worth $12.5 million or more, or with 50 or more employees. It will apply to all businesses from 1 September 2017.

The ACCC has been raising awareness of the ban in the lead up to 1 September, including engaging with many large businesses to ensure they are aware of their obligations.

Consumers who believe they have been charged an excessive surcharge can contact the ACCC via our website.

“We will be enforcing these new rules from today, and the ACCC encourages all large businesses that haven’t already to ensure their payment charging methods are in line with the new law,” Mr Sims said.

It is important to note that businesses can still charge other fees, such as ‘booking fees’ or ‘service fees’ which apply regardless of the method of payment.  In doing so, those businesses must still comply with the Australian Consumer Law in terms of ensuring the disclosure of any such fees is upfront and clear.

Passing on the cost of processing debit and credit card payments is not mandatory for businesses. Indeed, the ban has no effect on businesses that choose not to impose a payment surcharge.

The ACCC has published online guidance material for consumers and businesses.

Fintech’s Attack All Banking Client Segments

Whilst most Fintechs are attacking the retail banking value chain, where the share of global revenue is highest, all segments are under attack according to a report published by McKinsey “The value in digitally transforming” credit risk management“. This chart which shows the footprint of Fintechs relative estimated share of bank revenue and client segments.

MCK-Fintech-Map

Whilst it may not be fully representative for any one segment or product, the chart is based on McKinsey’s financial-technology database which includes >350 of the best-known start-ups. “Commercial” includes small and medium-size enterprises, “large corporates” includes large corporations, public entities, and nonbanking financial institutions. The “financial assests and capital markets” includes investment banking, sales and trading, securities services, retail investment, noncurrent-account deposits, and asset-management factory.

The new competitors are beginning to threaten incumbents’ revenues and their cost models. Without the traditional burden
of banking operations, branch networks, and legacy IT systems, fintech companies can operate at much lower cost-to-income ratios—below 40 percent.