Savers And “Lower For Longer”

The ultra-low interest rates are hitting savers hard. Stephen S. Poloz, Governor, Bank of Canada spoke on this in his speech “Living with Lower for Longer“.  He says that low rates do hit savers, at a time when life expectancy has risen, and the only silver lining is that asset prices are inflated by the same low rates; cold comfort indeed.

Audit-Pic

One group that has certainly been affected by lower for longer is savers, particularly seniors who planned to finance their retirement with interest income generated by a life of working hard to build savings. I have heard from many Canadians who are rightly worried about their ability to live off their savings and who are seeking a return to higher interest rates.

I certainly can sympathize and understand these concerns. Demographic and economic changes, along with the low interest rates that followed the financial crisis, have upended the calculations that many Canadians made in planning for retirement. That is not their fault.

But at the heart of this discussion is the level of the real rate of interest. Having higher nominal interest rates because of higher inflation would not help savers, because higher inflation would just erode the future purchasing power of those savings. Maintaining a low-inflation environment is the Bank’s primary goal. We do this because we’ve seen that it is the best way to help bring about solid, sustainable economic growth. That growth benefits everyone, from business owners looking to expand, to workers looking for employment, to savers looking to protect their savings and find investment opportunities.

In our most recent Monetary Policy Report, in July, we said that our current policy rate setting of 0.5 per cent was consistent with the economy returning to full capacity toward the end of 2017 and inflation returning sustainably to its target. We’ll update our forecast next month, but in our decision on September 7, we indicated that the risks to our projected inflation profile have tilted somewhat to the downside following recent data on investment in both the United States and Canada, and the recent data on our exports. It is quite evident that our economy is still facing strong headwinds, and we need stimulative monetary policy to counteract them and move us closer to full capacity. We also need to watch the full effects of the government’s fiscal stimulus unfold.

However, the decline in the real neutral rate means that any given setting of our policy rate will be less stimulative today than it was a decade or two ago. The current policy rate, while certainly providing monetary stimulus, is not as stimulative as it would have been before the crisis.

By the same token, an immediate rise in our policy rate back to, for example, the 4.25 per cent that prevailed before the financial crisis would represent an extreme tightening of policy and would have significant consequences. This is just another way of saying that low interest rates are actually having big effects today, but the headwinds pushing back on that stimulus remain quite powerful.

For some savers, ultra-low interest rates do have positive effects. In particular, the value of most assets rises when interest rates decline, supporting gains in household wealth. This effect may not be as obvious as the impact of low rates on savings. But lower interest rates generally mean higher stock and bond prices, as well as increases in the value of real estate, which has been another important source of wealth for many savers, particularly seniors.

I realize this may be cold comfort to those people who have to adjust retirement plans to a lower-for-longer world. But the difficult reality is that savers must adjust their plans. That may mean some combination of putting aside more funds, working a little longer than planned or changing the mix of investments. There are no easy answers, particularly for some who have already retired.

Compounding the challenge is the fact that people are now living longer—life expectancy has risen by about 6 years since the early 1980s. I hope you will agree that this is unambiguously good news. But combining longer life expectancy with low interest rates means that a person starting to save today would have to set aside much more to generate the same retirement income as a person who began saving 25 years ago, if both wished to retire at the same age.


The Mobile Payment Business To Consumer Gulf

PayPal Australia have just released their first report on mobile payments in Australia, and highlight there is a significant gap between consumer willingness to use mobile payments, compared with business capability to receive them. Once again, in the digital disruption stakes, consumers are ahead of the curve!

MobilePay

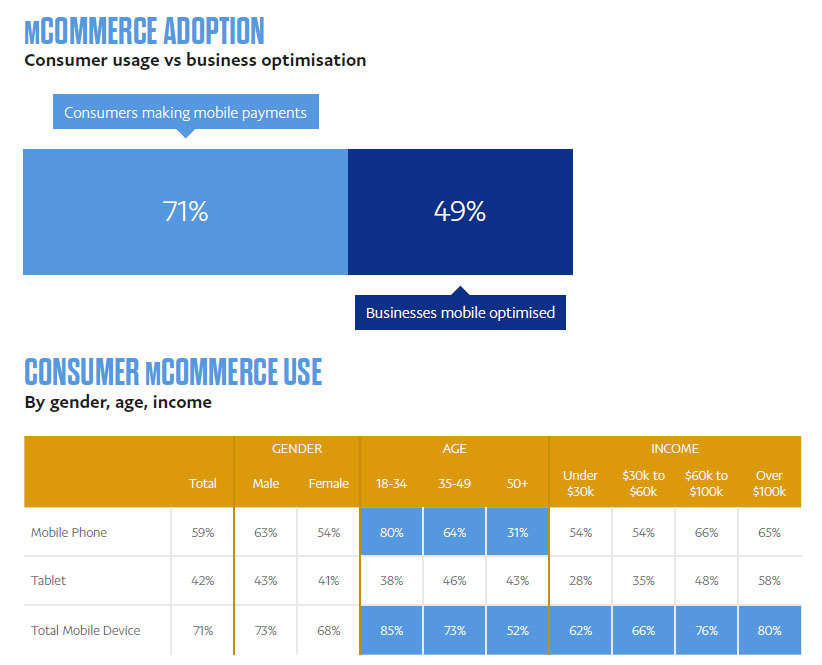
Almost three-quarters (71%) of respondents are using their mobiles to make payments, however only 49% of businesses are optimised to accept them.

The number of consumers transacting on mobile is perhaps not surprising, considering that Australia is a country with one of the highest levels of mobile penetration globally with 80% of the Australian 18+ population having a smartphone. Among consumers aged 18-34 the use of mobile devices for payments at 85% is significantly higher than the 71% average.

Despite these impressive consumer mCommerce levels, 51% of businesses state that they are not optimised for mobile sales. Furthermore, almost one-third (31%) of businesses state they have no plans to change this. This gap is reflected in the proportion (26%) of businesses which have zero sales via mobile device.

paypay1
When it comes to the devices that Australians prefer for making online purchases, desk and laptop computers are almost equally the favoured choice with 69% of respondents preferring to make payments on them. The remaining 31% of consumers prefer to make payments on their mobile phones (18%) or tablets (14%).

Of those who prefer to use a mobile phone, those aged 18-34 dominate at 30% preference, compared to 15% preference for those aged 35-49 and 7% for the 50+ demographic.

The PayPal mCommerce Index finds that those with an income of over $100k show the highest preference for mobile payments, at 37%. Nonetheless, those with incomes under $30k make up almost one-quarter (24%) of those preferring to use their mobiles for payments.

More than a third (36%) of respondents are making mobile payments at least once a week, while one in five (22%) make mobile payments more than once a week. Millennial consumers (18-34) are the most prolific mobile shoppers with nearly half of this group (47%) making a mobile payment at least once per week. High frequency mobile payments are not limited to the young, one quarter (24%) of 50+ respondents are making mobile purchases and payments at least once a week.

The average mCommerce spend is $330 per month and 22% of respondents are spending more than $500 per month. These figures establish a benchmark against which we will continue to track in ongoing PayPal mCommerce Index reports.

When reflecting on levels of consumer mCommerce spending, age is not a strong contributing factor to high spend. In fact, across the age groups surveyed, consumers who are spending more than $500 per month, were notably similar at 23%, 26% and 19% across the 18-34, 35-49 and 50+ age groups, respectively.

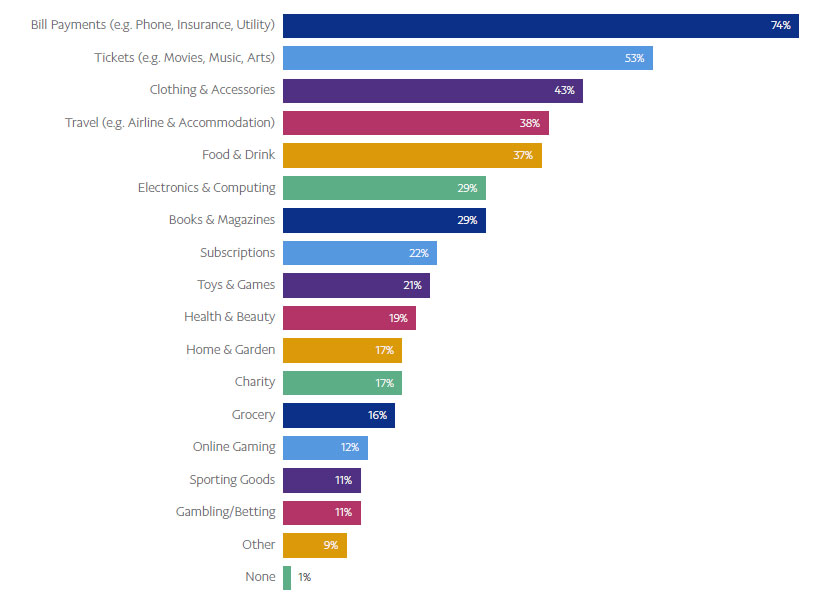
Bill payments is the category dominating mobile transactions. Almost three-quarters (74%) of respondents made phone, utility, insurance and other bill payments via a mobile device over the last six months. Other categories strongly supported by mCommerce are Tickets (53%), Clothing & Accessories (43%) and Travel (38%).

These top performing categories represent consumer transactions with major, mainstream businesses with well-established online commerce platforms. Regular and familiar use, plus lessened concerns for security by consumers, are believed to be factors in promoting mCommerce within these categories.

paypay2

When Australian consumers get time to themselves, they are more inclined to make an online purchase or payment by mobile device – with ‘dual-screening’ being commonplace. Eighty-two percent of respondents said they engaged in mCommerce when relaxing at home or watching TV; almost half (45%) noted that they were engaged in mCommerce when taking a break at work or school; and just over one-quarter (26%) used the time when commuting on public transport for mobile purchasing or payments.

The data shows that although the majority of consumers do not indicate that a mobile is their preferred device for online purchases, they are using their mobile devices to shop when they are at home, presumably when they also have access to a laptop or desktop computer. Understanding the prevalence of dualscreening can help to inform future mCommerce positioning, marketing and consumer targeting.

Social commerce is rapidly emerging as the new frontier for online commerce. Already, 11% of respondents have made a purchase via a social platform. As channels including Facebook, Twitter and Pinterest, where consumers are highly engaged, emerge as commercial avenues, Australian businesses need to adapt if they want to maximise their online commerce opportunities.

Currently, 7% of surveyed businesses accept payments via social media sites or apps.

Despite consumer appetite, the PayPal mCommerce Index finds that 89% of businesses have no intention of accepting payments via social media within the next 6 months.

The survey was executed through Roy Morgan Research Ltd based on the survey responses of 996 consumers and 106 businesses using an online self-completion survey.

Banking Industry Announces Improved Hiring Of Financial Advisers

The Australian Bankers Association says to help banks employ only competent and ethical financial advisers, the banking industry has today announced a new, improved way of hiring financial advisers.

This relates to wealth advisors only, not mortgage brokers. Why not extend it to all types of advice? You could also argue they should be doing this anyway, as part of best practice recruitment.

Piggy-Bank-3

“Sometimes a financial adviser can be removed from one financial institution for poor conduct, only to turn up working and continuing their poor practices at another,” Australian Bankers’ Association Executive Director – Retail Policy Diane Tate said.

“To help avoid this, the banking industry has developed a protocol to make it easier to check how financial advisers have performed in previous jobs.

“This will better identify financial advisers who have not met the industry’s minimum legal and ethical standards, and help employers make more informed recruitment decisions,” she said.

The protocol sets minimum standards for checking references and sharing information, through a series of standardised questions and record keeping practices.

“This is an important step by the banking industry to improve the quality of advice, support the professionalisation of the financial advice industry and build trust and confidence in banks,” Ms Tate said.

“The subscribing licensees to the protocol represent 38% of the entire financial advice market. The more widespread this is, the more effective it will be in making sure individuals with poor conduct records don’t move around the industry,” she said.

Banks and other financial advice providers can become a subscribing licensee by contacting the ABA.

Ms Tate said banks and regulators agreed on the need for financial institutions to do more to improve recruitment of financial advisers.

The protocol was developed with input from regulators and other stakeholders. Subscribing licensees will need to make changes to their recruitment practices to comply with the protocol by 1 March 2017.

“The ABA is also progressing work on establishing an industry register of conduct breaches covering all bank employees, which was announced in April as part of new initiatives to address concerns with conduct and culture in banks,” Ms Tate said.

The following table sets out the subscribing licensees to the Protocol.

Name  Subscribing licensee
AMP AMP Financial Planning (AFSL 232706)
Charter Financial Planning (AFSL 234665)
Hillross Financial Services (AFSL 232705)
ipac (AFSL 234656)
SMSF Advice (AFSL 234664)
Australia and New Zealand Banking Group ANZ Financial Planning (AFSL 234527)
Elders Financial Planning (AFSL 224645)
Financial Services Partners (AFSL 237590)
Millennium3 Financial Services (AFSL 244252)
Ri Advice Group (AFSL 238429)
Bendigo and Adelaide Bank Bendigo Financial Planning (AFSL 237898)
Commonwealth Bank BW Financial Advice (AFSL 230727)
Commonwealth Financial Planning (AFSL 231139)
Commonwealth Private (AFSL 314018)
Commonwealth Securities (AFSL 238814)
Count Financial (AFSL 227232)
Financial Wisdom (AFSL 231138)
Macquarie Group Macquarie Equities (AFSL 237504)
National Australia Bank Apogee Financial Planning (AFSL230689)
Garvan Financial Planning (AFSL230692)
Godfrey Pembroke (AFSL 230690)
JBWere (AFSL 341162)
Meritum Financial Group (AFSL245569)
MLC Financial Planning (AFSL230692)
NAB Financial Planning (AFSL 230686)
NAB Financial Planning Self Employed (AFSL 230686)
Suncorp Group Suncorp Financial Services (AFSL 229885)
Westpac Magnitude Group (AFSL 221557)
Securitor Financial Group (AFSL 240687)
Westpac Banking Corporation (AFSL 233714)

Home Prices Rebound To June 2016; Worth $6 Trillion

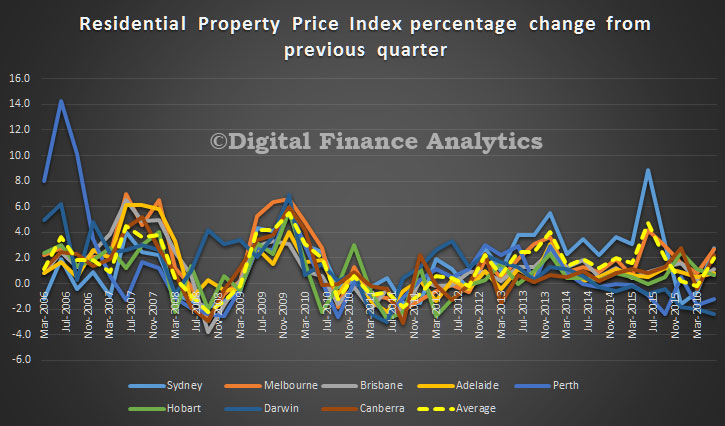
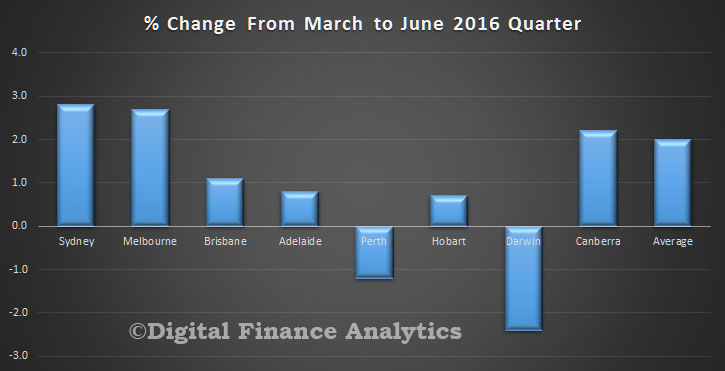
Sydney property prices rose in June quarter 2016 after six months of falls, according to figures released today by the Australian Bureau of Statistics (ABS).

Prices for established houses in Sydney rose 3.2 per cent and attached dwellings rose 2.0 per cent.

Residential property prices fell in Perth and Darwin, while prices rose in all other capital cities.

abs-june-2016-house-prices-trendMelbourne recorded the strongest through the year growth of 8.2 per cent, followed by Canberra at 6.0 per cent.

Established house prices for the eight capital cities rose 2.3 per cent and attached dwellings rose 1.4 per cent in the June quarter 2016.

abs-june-2016-house-pricesThe total value of Australia’s 9.7 million residential dwellings increased $138.3 billion to $6.0 trillion. The mean price of dwellings in Australia is now $623,000.

RBA Minutes Add Little

The latest minutes from the RBA tell us very little more than we already knew about the decision to keep the cash rate steady. They did continue to stress the benefit of rate cuts to households overall, because borrowers are more leveraged than savers (as discussed in their recent outing). We think they should be more concerned about the lack of business investment than they appear to be, net of housing.

RBA-Pic2

Domestic Economic Conditions

Members commenced their discussion of domestic economic conditions by noting that the prices of Australia’s commodity exports had increased since the previous meeting and were around 30 per cent above the lows of early this year. Further reductions in production of bulk commodities by high-cost producers in China had contributed to these price increases. Reflecting the rise in commodity prices since earlier in the year, the terms of trade had increased in the June quarter.

The ABS capital expenditure survey and measures of work done on non-residential construction indicated that mining investment had continued to fall in the June quarter, in line with the forecast presented in the August Statement on Monetary Policy. The estimate of nominal investment intentions from the capital expenditure survey implied a further large decline in mining investment in 2016/17, in line with earlier expectations. However, the peak subtraction from GDP growth was still expected to have occurred in 2015/16 and members noted that there had been some signs of an improvement in sentiment in parts of the mining industry.

Members observed that developments in commodity prices and mining investment had continued to have significant effects on economic activity in resource-rich regions of the country and that the effect of the spillovers from the decline in mining investment and commodity prices would persist for some time. The regional differences had been apparent in labour market outcomes. Members noted that a decline in full-time employment since the beginning of the year had been recorded in New South Wales, Western Australia and Queensland, but that part-time employment growth had been broadly based across the country. The relative strength of part-time employment had partly reflected growth in industries that have a higher proportion of part-time jobs, such as household services, although liaison contacts had also reported that employers more generally had been taking a cautious approach to hiring. Forward-looking indicators suggested that employment growth would remain relatively subdued in Western Australia and Queensland but would be stronger elsewhere. Overall, the forward-looking indicators were consistent with little change in the unemployment rate in the coming months; the unemployment rate had fallen slightly in July to 5.7 per cent.

Growth in the aggregate wage price index (WPI) had stabilised at low levels; the private sector WPI had increased by 0.5 per cent in each of the past six quarters. Growth in the WPI had continued to be lowest in the mining-exposed industries and states, although it also looked to have stabilised in these areas.

Members noted that the June quarter national accounts, which would be released the day after the meeting, were expected to record moderate GDP growth. Net exports were expected to have made a smaller contribution to GDP growth following strong growth in resource exports in the March quarter, whereas data released during the meeting indicated that public demand had made a noticeable contribution in the June quarter. Over the first half of the year, GDP growth had been expected to have been close to estimates of potential, which was consistent with the slight change in the unemployment rate that had been observed over that period.

Growth in household consumption was expected to have remained around average in the June quarter. Household perceptions of their personal finances had continued to be above average, although growth in retail sales had declined slightly in recent months. Members discussed the effect of lower interest rates on consumption growth via the cash flow channel of monetary policy. They noted that the positive effect of lower interest rates on the disposable income of borrowing households is larger than the negative effect on the income of lender households, as the average borrower household has two-to-three times more net interest-bearing debt than the average lender household has in net interest-earning assets. In addition, on average, borrower households are likely to be significantly more responsive to changes in income that are related to changes in interest rates because they are more likely to be liquidity constrained. Members noted that, since the global financial crisis, borrower households have been likely to use more of an increase in their cash flow from any source to prepay their debt, which might imply a delay in the response of consumption spending to lower interest rates.

Private residential building approvals had increased in July, to be around the high levels observed in 2015, and there continued to be a significant amount of work in the pipeline. Members noted that this could be expected to support high levels of dwelling investment for some time.

Conditions in established housing markets had generally eased over 2016. Growth in housing prices had declined at the national level and across most capital cities over the past year, although there remained considerable variation by location. Housing prices had been declining in year-ended terms in Perth for some time. In the rental market, inflation had remained around historical lows and had also eased across most capital cities, most notably in Perth, where rents had continued to decline. The aggregate rental vacancy rate had drifted higher and was close to its long-run average.

Other indicators for the housing market had also generally pointed to weaker conditions than a year earlier. In the established housing market, the number of auctions had declined and remained lower than a year earlier, even though auction clearance rates had increased of late (particularly in Sydney). In the private treaty market – where, nationally, over 80 per cent of transactions occur – turnover had also declined since the previous year and the average number of days that a property was on the market had been on an upward trend. Members noted that sales of new properties were included in the turnover data, but that there might be measurement problems related to the long lag between purchasing and settling new properties bought off the plan, which could lead to revisions. Finally, in recent months the value of housing loan approvals had been broadly steady and housing credit growth had been lower than a year earlier, consistent with the earlier tightening in lending standards and low turnover.

Business investment had fallen further in the June quarter, driven by a decline in mining investment in line with earlier expectations. The ABS capital expenditure survey also indicated that non-mining business investment had been little changed over the past couple of years. Members noted that uncertainty about future demand growth still appeared to be weighing on non-mining business investment. The pipeline of non-residential construction work had remained low, although non-residential approvals had increased a little in recent months and survey measures of business conditions and capacity utilisation had remained above their long-run averages. Growth in business credit had eased a little, although non-mining profits looked to have increased.

Alternative Default Models For Superannuation

The Productive Commission has released an issues paper as part of its inquiry into the superannuation system. This starts to unpick the complex maze of issues surrounding superannuation and is part of the mandate from February 2016 given by the Government “to conduct: a study to develop criteria to assess the efficiency and competitiveness of the superannuation system; and an inquiry to develop alternative models for a formal competitive process for allocating default fund members to products”. The inquiry is part of a three stage process running to 2020.

Audit-Pic

The concept of defaults (and their presence in workplace instruments) has been integral to the development of Australia’s superannuation system, largely stemming from the decision to make superannuation compulsory and the inherent complexity that individuals face in making decisions about retirement incomes. Having no defaults is their preferred, objective baseline for this inquiry. Alternative allocative models would be assessed against this baseline, and their relative performance against the agreed assessment criteria.

They make the point that default superannuation arrangements in Australia have primarily arisen out of the workplace relations system, though employees not employed under the national system are generally covered by state‑based systems.

MySuper was introduced in 2013. MySuper products were designed to be simple and cost‑effective superannuation products replacing previous default products. The intention was to ensure members do not pay for any unnecessary features they do not need or use.

For the purposes of this inquiry, the Commission will be developing models to allocate default fund members (employees who do not make an active choice about their superannuation fund) to default products. There is no intermediate decision of selecting a default fund.

The Commission proposes to assess alternative models against five criteria:

  • members’ best interests: meeting the best interests of members, by maximising long‑term net returns and allocating members to products that meet their needs
  • competition: fostering competition between funds that drives innovation and cost reductions, facilitates new entrants to the market (contestability) and leads to efficient long‑term outcomes
  • integrity: minimising scope for the allocation process to be manipulated (or ‘gamed’), including by using clear metrics that are difficult to dispute and by holding funds accountable for the outcomes they deliver to members
  • stability: supporting a stable superannuation system, including by building trust and confidence in funds regulated by APRA
  • system‑wide costs: minimising the total costs to members, employers and funds, including costs associated with regulatory compliance, complexity, ‘churn’ and ‘gaming’, and minimising costs to government of implementing and administering the models.

The five criteria collectively capture competition and efficiency. These criteria essentially relate to the benefits and costs of each model, and will be assessed from the perspective of the community as a whole. As noted, the Commission proposes to assess benefits and costs relative to a baseline scenario of no default system.

Some of the models being tabled are:

Administrative model

In an administrative model, a government body would use a ‘filter’ to determine which products are eligible to be used as defaults. This filter (the regulatory mechanism) would be akin to a set of minimum standards that products must meet. The filter would not rank the relative performance of products.

Market‑based models

A market‑based model would involve some form of explicit and formalised process through which products compete to be deemed eligible as defaults: in other words, some form of a tender or reverse auction process. Numerous variations in design have been proposed in the literature and exist in practice. However, at its heart, the market model involves superannuation funds bidding for the right to receive contributions from default members.

Active choice by employees

The baseline to be used in this inquiry is that there is no default system at all. After nearly 25 years’ experience, it could be even argued that this itself be a new allocation model, where employees themselves must make an active choice of superannuation product. This would remove the employer’s responsibility for choosing a default fund and place the onus on the employee, who may be better placed to make a decision in his or her own best interests. However, research on an active choice model (without defaults) is scarce. Most countries that have employer‑funded superannuation also have some variant of a default option.

An active choice model need not be completely decentralised. A filter or a market‑based mechanism could be used to narrow choices or ‘nudge’ members to high‑performing fund.

They are seeking submissions and alternative suggestions for models by 28 October 2016.

Lending changes make property more attractive for SME owners

From Australian Broker.

Lending changes by Australia’s major banks could soon result in a surge of property purchases by small and medium-sized enterprise (SME) owners.

Payment-Pic

Westpac this week announced they would increase their loan to value ratio (LVR) from 80% to 90% of a property’s value self-employed borrowers after the Commonwealth Bank announced similar changes earlier this year.

The last 12 months have also seen Westpac, CBA and St. George announce they would only require one year of financial records as income verification for self-employed borrowers. Previously they had required two years of financial records and tax returns.

Joel Wyld, director of mortgage broker Peasy, said the lending changes indicate lenders’ perceptions of SME borrowers are evolving.

“In the past banks have viewed the SME demographic as risky despite many owners coming from strong corporate or trades backgrounds with a long successful working history in addition to strong equity in various investment classes,” Wyld said.

“In the past, many SME owners have had to settle for low doc loans for a two year period which has deterred them from purchasing property,” he said.

While some of the lending changes have been in force for some time, Wyld said a large number of SME owners are unaware of the more lenient lending criteria and with more than two million SME owners across Australia it could provide brokers with an excellent opportunity to extend their client base.

“The time is now ripe for SME owners to capitalise on the new lending rules to secure either a dream home or business premises,” he said.

“The number one piece of advice given to SME owners when applying for a property loan is to ensure financials are up-to-date. Inaccuracies in financial records and book keeping will delay the settlement process and could ultimately determine if the loan application is accepted or declined.”

Wyld said there has also been a growing trend towards establishing property trusts and partnerships using property as vehicle for SME owners, though he said while those structures have a place in the market, brokers need to be careful when assessing income of a business if multiple owners are involved and should recommend those involved seek legal advice.

But Australian Firms Have High DSR’s Too

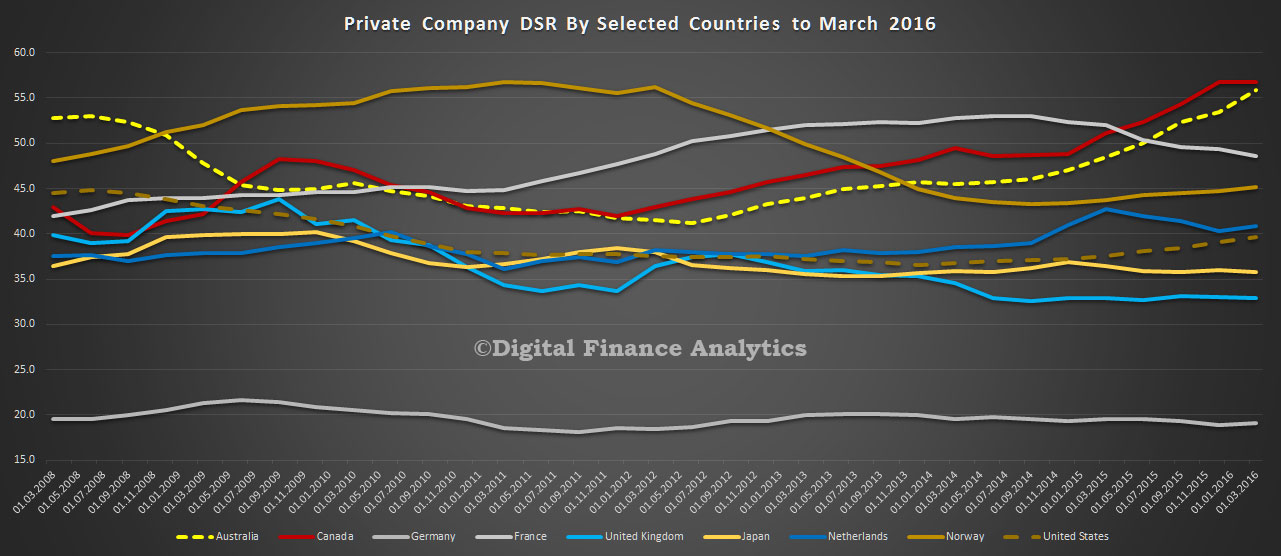
Australian firms have some of the highest Debt Service Ratio’s in the world according to data from the Bank for International Settlements. Alongside the household Debt Service Ratios, which we discussed earlier BIS also published a series on the DSR’s of non-financial companies.

Australian and Canadian companies have the highest DSR’s and both show a strong upward trajectory. Many other countries have lower, and flatter profiles. The higher the DSR, the greater the strain on company cash flow.

This many well explain the relatively slow rise in additional debt being drawn down by Australian firms (other than funding for investment property!) and the knock-on effects of lower real productive growth.

coy-dsr-bis-mar-2016We think DSR’s should be more widely studied as a bellwether for future economic performance.

New DSR Comparisons Confirms High Australian Household Debt

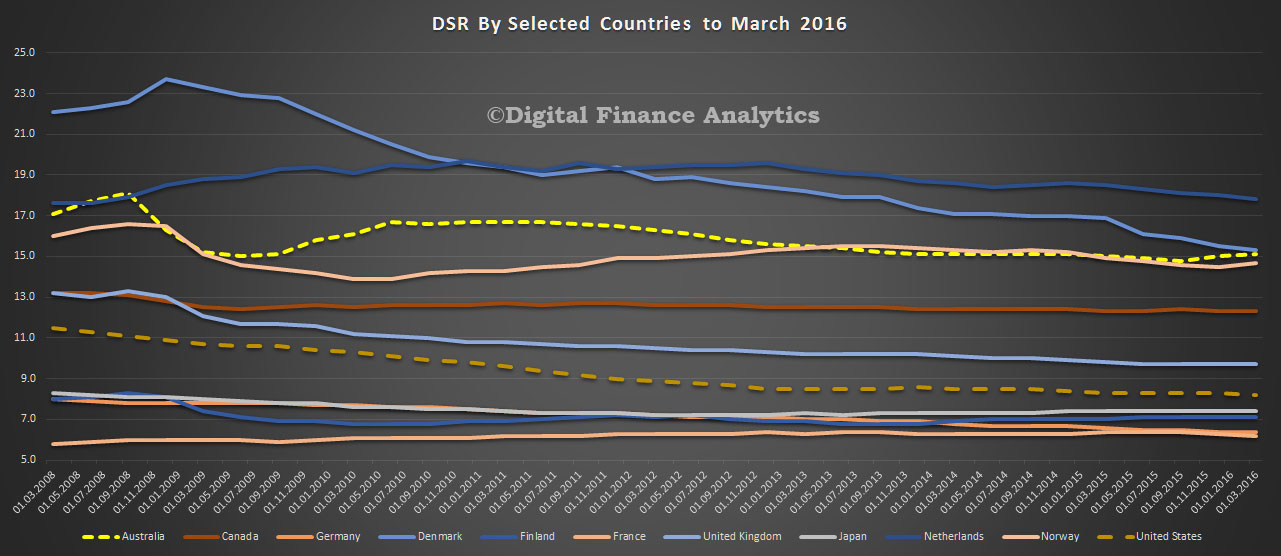
Australian households have the third highest, and rising debt service ratio, when compared to a wide range of advanced western economies, according to new data released by the Bank for International Settlements (BIS).

This is a timely update from BIS who calculated DSR’s for households and non-financial companies using data from countries national accounts. You can read about their approach here.

The comparative results are interesting, especially give low global interest rates. There are significant variations and the last results are to March 2016.

Australia is near the top of the DSR scores at 15.1, well behind Netherlands and just below Norway. Many other advanced economies are much lower. However, we also see a different trajectory in Australia, with stronger growth here, compared with a static or falling pattern elsewhere.

This is further evidence of the household debt problem here. Of course we had cash rate cuts later in the year, but debt has continued to rise, and our estimate is average household DSR currently sits around 16. If we are right, the rising trajectory has continued.

dsr-bis-mar-2016You can read our more detailed DSR analysis of Australian households, where we discuss the profile across postcodes.

Should Wells Fargo execs responsible for bilking customers be forced to return their pay?

From The Conversation.

Having spent five years supervising large financial institutions on Wall Street, I am rarely surprised by the latest news of banks behaving badly.

But even the most hardened cynics, such as myself, were taken aback by the recent announcement that Wells Fargo was being fined US$185 million for fraudulent sales practices that included opening over two million fake deposit and credit card accounts without informing its customers.

Adding to my shock was the revelation that the firm fired 5,300 employees over the course of five years for engaging in this behavior, clearly evidence that this was more than just a few bad apples.

Complaint-TTy

The financial crisis and its aftermath have taught us that it is unlikely any of Wells Fargo’s senior executives will face criminal charges. The reasons for this are numerous, but essentially prosecutors have a hard time identifying criminal intent within the upper ranks of bank management.

At the very least, don’t Wells Fargo’s customers have a reasonable expectation that executives who profited off their misfortune be required to return some of their ill-gotten gains?

The good news is that in April, U.S. regulators released a proposed rule requiring financial institutions to do just that. Unfortunately for fraud victims seeking a pound of flesh from Wells Fargo executives, the rule is not scheduled to be finalized until November, although the bank claims to be in adherence with the proposal’s main provisions.

Nonetheless, I thought it would be interesting to examine the text of the proposed incentive-based compensation rule through the lens of the Wells Fargo situation to try and understand its potential implications.

Cultural failure

On the surface Wells Fargo’s fraud appears to be an all-too-familiar case of cultural failure within a big financial institution. Apparently CEO John Stumpf disagrees.

In a Wall Street Journal interview shortly after the story broke, Stumpf refused to admit any institutional failure at the bank, claiming the behavior of the terminated employees “in no way reflects our culture nor reflects the great work the other vast majority of the people do.”

If Stumpf thinks that over 5,000 unethical people just so happened to find their way to Wells Fargo, he may want to rethink the company’s hiring practices.

Thus far the company has declined to say how many branch, regional or corporate managers were among those let go. The initial readout seems to be that most of those dismissed were low-level branch employees – hardly your typical Wall Street villains.

The spotlight has now turned to senior managers, and what they did or did not know. It is shining brightest on Carrie Tolstedt, who has run Wells Fargo’s community banking division since 2008 and is set to retire at the end of the year. Tolstedt appears to have profited handsomely from the sales practices in question.

A 2015 company filing indicates that part of Tolstedt’s 2014 inventive compensation award of roughly $8 million stems from:

“success in furthering the company’s objectives of cross-selling products from other business lines to customers, reinforcing a strong risk culture and continuing to strengthen risk management practices in our businesses.”

It now appears that cross-selling products and strengthening risk management were competing objectives.

Clawing back compensation

As noted earlier, Wells Fargo says it’s already in compliance with the main provisions of the proposed rule.

Specifically, in a recent filing, the bank claims:

“Wells Fargo has strong recoupment and clawback policies in place designed so that incentive compensation awards to our named executives encourage the creation of long-term, sustainable performance, while at the same time discourage our executives from taking imprudent or excessive risks that would adversely impact the Company.”

This means the bank can cancel, or claw back, any incentive-based executive compensation, such as deferred bonuses or stock options, from executives who engaged in misconduct or who received such compensation based upon materially inaccurate information, “whether or not the executive was responsible.”

Thus far the company has given no indication it intends to claw back any of Tolstedt’s compensation, although pressure from the public and regulators may soon change this.

The proposed rule

So let’s imagine the new incentive-based compensation rule was already in place and consider how it would work.

The rule’s most stringent requirements apply to “level 1” financial institutions like Wells Fargo with over $250 billion in consolidated assets. Its provisions cover all employees who receive incentive-based compensation, with enhanced requirements for individuals referred to as senior executive officers and significant risk takers.

As head of a major business line, Tolstedt would qualify as a senior executive officer, and her compensation would be subject to:

  • higher minimum deferral requirements – the percentage of incentive-based compensation that cannot be cashed in until the passing of a specific amount of time (meant to encourage long-term thinking);
  • forfeiture of “unvested” compensation (that is, compensation that has been awarded but has yet to be fully transferred to the employee); and
  • clawbacks for so-called vested compensation that has already been transferred to the employee.

Since Tolstedt is retiring soon, the rule’s minimum deferral requirements are less relevant here. But for past performance periods, unvested compensation could be forfeited and vested pay could be clawed back.

Even if one generously assumes Tolstedt was unaware of the fraud taking place, she was still likely responsible for setting the sales goals and compensation structure that incentivized so many employees to defraud customers. Indeed the firm’s own filings with the SEC seem to confirm this. Using these assumptions and applying the text of the proposed rule, it is clear that nearly all of her unvested incentive-based compensation could be forfeited, and her vested compensation could also be at risk of being clawed back.

The proposed rule identifies several types of events that would require covered firms to initiate a forfeiture review. Those most relevant in the Wells Fargo situation include:

  • inappropriate risk-taking, regardless of the impact on financial performance;
  • material failures of risk management or control; or
  • noncompliance with statutory, regulatory or supervisory standards that results in enforcement or legal action against the covered institution brought by a federal or state regulator or agency.

The proposal leaves it to the firm to determine the amount to be forfeited, provided it can support its decisions.

The standards that trigger a review of whether vested compensation should be clawed back are higher (though firms can loosen them). Such situations include a senior executive officer engaging in misconduct that results in significant financial or reputational harm to the institution, fraud or intentional misrepresentation of information used to determine the employee’s incentive-based compensation.

Based on the facts as we currently know them, it would be difficult to prove Tolstedt met the rule’s clawback criteria, since it’s not known if she actually engaged in the fraud herself. If she had, all of the incentive-based compensation that had vested since the fraudulent activity began would be subject to being clawed back.

‘Standard-bearer of our culture’

Assuming the rule was currently in effect, and Wells Fargo was adhering to it, how much would Tolstedt stand to lose?

This is almost impossible to determine given that she has worked at the firm for 27 years, we don’t know how long the fraudulent activity went on for, publicly available information on her compensation is limited and the rule leaves it up to the firm to determine the dollar amount that is forfeited and/or clawed back.

The Consumer Financial Protection Bureau’s Wells Fargo ruling indicates the “relevant period” lasted from Jan. 1, 2011, to Sept. 8, 2016. Over that time frame, Tolstedt received at least $36 million in incentive-based compensation, compared with $8.5 million in base salary.

Under the terms of the proposed rule, Wells Fargo would be able to get back at least half of the $36 million. If Tolstedt was found to have known about the fraud taking place within her division, they could likely get it all back.

When the firm announced in July that Tolstedt would be retiring at the end of the year, Stumpf referred to her as a “standard-bearer of our culture” and “a champion for our customers.” At the time, the firm was winding down its five-year employee purge.

Knowing what we know now, Stumpf could have easily fired her and attempted to claw back a significant amount of her pay. Instead he chose loyalty to a long-time employee over loyalty to his customers. Next time that choice may be off the table.

Author: Lee Reiners, Director of Global Financial Markets Center, Duke University