Continuing our detailed analysis of mortgage LVR, DST and LTI across Australia, using data from our houshold surveys, today we feature a 3D map of relative Debt Service Ratios (DSR) by postcode. There are some interesting variations. The greater the height, the higher the DSR.
As we said in our earlier post, DSR is is the ratio between gross household income and the amount paid on the mortgage. More specifically, the DSR is defined as the ratio of interest payments plus amortisations to income. As such, the DSR provides a flow-to-flow comparison – the flow of debt service payments divided by the flow of income. We think the DSR is an important lens to look at households debt footprint, but the ratio is highly sensitive to interest rates because as interest rates fall, the ratio improves. Current DSR ratios are often seen as reasonable because of the current ultra low rates, but of course that tells us nothing about the impact of rising rates later. The average DSR is 16.8, but there is a very wide spread.
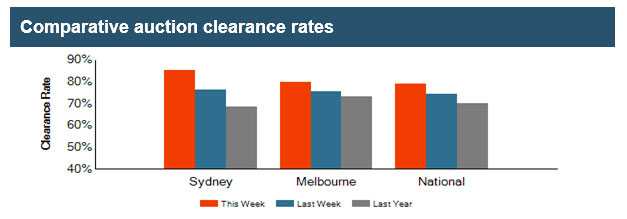
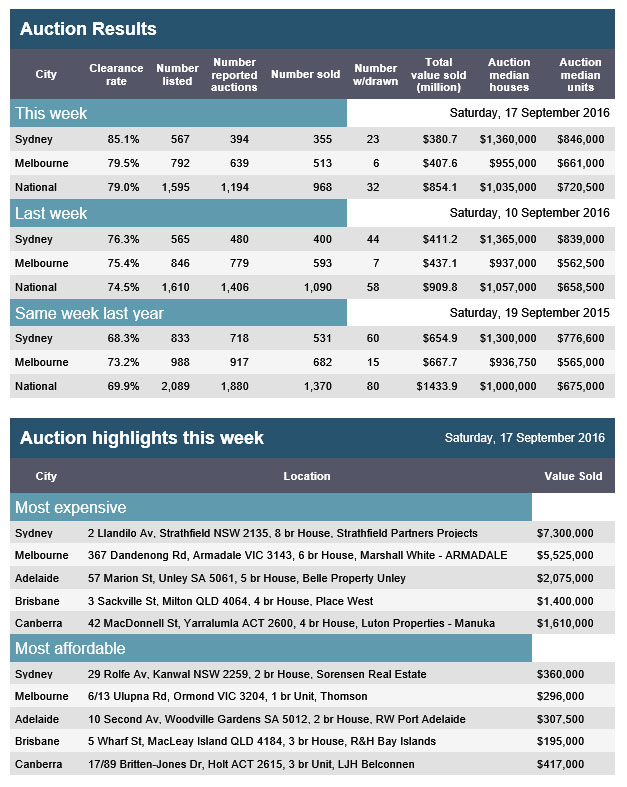
APM Pricefinder preliminary auction clearance results once again confirms the appetite for property, especially in Sydney. Nationally the clearance rate was 79% on 1,595 listings, compared with 74.5% on 1,610 last week. A year ago it was 68.9% on 2,089. Again we see higher clearances on lower volumes, but sales are being closed.
Sydney hit 85.1%, the highest across the country on 567 listings, whilst Melbourne continues to have more property listed but a lower clearance rate. Adelaide cleared 78% of 62 listed and Brisbane cleared 49% of 107 listed. Canberra results are still to come in.
The Government has released the terms of reference which will govern the appearance of the big four banks before the Standing Committee On Economics.
The Treasurer has asked the committee to hold public hearings at least annually with the four major banks focusing on:
domestic and international financial market developments as they relate to the Australian banking sector and how these are affecting Australia
developments in prudential regulation, including capital requirements, and how these are affecting the policies of Australian banks
the costs of funds, impacts on margins and the basis for bank pricing decisions, and
how individual banks and the banking industry as a whole are responding to issues previously raised in Parliamentary and other inquiries, including through the Australian Bankers’ Association’s April 2016 six point plan to enhance consumer protections and in response to Government reforms and actions by regulators.
Given the aim of the appearances was to counter calls for a Royal Commission on the finance sector, they do appear very gentle. Whilst there are some culture-related issues being handled by the ABA’s internal processes, sharper question about remuneration practices, complaints as well as structural and organisational issues should be on the agenda, if the sessions are to have teeth. For example:
How does the vertically integrated business structures, across banking, wealth and insurance, and from advice through to sales and service (both via internal and third party channels) impact consumer outcomes?
Do commission arrangements degrade the quality of advice, product fit and price consumers receive?
What are the root causes of the recent raft of poor practice and complaints. What is being done to address them?
Current volatility in the bond market caused by uncertainty in global central bank policies could put upward pressure on bond yields, according to Eaton Vance as reported in Investor Daily.
The firm described the recent rise in government bond yields as “a splash of cold water to the face” of investors who were complacent about the ‘lower for longer’ mindset.
The impending US election and the possibility of US Federal Reserve interest rate rises are not the only drivers of volatility, Eaton Vance said, adding that the actions and comments of other central banks were also playing a role.
“The Bank of Japan is reportedly exploring ways to steepen the yield curve in Japanese bonds to help the banking sector and, therefore, aid its transmission method for policy,” the firm said.
Eaton Vance noted that the Bank of Japan has promised a broad review of its policies at its upcoming meeting, while European Central Bank president Marion Draghi declined to comment on whether or not the bank would expand its bond buying program.
“Put it all together and we’re potentially seeing a change in tone from central banks on interest rates and the slope of global yield curves,” Eaton Vance said.
“The European Central Bank and Bank of Japan have acknowledged publicly that the compression in yield spreads from short to longer maturities has hurt bank profitability. The implication is that with profitability hindered, banks have less incentive to lend.”
If these two central banks did adjust their policy settings to support the banking industry, Eaton Vance said, the Federal Reserve itself could increase rates marginally, which in turn could put upward pressure on global yield curves.
“The long end of global yield curves could see upward pressure based on this adjustment, as well as fiscal policy crowding out what would normally be private borrowers,” the firm said.
The latest (Q2 16) US Financial Accounts have been released, containing data on the flow of funds and levels of financial assets and liabilities. The data will increase the likelihood of a fed rate rise, offsetting the more negative news released yesterday.
The net worth of households and nonprofits rose to $89.1 trillion during the second quarter of 2016. The value of directly and indirectly held corporate equities increased $452 billion and the value of real estate rose $474 billion. The figure plots the contributions to the change in net worth of households and nonprofit organizations. The black line plots the total change in net worth, while the bars represent the changes in the main components of net worth: market value of directly and indirectly held corporate equity (dark blue), market value of real estate holdings (green), and other assets net of liabilities (light blue). Other assets include consumer durable goods, nonprofit organizations’ fixed assets, and financial assets other than corporate equity.
Household debt increased at an annual rate of 4.4 percent in the second quarter of 2016. Consumer credit grew 6.4 percent, while mortgage debt (excluding charge-offs) grew 2.5 percent at an annual rate.
Domestic nonfinancial debt outstanding was $46.3 trillion at the end of the second quarter of 2016, of which household debt was $14.5 trillion, nonfinancial business debt was $13.2 trillion, and total government debt was $18.6 trillion. The figure plots the 4-quarter moving average percent growth rate of debt outstanding for domestic nonfinancial sectors at a quarterly frequency. The growth rate of debt is calculated as the seasonally adjusted flow divided by the seasonally adjusted level in the previous period, multiplied by 100. In the Financial Accounts, debt equals the sum of debt securities and loans.
Domestic nonfinancial debt growth was 4.4 percent at a seasonally adjusted annual rate in the second quarter of 2016, down from an annual rate of 5.4 percent in the previous quarter.
Nonfinancial business debt rose at an annual rate of 4.1 percent in the second quarter, down from an annual rate of 9.4 percent in the previous quarter.
State and local government debt rose at an annual rate of 2.2 percent in the second quarter of 2016, up from an annual growth rate of 0.8 percent in the previous quarter.
Federal government debt increased 5.0 percent at a seasonally adjusted annual rate in the second quarter of 2016.
Mergers and acquisitions among mid-tier EU banks are more likely than large-scale deals such as between Deutsche Bank and Commerzbank, whose recent discussions were reported in the media, says Fitch Ratings.
This is because many of the larger banks, traditional acquirers of other banks, are capital constrained, making it more difficult to fund sizeable deals. Convincing board members and shareholders that consolidation is a sound choice at a time when returns generated by many EU banks are poor is likely to be tough.
Data published by the European Banking Authority shows that EU banks earned an average return on equity of only 4.7% in 2015, well below the 10% cost of capital that EU banks typically quote as a benchmark figure. Banks in more concentrated banking systems, such as Sweden, the Czech Republic and Slovakia, report relatively strong returns, suggesting that consolidation in countries with more fragmented banking systems would strengthen the banks.
The EU’s competition authorities may raise objections if two large EU banks wanted to merge. However, in a recent interview, Daniele Nouy, Chair of the ECB’s Supervisory Board, said “for us supervisors, in the euro area we do not see any markets with too few banks. I would even say that in some parts of the euro area there is room for consolidation and bank mergers.”
There are over 3,300 banks operating in the EU, but over half of these are savings and cooperative banks operating as part of mutual support banking groups. Smaller banks not linked to such groups may struggle to continue to operate independently in a challenging environment of low interest rates, mounting regulatory pressures and still sluggish economic growth. We forecast eurozone GDP growth of 1.4% 2017 and 2018.
Savings and cooperative banks that are part of wider groups benefit from operational support from central bodies or from liquidity and wholesale banking arrangements with specialist banks in their groups. The local banks continue to merge among themselves and there is a trend for greater centralisation, but at a faster pace in some countries than in others. In January 2016 Rabobank’s 106 local cooperative banks were merged into their central institution and the group now operates under a single banking licence. Germany’s two remaining central cooperative banks, DZ BANK and WGZ BANK, merged on 29 July, but over 1,000 local cooperative banks and over 400 savings banks operate in Germany.
Recent M&A activity among EU banks has mostly been tailored to specific situations, such as where vested interests are already present. The planned merger of Nordea’s and DNB’s Baltic operations, announced on 25 August, should be straightforward, as both are long-term investors in the region. However, even transactions involving acquirers with vested interests can experience high execution risks.
CaixaBank’s offer to acquire the shares it does not already own in Banco BPI is a good example. If CaixaBank takes full control of BPI, it should be easier to implement strategic changes at the Portuguese bank. The current ownership structure – where CaixaBank holds 45.16% of BPI but its voting rights are capped at 20% – has complicated this. Execution risks are high and lifting CaixaBank’s voting rights limit – a precondition for the take-over – is not yet agreed. Shareholders, set to vote on 6 September, were frustrated by a court injunction introduced by a minority shareholder. BPI’s general assembly will resume on 21 September.
Italy has acted to solve such corporate governance issues by requiring its popolari (cooperative) banks to transform into limited liability companies. This helped pave the way for the merger of Banco Popolare and Banca Popolare di Milano, which received regulatory approval on 8 September.
France’s Oddo et Cie’s acquisition of Germany’s BHF-Bank earlier this year is an attempt to strengthen a niche franchise cross-border. The combination of Oddo and BHF-Bank could be an interesting independent player with presence in two large European economies. BHF-Bank was the third acquisition Oddo had made in Germany in 18 months.
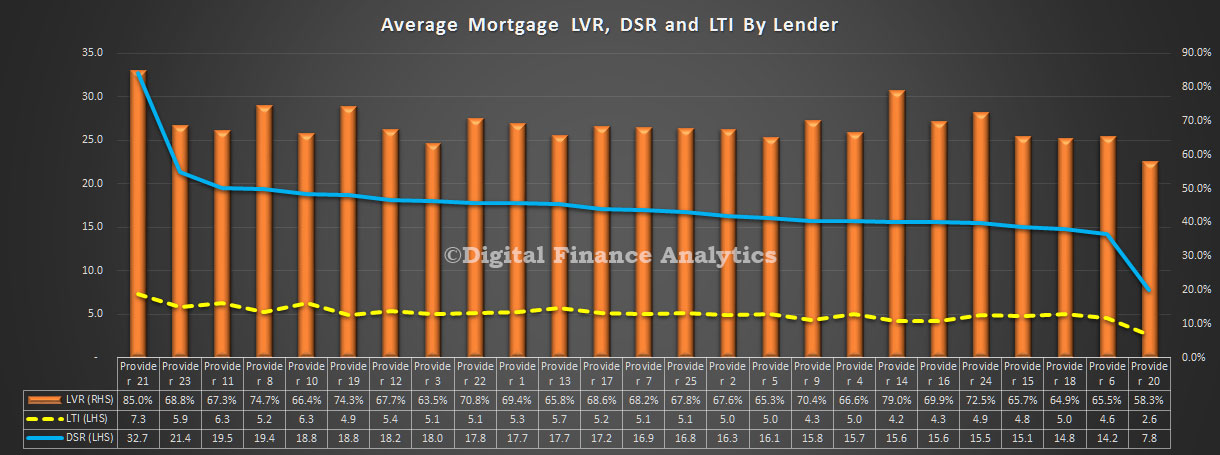
In the latest of our series on deep home loan segmentation, using DSR, LTI and LVR we compare the averages across a number of lender portfolios. The chart shows the average from a range of 20 or so lenders in our surveys, including banks, non-banks, credit unions and building societies. We have selected lenders to give an indication of the spread of the results, but have masked the individual brands. For some, the average LVR in the portfolio is sitting north of 80%, whilst others are below 60%. The highest DSR is averaging at 32, whilst the lowest in 7.8. The highest LTI is on average 7.3, compared with 2.6 for the lowest.
These findings underscore that underwriting criteria do vary, risks in the portfolio will also vary, and the mix of business does change across the market.
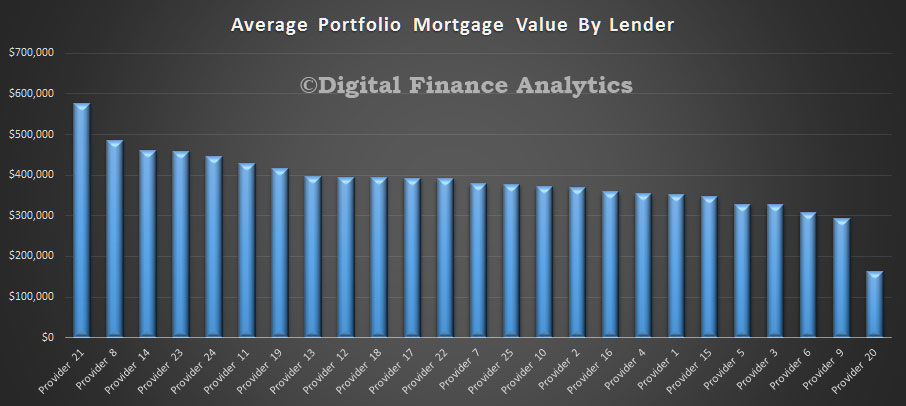
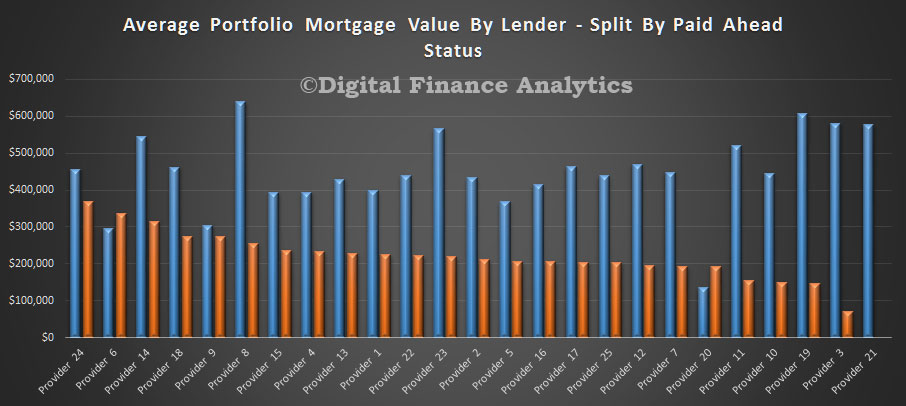
Another view is the average loan value in the portfolio. Once again we found a surprising range of values, from just below $600k, down to $180k. Many factors influence the average of course, including lending policy, type of loan, time on book, how much households have paid ahead, and other factors.
Here is a split of average balances by lender of loans paid ahead and those who are not.
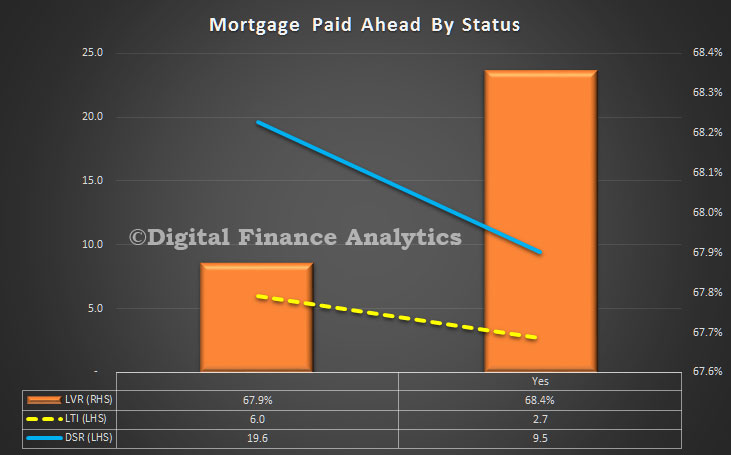
We see that households who are paying ahead generally have lower loan balances (reflecting differences in the LVR, LTI and DSR status). This chart provides more insight.
Those who have paid ahead have a lower LTI (2.7 compared with 6.0), lower DSR (9.5 compared with 19.6) but a slightly higher LVR. The portfolio averages are LTI 5.1, DSR 16.9 and LVR 68%.
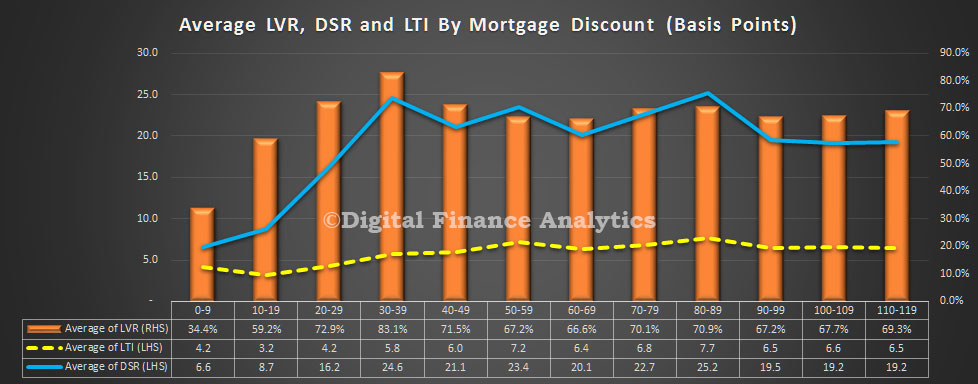
Another interesting lens is the mortgage discounts being achieved by households, compared with LVR, LTI and DSR. It appears the best discounts are being made on LVR’s below 80%, but LTI and DSR have less bearing on the achieved rates. A low DSR or LTI does not necessarily translate into a bigger discount – something which lenders may want to reconsider, given the relative risks involved.
Australia’s largest member-owned financial services provider CUA, posted an annual consolidated Net Profit after Tax (NPAT) of $51.66 million, up 5.8 per cent on last year’s result. The result was driven by member growth, up 7,935, taking total members to 439,713 across the banking and health insurance businesses, as well as strong growth in net interest income. Consolidated assets grew 7.6 per cent for the year to a record $12.90 billion. Their “Life rich banking” strategy appears to be working.
Capital adequacy and return on assets (ROA) remained steady against the previous corresponding period, while CUA’s return on equity (ROE) improved to 6.25 per cent.
Moody’s assigned a new A3 issuer rating to CUA in July 2015 and recently affirmed this rating in its review of operating conditions for the banking sector – this is the highest rating available to mutuals. This is a second rating for CUA, in addition to its BBB+ rating through S&P.
CUA’s banking business (or ADI) posted a full-year NPAT of $53.03 million, up 8.7 per cent on the previous year. The ADI results reflected strong performance across CUA’s core banking products and services, as well as commission and dividend income associated with CUA’s subsidiaries.
CUA recorded above-system home loan balance growth of 8.2 per cent amidst strong competition, soft economic conditions and regulatory restrictions. The continued high quality and low risk of CUA’s lending growth flowed through to the balance sheet, with only 6.5 per cent of CUA’s home loan portfolio having a Loan to Valuation Ratio (LVR) above 90 per cent.
While home loans remained the key driver of balance growth, the volume of personal loans issued during FY16 increased 14.7 per cent on the previous year to $186.1 million. Loans under management increased by $802.44 million, or 7.7 per cent, for the year.
Retail deposits up 7.1 per cent for the year to a record $8.33 billion.
The strong earnings result was driven by higher net interest income, up 10.3 per cent to $232.77 million and reflecting higher interest revenue from record lending in the previous year.
CUA Health posted a full-year NPAT of $1.08 million and continued to achieve strong growth in new customers. A total of 8,618 new policies were taken out during the year and 80,278 people were insured with CUA Health as at 30 June, up 9.7 per cent on the previous year. Whilst premium revenue rose 15.8 per cent to $135.76 million, the insurer returned almost 20 per cent more in benefits to policy-holders, at a total $122.96 million. Policy holders received around 89 cents in the dollar in benefits, higher than the industry average.
Credicorp Insurance posted a full-year NPAT of $1.15 million, an increase of $0.57 million on the previous year. This subsidiary now provides general insurance to 14,200 members.
CUA Chief Executive Officer Rob Goudswaard said “This result provides a strong platform to continue investing in communities, digital and member-facing initiatives to ensure CUA remains relevant to members’ changing needs, particularly during key life changes.”
“As a mutual, our members can be confident that all CUA investments are aimed at providing a better member experience and building stronger communities. That approach underpins our new Mutual Good community strategy, with increased funding to be directed to both new and existing CUA community initiatives.”
Under the Mutual Good strategy approved by the Board, CUA has started working towards increasing community investment to up to 3 per cent of NPBTC.
“We’ve also invested in an improved member experience this year, launching our first on-balance sheet CUA credit card, progressing the first phase of our streamlined loans application system and upgrades to mobile and online banking. We’re also making it easier for new members joining CUA to open a transaction account online in a few simple steps.”
Competition was another key focus for CUA and Mr Goudswaard said CUA would seek to continue working with government and industry groups to secure a competitive financial services landscape to benefit members and consumers more broadly. He hoped to see progress on implementing the recommendations from the Financial System Inquiry and the Senate Inquiry into co-operative, mutual and member-owned firms.
Mr Goudswaard said CUA’s focus on member-centric digital initiatives – including the new mobile banking app launched in August 2015 and a new CUA website in early 2016 – had driven increased use of CUA’s digital channels.
“We’re now exceeding 3 million logins and more than 1.5 million transactions using our digital channels each month – double the number of ATM transactions in a month. CUA now has more than 170,000 members using online or mobile banking and our mobile banking app has 15,500 more users than a year ago.”
Moody’s says the Fed does not set interest rates in a vacuum. Indeed, the federal funds rate is shaped by a host of drivers that are hardly limited to labor market conditions.
Despite warnings from high-ranking Fed officials that ultra-low interest rates are not forever, recent soundings of business activity, as well as the nearness of November 8’s Presidential election, weigh against a hiking of the federal funds rate prior to the FOMC’s December 14 meeting. Moreover, recent data question whether 2016 will be home to even a single rate hike.
In a September 12 speech, Fed governor Lael Brainard presented a convincing case favoring an extended stay by exceptionally low benchmark interest rates. On several occasions, Governor Brainard challenged the wisdom of a preemptive rate hike that intends to thwart inflation before it takes hold. Given “the absence of accelerating inflationary pressures” and the limited scope for lowering of fed funds in the event recession risks rise, Brainard argues for the continuation of a highly accommodative monetary policy. Basically, the macroeconomic costs of mistakenly hiking rates too early are viewed as well exceeding the potential inflationary costs of waiting too long to confront inflation. The damage done by a premature rate hike may be harder to repair than the damage resulting from above-target price inflation.
However, there is an alternative view that views ultra-low interest rates as doing more harm than good because of how cheap money (i) boosts savings in order to compensate for negligible interest income and (ii) forces investors to purchase riskier assets offering higher, though volatile, returns.
Futures now sense 2016 will end without a rate hike
As measured by the CME Group’s FedWatch tool, fed funds futures assign an implied probability of only 12% to a hiking of fed funds at the September 21 meeting of the FOMC. Thereafter, the implied likelihood barely rises to 20% for the November 2 meeting and climbs no higher than 47% for the FOMC’s deliberations of December 14. For now, the futures market does not expect a single rate hike for 2016.
The latest declines by the implied probabilities of rate hikes at the FOMC’s remaining three meetings for 2016 stemmed from lower than expected August readings for retail sales and industrial production. Despite the latest indications of subpar business sales, US equities rallied. Moreover, an accompanying drop by the VIX index hinted a narrowing of the high-yield spread that recently widened from September 8’s 18-month low of 508 bp to September 14’s 538 bp. Nevertheless, at some point, the corporate earnings outlook will overrule the now predominant influence of Fed policy. Unless business sales soon accelerate sufficiently, market participants will begin to fret over the adequacy of earnings for 2016’s final quarter and all of 2017.
The UK Bank Rate was held at 0.25%, government bond purchases at £435bn and corporate bond purchases at up to £10bn. Inflation remains well below target and business investment weak.
The Bank of England’s Monetary Policy Committee (MPC) sets monetary policy to meet the 2% inflation target and in a way that helps to sustain growth and employment. At its meeting ending on 14 September 2016, the MPC voted unanimously to maintain Bank Rate at 0.25%. The Committee voted unanimously to continue with the programme of sterling non-financial investment-grade corporate bond purchases totalling up to £10 billion, financed by the issuance of central bank reserves. The Committee also voted unanimously to continue with the programme of £60 billion of UK government bond purchases to take the total stock of these purchases to £435 billion, financed by the issuance of central bank reserves.
The package of measures announced by the Committee at its August meeting led to a greater than anticipated boost to UK asset prices. Short and long-term market interest rates fell notably following the announcement; corporate bond spreads narrowed, and issuance was strong; and equity prices rose. Since then, some of the falls in yields have reversed, driven by somewhat stronger-than-expected UK data and a generalised rise in global yields.
Many banks announced cuts in Standard Variable Rate and Tracker mortgage rates in line with the cut in Bank Rate. Deposit rates fell in August, although on average these falls were slightly smaller than the cut in Bank Rate. Fixed rates on new mortgage lending also fell.
Overall, while the evidence on the initial impact of the policy package is encouraging, the Committee will monitor closely changes in asset prices and in interest rates facing households and firms and their effect on economic activity.
The MPC set out its most recent detailed assessment of the economic outlook in the August Inflation Report. Based on the data available at that time, the Committee judged that the UK economy was likely to see little growth in the second half of 2016. In light of the tendency for survey indicators to overreact to unexpected events, the Committee expected some bounce-back in surveys of business and consumer sentiment following the sharp falls in the immediate aftermath of the vote to leave the European Union. Nevertheless, since the August Inflation Report, a number of indicators of near-term economic activity have been somewhat stronger than expected. The Committee now expect less of a slowing in UK GDP growth in the second half of 2016.
It was more difficult to draw a strong inference from these data about the Committee’s projections for 2017 and beyond. Moreover, there had been no new information since the August Inflation Report relevant for longer-term prospects for the UK economy.
In the August Inflation Report, the Committee judged that some parts of the economy would be more sensitive than others to heightened uncertainty. Business and housing investment were expected to decline in the second half of 2016, while consumption growth was expected to slow more gradually, alongside households’ real disposable incomes. While most business investment intentions surveys weakened further since the August Inflation Report, the near-term outlook for the housing market is less negative than expected and the indicators of consumption have been a little stronger than expected. Overall, these data remain consistent with the Committee’s judgement in the August Inflation Report that business spending would slow more sharply than consumer spending in response to the uncertainty associated with the United Kingdom’s vote to leave the European Union.
Data on global economic activity have generally been in line with the Committee’s August Inflation Report projections, with growth in the United Kingdom’s major trading partners expected to continue at a modest pace over the next three years.
Twelve-month CPI inflation remained at 0.6% in August, lower than projected at the time of the August Inflation Report, and well below the 2% inflation target. As the unusually large drags from energy and food prices attenuate, CPI inflation is expected to rise to around its 2% target in the first half of 2017, consistent with the August Inflation Report, albeit with the projection a little lower over the remainder of 2016 than had been anticipated in August.
The Committee’s view of the contours of the economic outlook following the EU referendum had not changed. News on the near-term momentum of the UK economy had, however, been slightly to the upside relative to the August Inflation Report projections. The Committee will assess that news, along with other forthcoming indicators, during its November forecast round. If, in light of that full updated assessment, the outlook at that time is judged to be broadly consistent with the August Inflation Report projections, a majority of members expect to support a further cut in Bank Rate to its effective lower bound at one of the MPC’s forthcoming meetings during the course of this year. The MPC currently judges this bound to be close to, but a little above, zero.
Against that backdrop, at its meeting ending on 14 September, MPC members judged it appropriate to leave the stance of monetary policy unchanged.